A couple of years ago I built a Matrix Synapse server and connected it to the decentralised global Matrix chat network that is federated world wide by enthusiasts who host their own Matrix servers. Due to the enthusiasm for a decentralised network the Matrix has grown exponentially and is now an established force in the world of Opensource global communication services.
When I built my server and configured it online my aim was to bring together an enthusiastic group of Radio Amateurs (Radio HAMs) who could build a friendly, welcoming community where people could share, learn and have fun with other liked minded individuals without all the nonsense you see on commercial social media platforms.
Overtime we’ve increased the number of rooms available in the HAM Radio space and the number of subjects covered. This has grown organically as our community has grown and we’ve ventured together into new areas of the hobby.
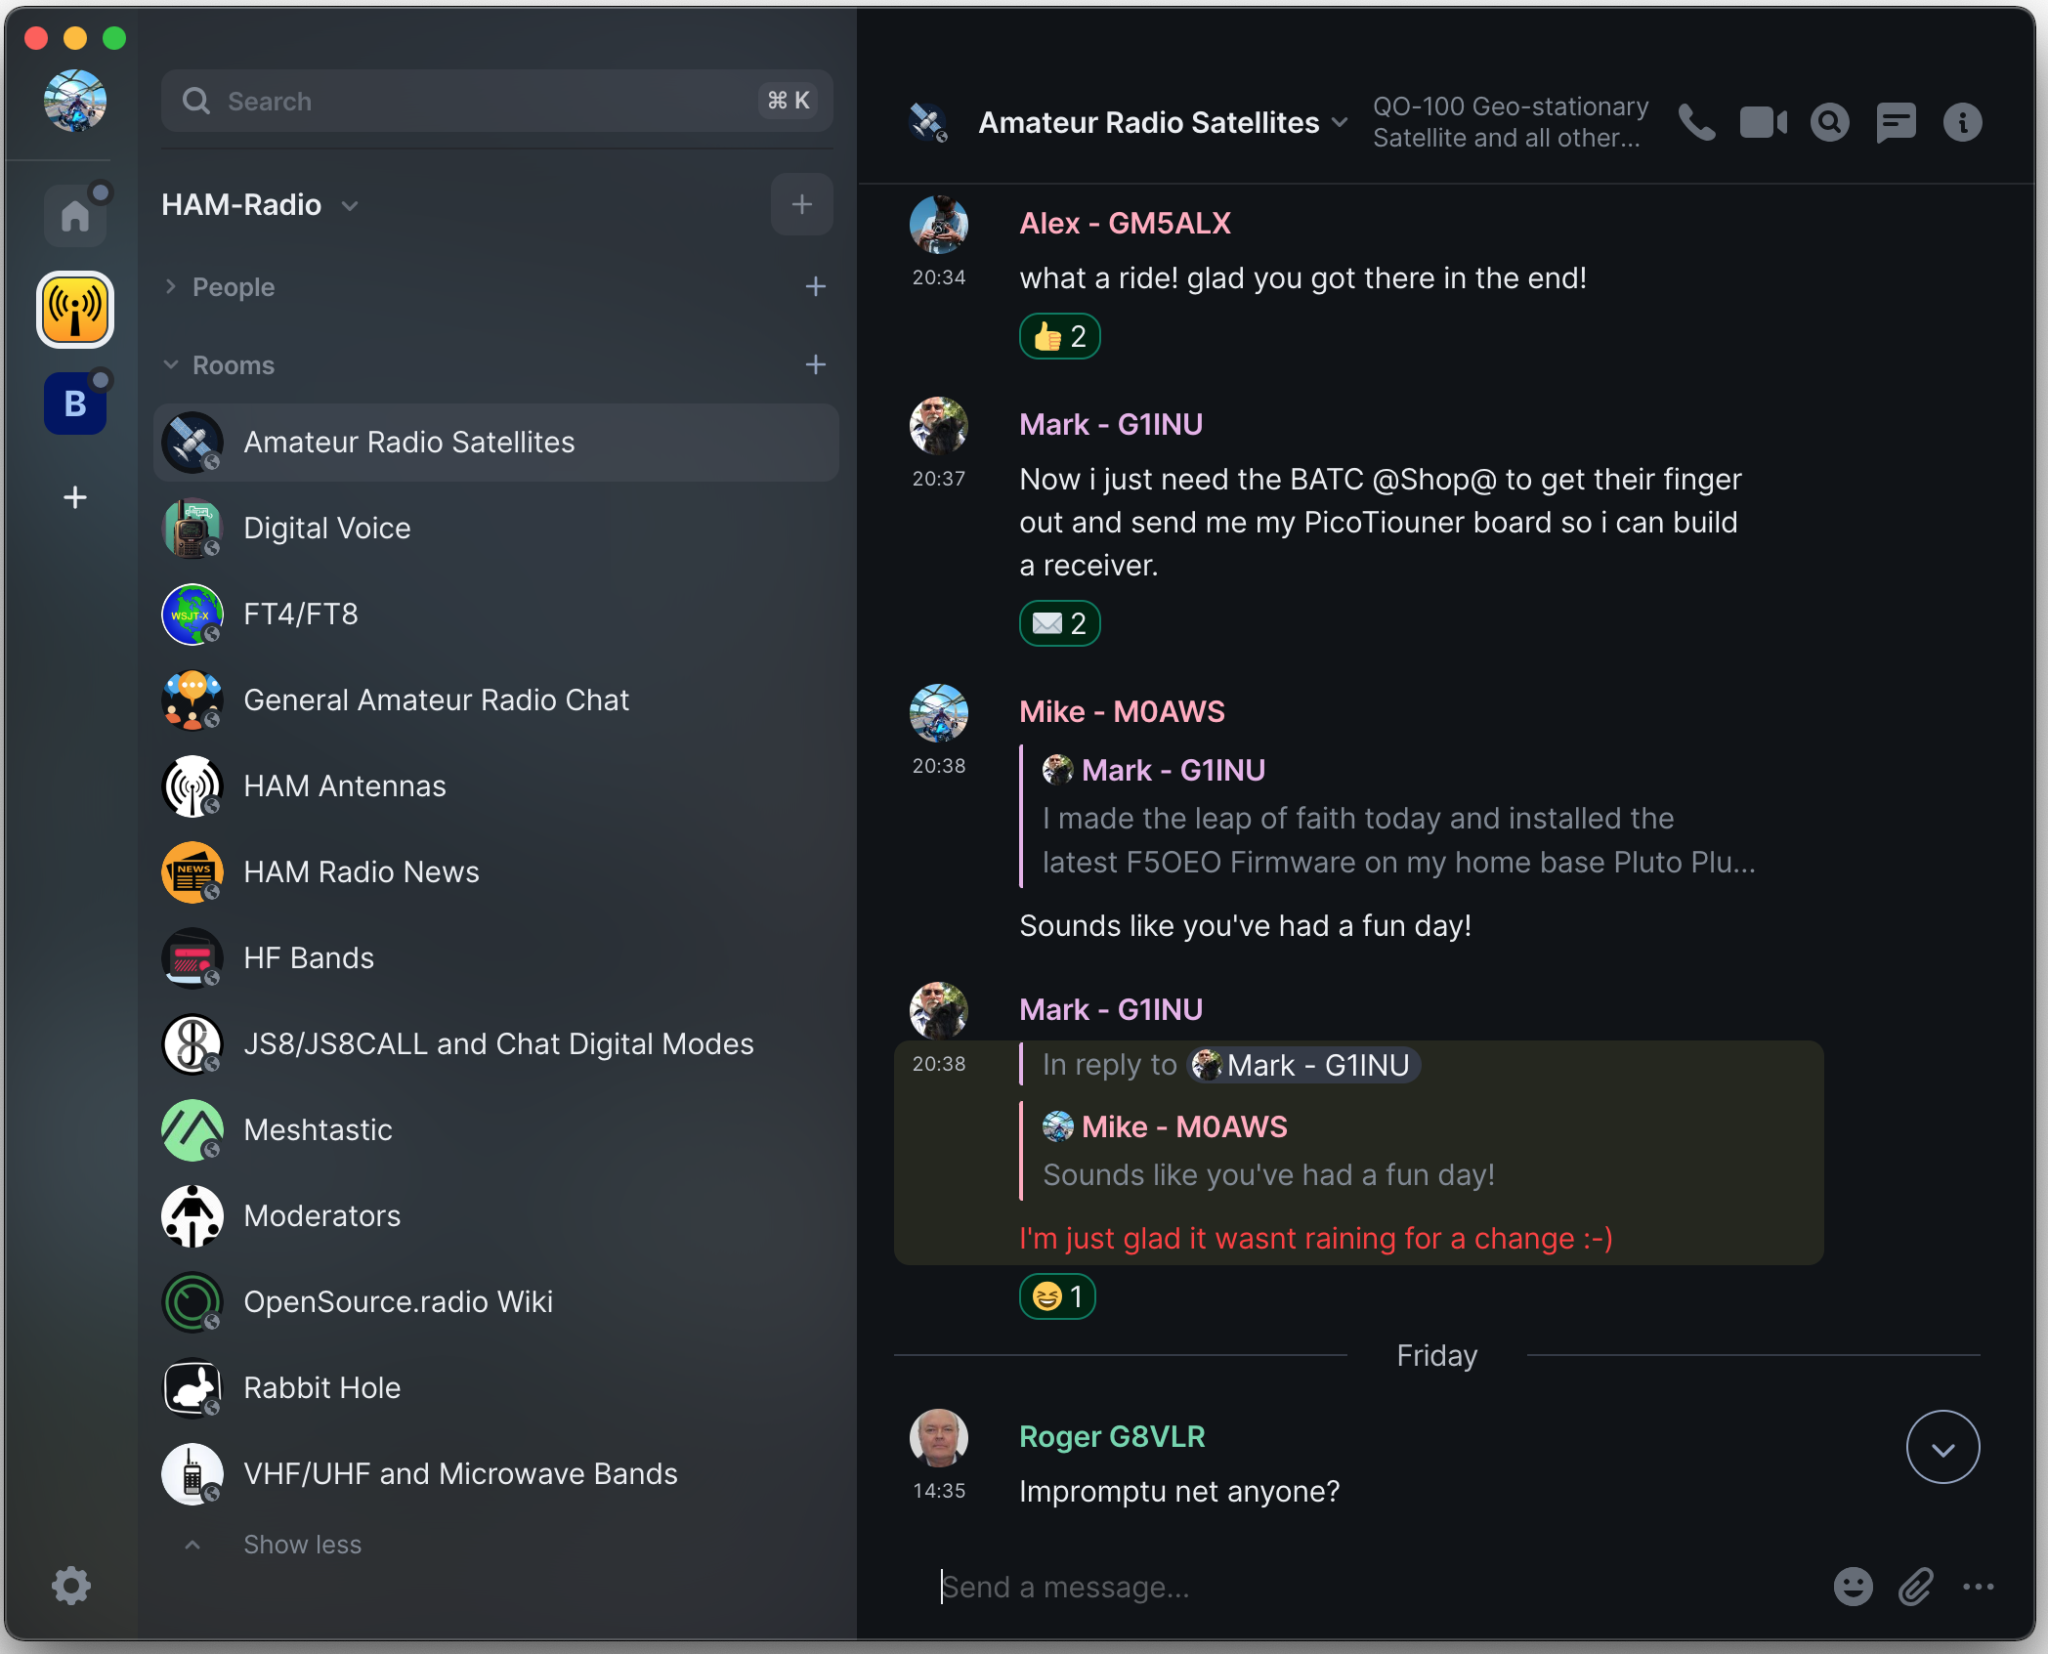
Global Matrix Ham Radio Space hosted on the M0AWS Matrix Server
From the community a number of projects have spawned including the Opensource.radio Wiki that Mike, DK1MI is sponsoring that aims to detail all the Opensource HAM Radio software, Hardware and projects in one centralised site on the internet. This is a great project and one I am very happy to contribute to.
Thanks to Mike, DK1MI we now also have our own Matrix AllStarLink node available. This is a great resource for the community as it is often not possible for all of us to communicate via the radio waves due to geo-location, time zones, local planning regulations etc. Having this 24/7 internet based resource makes it a lot easier for the community to chat at any time even when propagation on the HF bands isn’t in our favour.
We also have a very active satellite room with regular nets on the QO-100 satellite. With such a great range of rooms and subjects there’s plenty to read and talk about with the community.
If you fancy being part of this growing, enthusiastic group of Radio Amateurs and Short Wave Listeners (SWLs) then click on the link below and come and say hello, a warm welcome awaits!
For a couple of weeks now I’ve been playing with Node Red to add functionality to my digital mode applications.
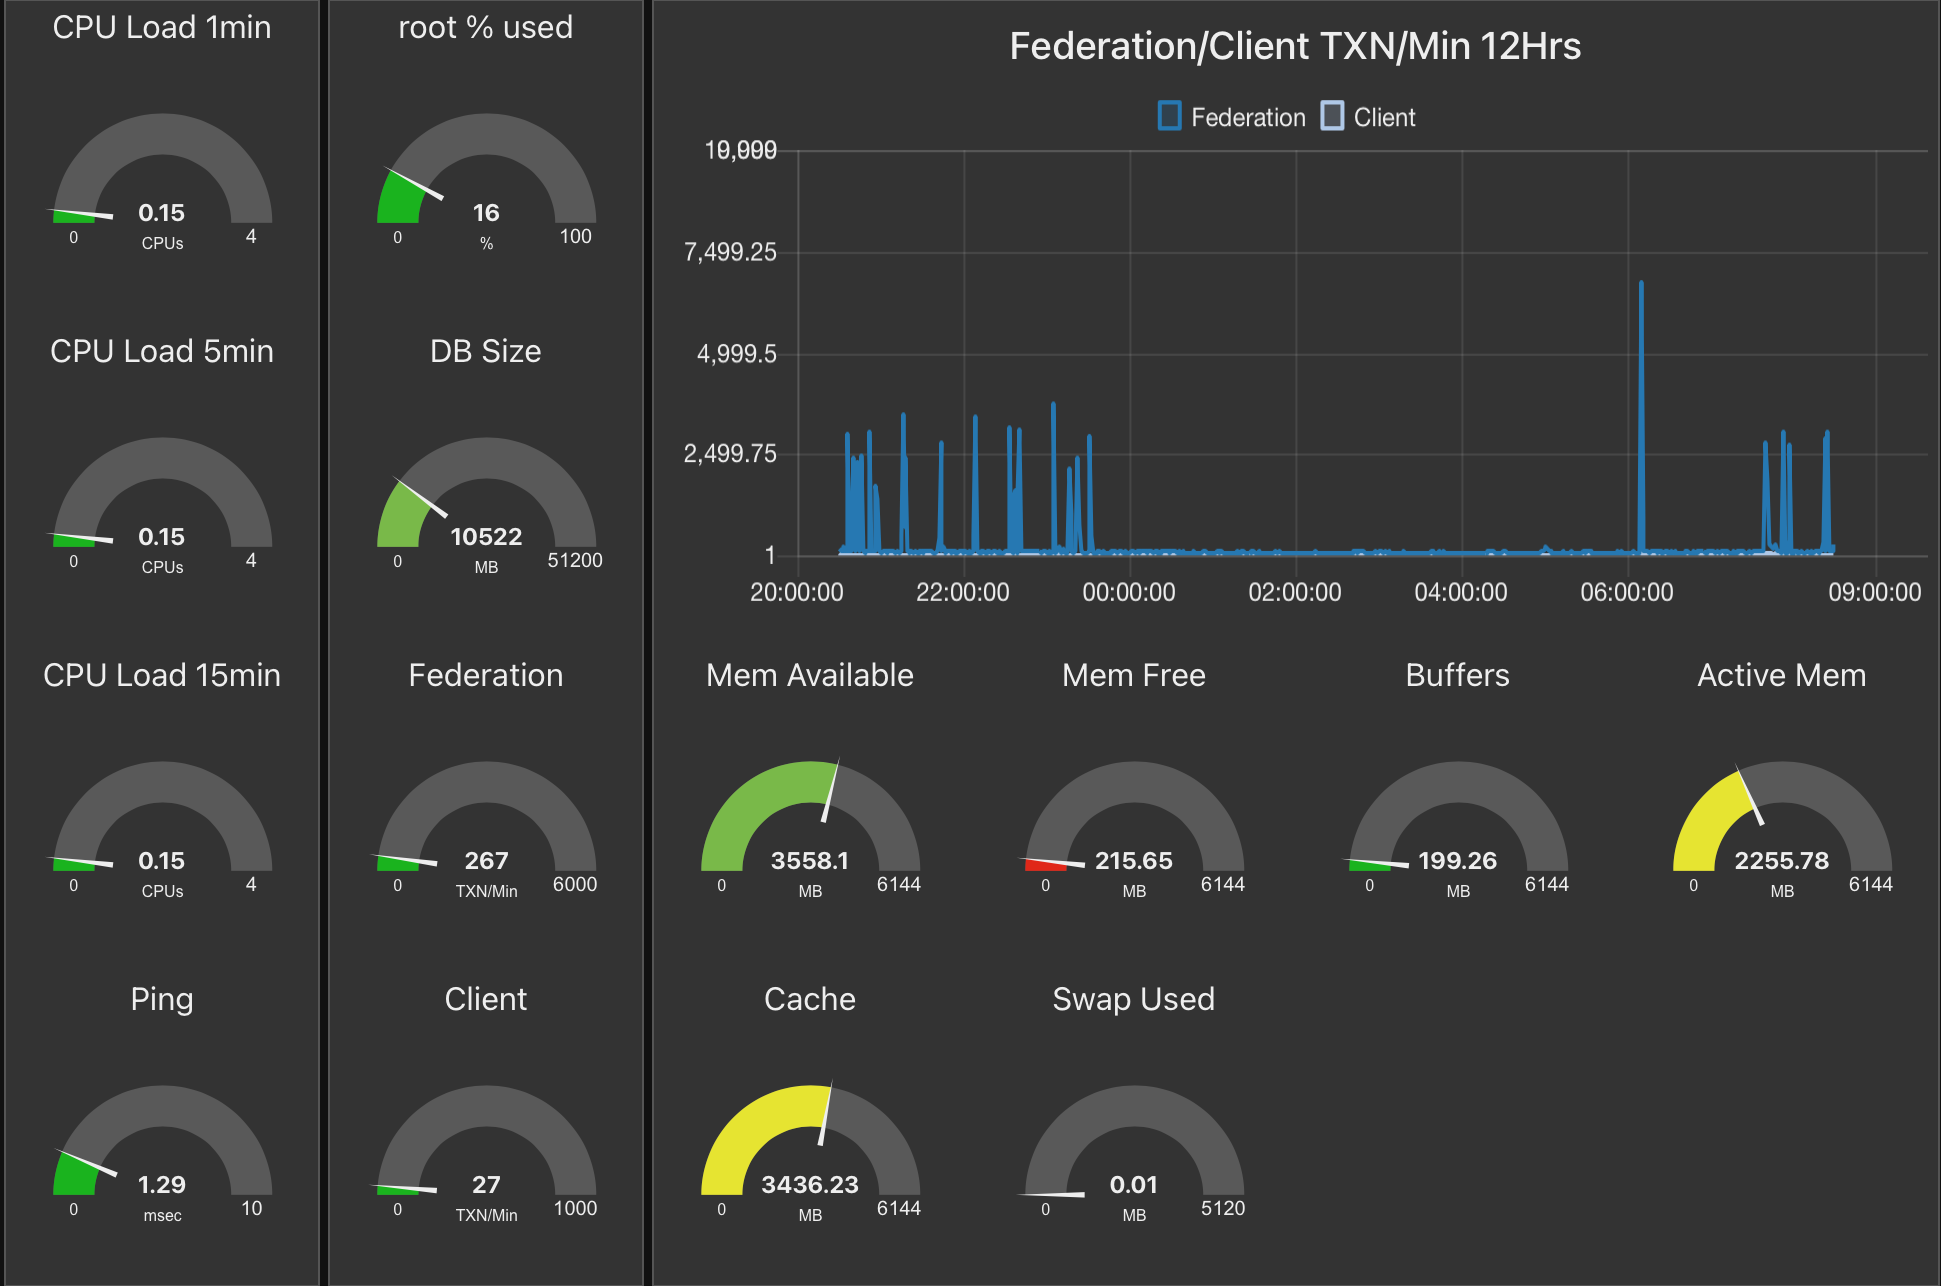
To get to know how it all works I initially used Node Red to create a series of dash boards for my servers and virtual machines to show realtime information on CPU temperature, CPU load, memory usage and storage etc.
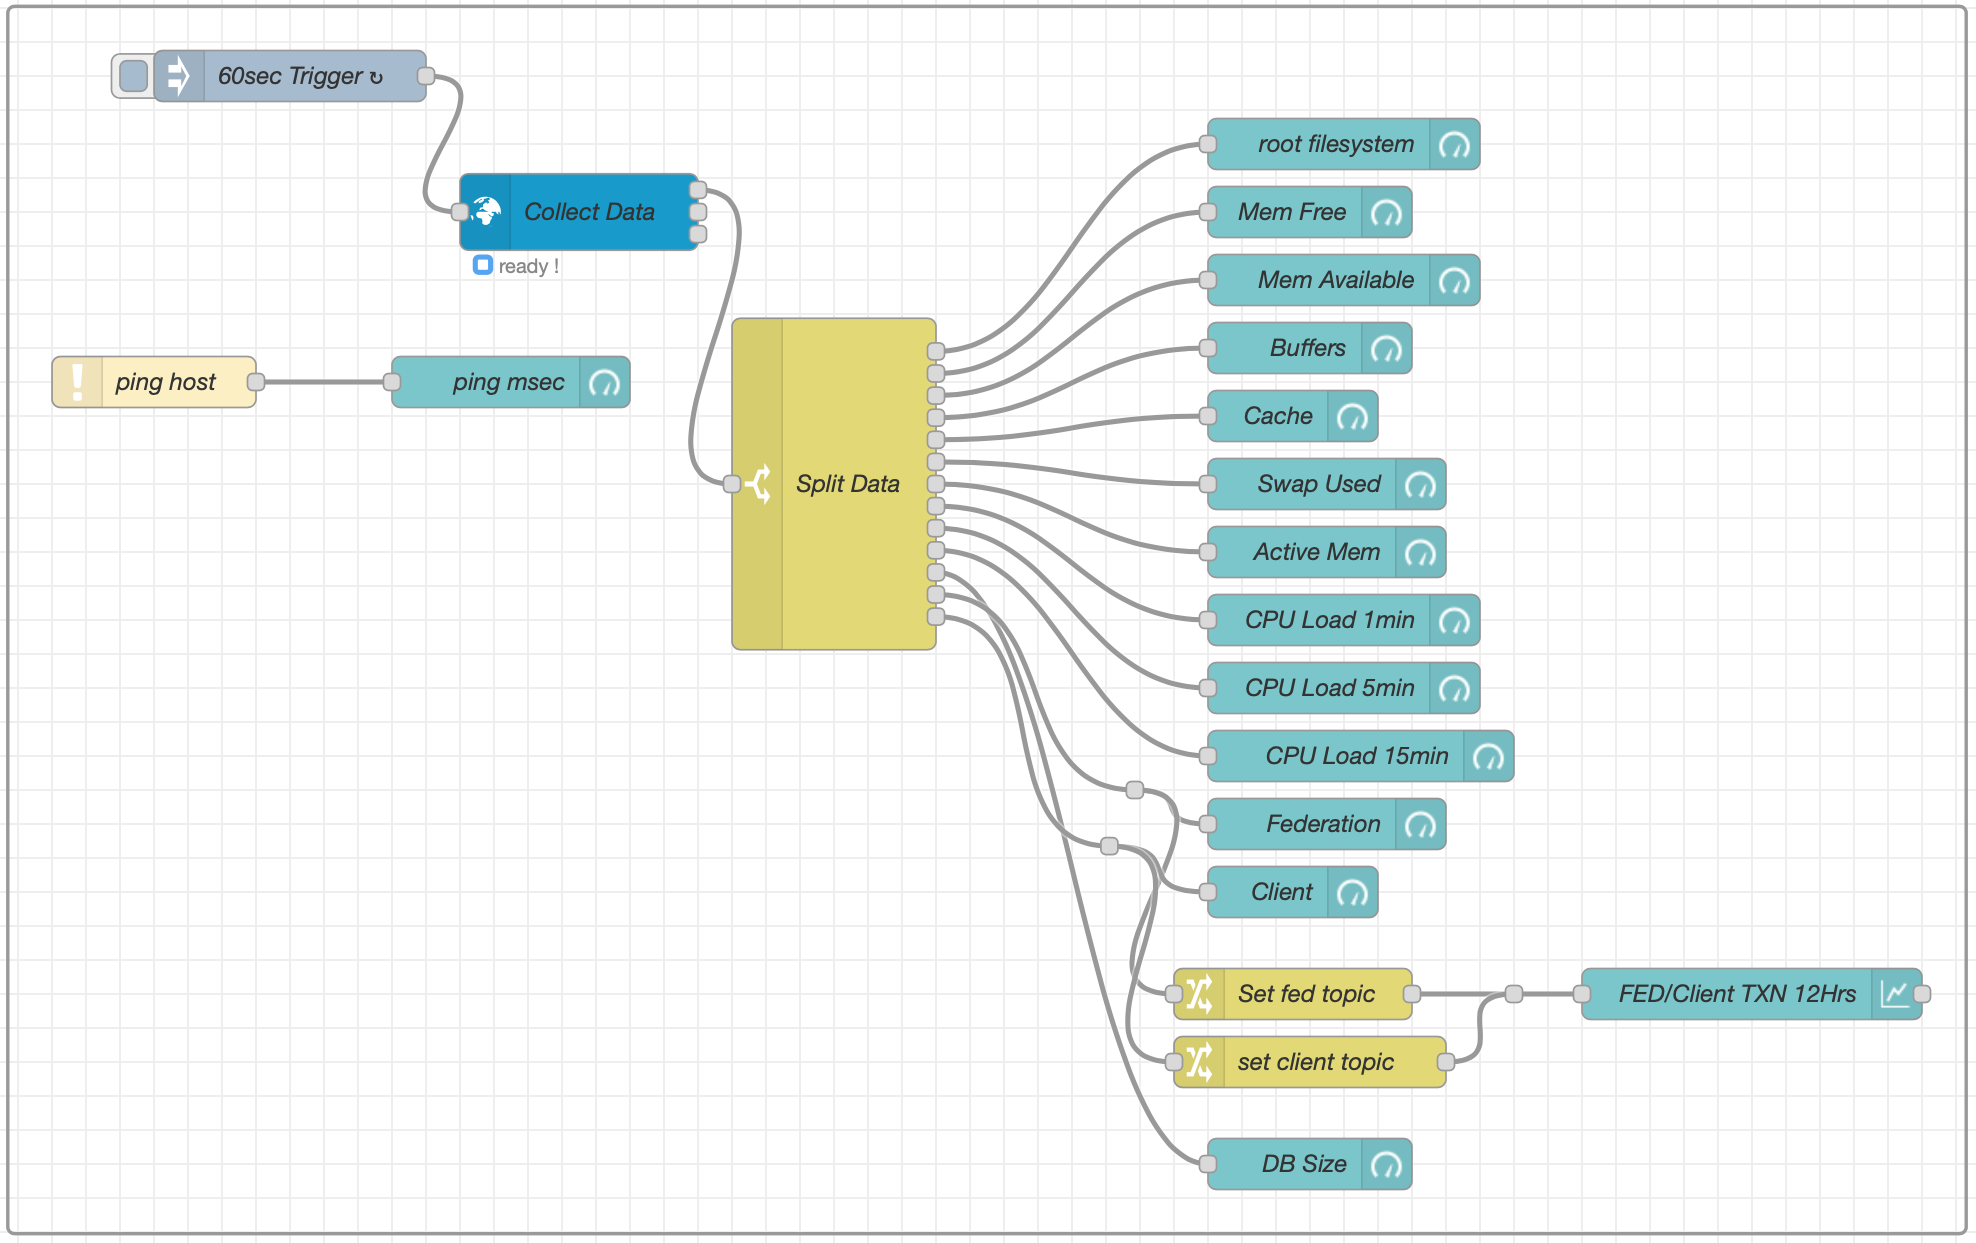
Node Red Flow to collect information from a virtual machine (VM)
This worked very well and I was soon able to generate the information I needed in a palatable format. This was a great way to get to know Node Red flow building and introduced me to using gauge and graph nodes in flows.
The resultant Node Red Dashboard for one of my Virtual Machines
Once I had mastered creating dashboards for servers/virtual machines (VMs) I then started to investigate using Node Red to plot data from WSJT-X on a map.
I currently use the PSKReporter website to see stations that I hear on a map as WSJT-X sends the data to the site automatically however, this information is always 5mins or more old. For some time I’ve been wanting to see the information realtime as it is received and so I was hoping to be able to achieve this via Node Red.
Node Red has nodes available for a multitude of applications all easily installed via the Manage Palette menu in the flow editor.
I installed the WSJT-X Decode and World-Map nodes and set about building a flow to capture the data and plot it on a world map.
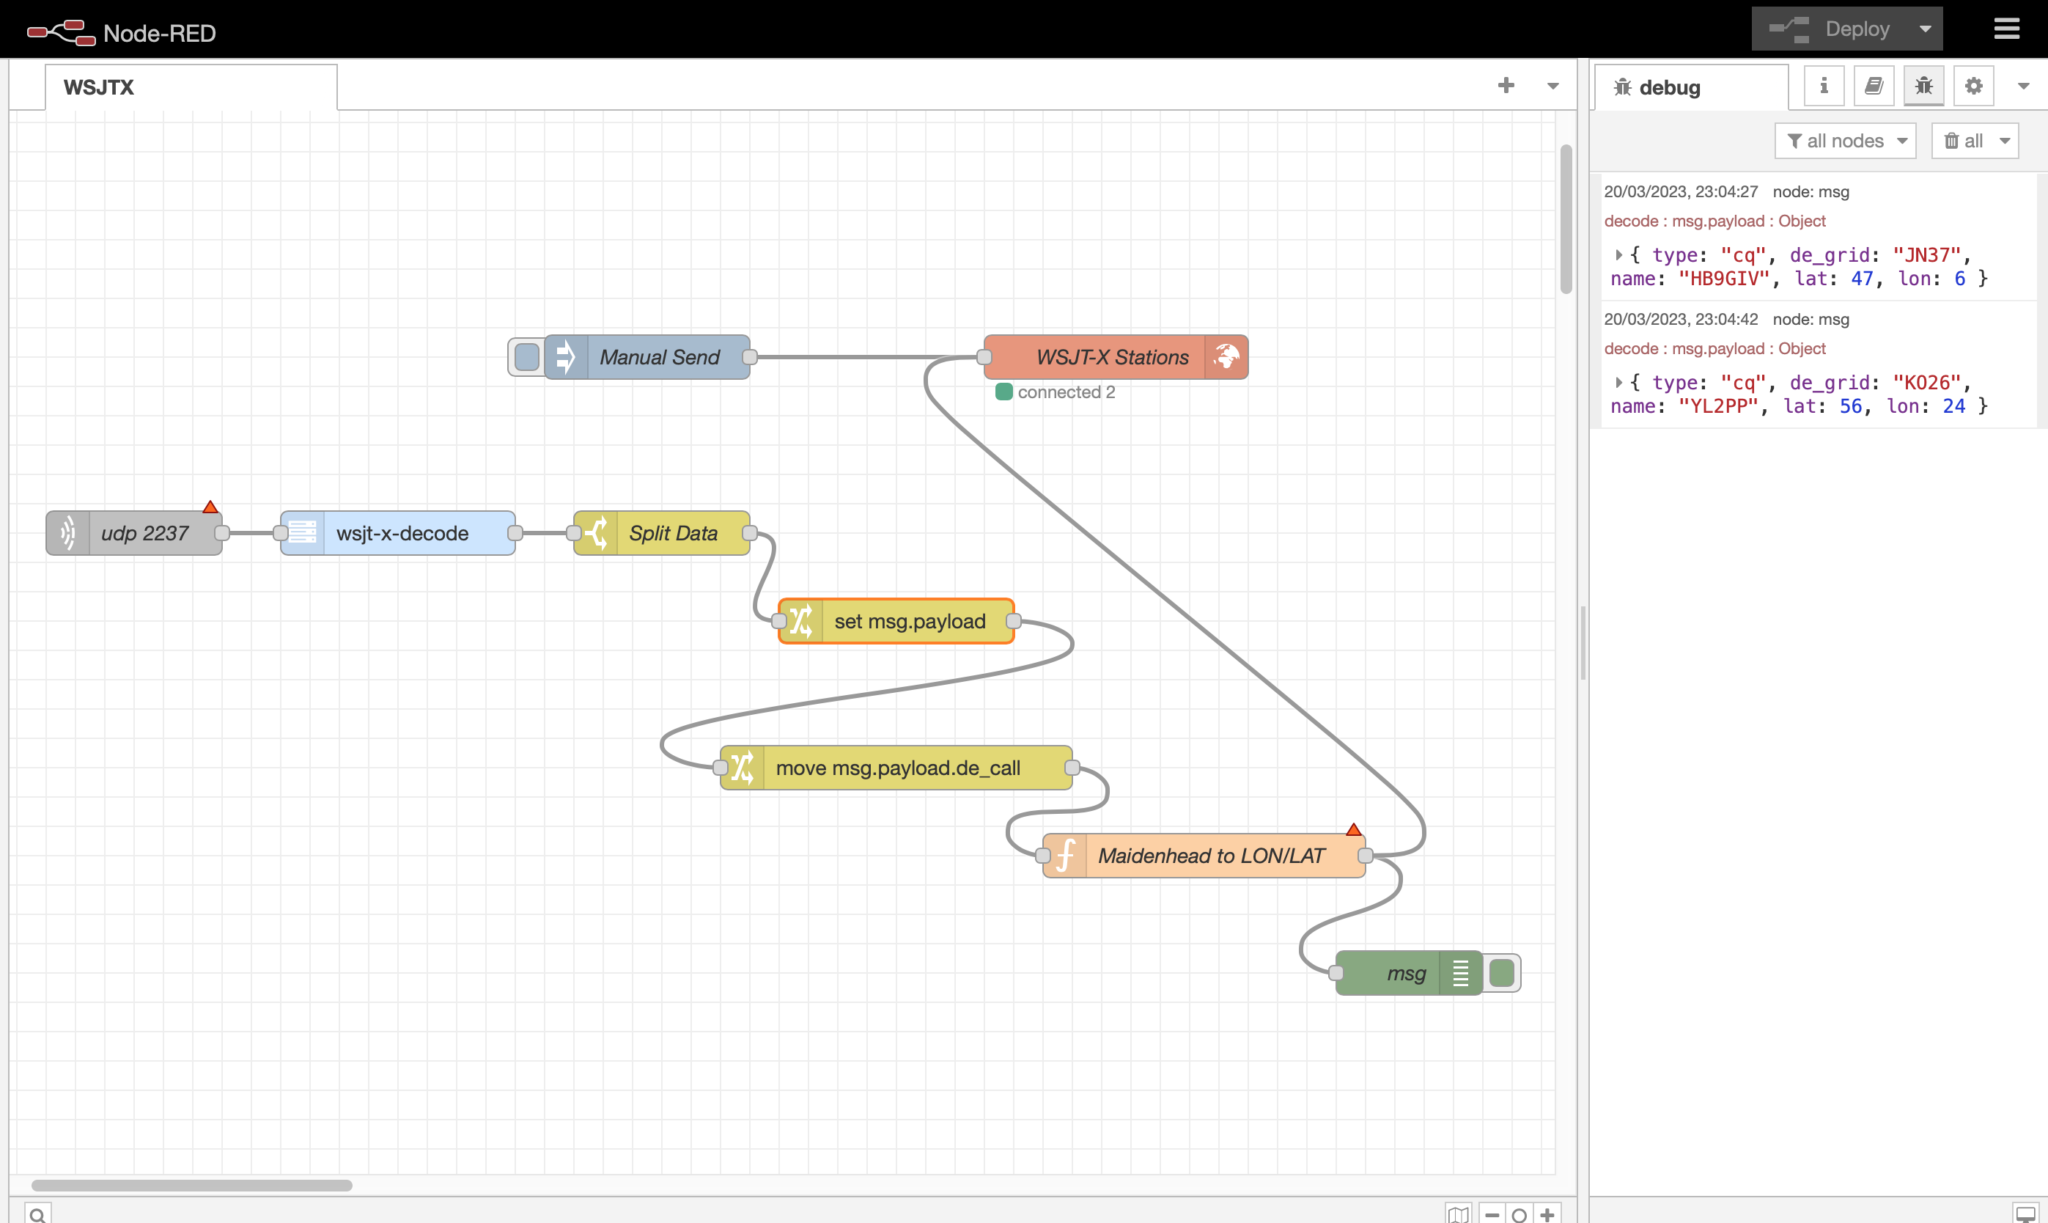
Building a Node Red Flow to decode WSJT-X data and plot it on a World Map
Putting the building blocks of the flow together is fairly straight forward and easily achieved using the excellent flow editor built into Node Red.
I configured WSJT-X to make the decode data available via UDP on port 2237 and then started the flow by creating a UDP node that connects to WSJT-X using the same port. The data immediately started flowing and I could see the information via a debug node.
I can’t stress enough how useful debug nodes are in Node Red. You can add debug nodes onto any output on any other node to capture the data as it flows. This gives you the ability to check what you’re getting is what you expected and also to see the format the data is in. The debug data is displayed in the debug panel on the right of the flow editor in realtime and gives you a great view of what is going on in your flow.
I decided to start with capturing the data for stations calling CQ as this was easily identifiable in the JSON object coming out from WSJT-X.
Passing the output from the WSJT-X-Decode node into a switch node I added a rule that filtered out data containing “type: “cq” and passed it onto the next switch node that created a payload consisting of the station callsign, maidenhead grid square and type so that it could be passed onto the next node for processing.
The next node in the flow is a function, this is where it gets a bit tricky. To be able to plot data on the map we need the Lat/Lon coordinates of the station making the CQ call. Since WSJT-X uses maidenhead locator data I needed to convert this to Lat/Lon coordinates before passing the data to the map node to be plotted.
Since Node Red is written in Java all the functions have to be written in javascript. The problem here is that I am not a javascript programmer and so this meant I’d need to learn yet another programming language. Unfortunately Node Red doesn’t allow functions to be written in C, Rust, Go or Python, all languages that I know well and after retiring from over 40 years in the UNIX/Linux/IT world my enthusiasm for learning yet another programming language has wained somewhat.
Being so close to having a working solution I pressed on and after much head scratching I finally put together some javascript that converts the maidenhead locator information in to good old fashioned Lat/Lon coordinates. I’m sure a seasoned Javascript developer wouldn’t be impressed with my code but, it works and does what I need and so I’m happy with it for the time being.
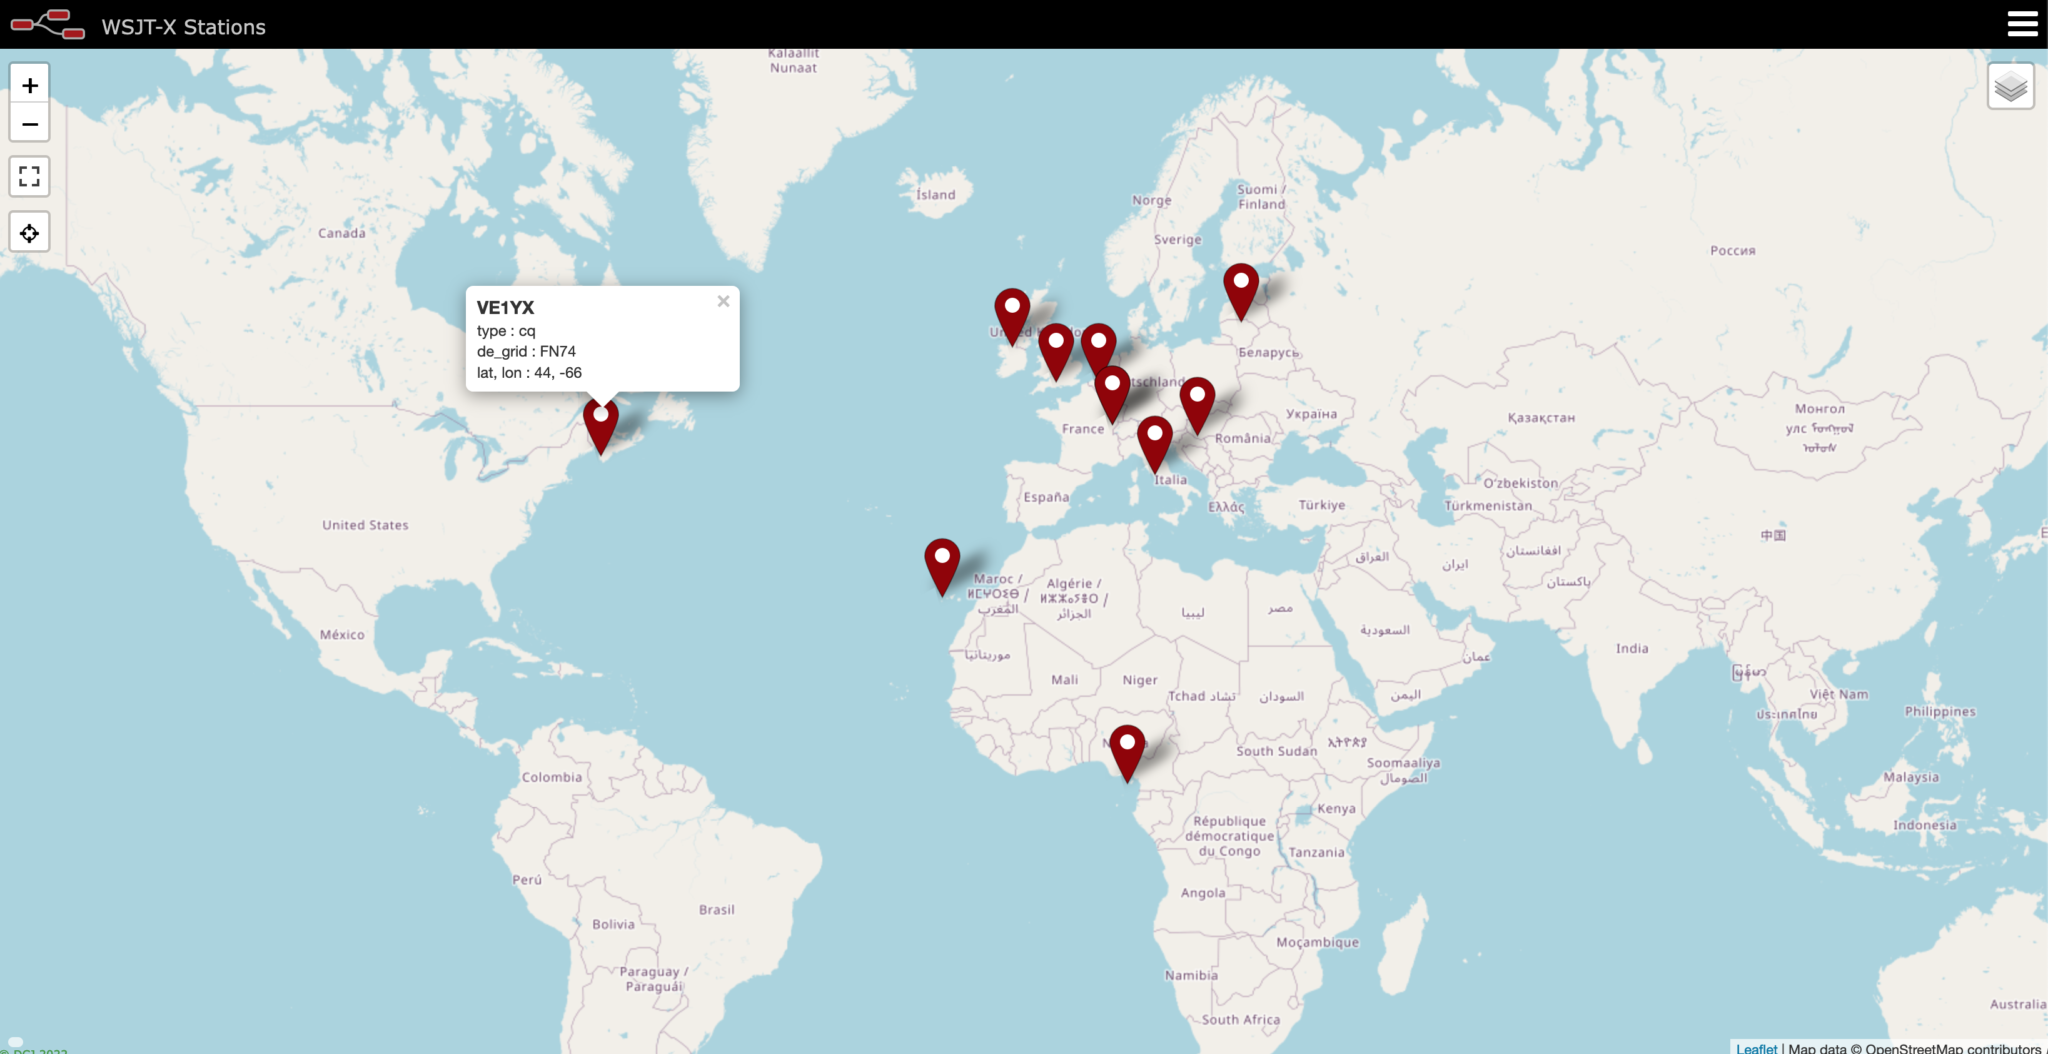
WSJT-X FT8 stations calling CQ on the 60m Band plotted on a Node Red World Map
Once I had the location information converted it was just a matter of passing the data to the world map node in the correct format for it to be plotted realtime.
As you can see on the screenshot of the map above, it worked extremely well with stations popping up as they were decoded by WSJT-X.
I now need to refine the data sent to the map so that it shows the frequency the station is calling on, the time they made the CQ call and the mode (FT8/FT4 etc) being used.. I would also like to add the distance from my QTH to the station calling CQ to round the information off however, this will mean writing another javascript function which, I’m not sure I want to dive into just yet.
I also need to add into the mix stations that aren’t calling CQ but, who’s callsign and grid square are passed on from WSJT-X. This will mean I will then be able to add to the map those stations that are actively working other stations and maybe I might even be able to show a line between the two stations that are in QSO.
This has been a fun but, steep learning curve however, it will certainly add some great functionality into my radio room and enhance my radio HAM addiction even further.
More soon …
We use cookies to ensure that we give you the best experience on our website. If you continue to use this site we will assume that you are happy with it.Ok