Building HAM Clock on an old RaspberryPi

I’ve got a couple of old RaspberryPi computers on the shelf in the shack and so decided it was time for me to put one of them to good use. The first model on the shelf is the oldest and is one of the very first RaspberryPi 1 computers that was released. (It’s the one with the yellow analog video signal output on the board!). This particular model is extremely slow but, I hang onto it just as a reminder of the first SBC in the line.

The second one is a RaspberryPi 2, a quad core machine that is only slightly faster than the first model but, it’s powerful enough to run HAM Clock.

It didn’t take long to install a vanilla Raspbian Desktop O/S and get it configured on the local LAN. I installed a few packages that I like to have available on all my Linux machines and then started on the HAM Clock install.

The first thing I needed to do was install the X11 development library that is required to compile the HAM Clock binary. To do this, open a terminal and enter the command below to install the package.

sudo apt install libx11-dev

You will need to type in your password to obtain root privileges to complete the installation process and then wait for the package to be installed.

The HAM Clock source code is available from the HAM Clock Website under the Download tab in .zip format. Once downloaded unzip the file and change directory into the ESPHamClock folder ready to compile the code.

cd ~/Downloads/ESPHamClock

Once in the ESPHamClock directory you can run a command to get details on how to compile the source code.

make help

This will check your system to see what screen resolutions are available and then list out the options available to you for compiling the code as shown below.

The following targets are available (as appropriate for your system)

    hamclock-800x480          X11 GUI desktop version, AKA hamclock
    hamclock-1600x960         X11 GUI desktop version, larger, AKA hamclock-big
    hamclock-2400x1440        X11 GUI desktop version, larger yet
    hamclock-3200x1920        X11 GUI desktop version, huge

    hamclock-web-800x480      web server only (no display)
    hamclock-web-1600x960     web server only (no display), larger
    hamclock-web-2400x1440    web server only (no display), larger yet
    hamclock-web-3200x1920    web server only (no display), huge

    hamclock-fb0-800x480      RPi stand-alone /dev/fb0, AKA hamclock-fb0-small
    hamclock-fb0-1600x960     RPi stand-alone /dev/fb0, larger, AKA hamclock-fb0
    hamclock-fb0-2400x1440    RPi stand-alone /dev/fb0, larger yet
    hamclock-fb0-3200x1920    RPi stand-alone /dev/fb0, huge

For my system 1600×960 was the best option and so I compiled the code using the command as follows.

make hamclock-1600x960

It’s no surprise that it takes a while to compile the code on such a low powered device. I can’t tell you how long exactly as I went and made a brew and did a few other things whilst it was running but, it took a while!

Once the compilation was complete you then need to install the application to your desktop environment and move the binary to the correct directory.

make install

Once the install is complete there should be an icon on the GUI desktop to start the app. If like mine it didn’t create the icon then you can start the HAM Clock by using the following command in the terminal.

/usr/local/bin/hamclock &

The first time you start the app you’ll need to enter your station information, callsign, location etc and then select the settings you want to use. There are 4 pages of options for configuring the app all of which are described in the user documentation.

M0AWS - HAM Clock running on RaspberryPi Computer
M0AWS – HAM Clock running on RaspberryPi Computer

Once the configuration is complete the map will populate with the default panels and data. I tailored my panels to show the items of interest to me namely, POTA, SOTA, International Beacon Project and the ISS space station track. I was hoping to be able to display more than one satellite at a time on the map however, the interface only allows for one bird to be tracked at a time.

You can access the HAM Clock from another computer using a web browser pointed at your RaspberryPi on your local LAN using either the IP address or the hostname of the device.

http://<hostname>:8081/live.html

or

http://<ip-address>:8081/live.html

You can also control the HAM Clock remotely via web browser using a set of web commands that are detailed on port 8080 of the device.

http://<hostname or ip-address>:8080/

M0AWS - HAM Clock remote command set
M0AWS – HAM Clock remote command set

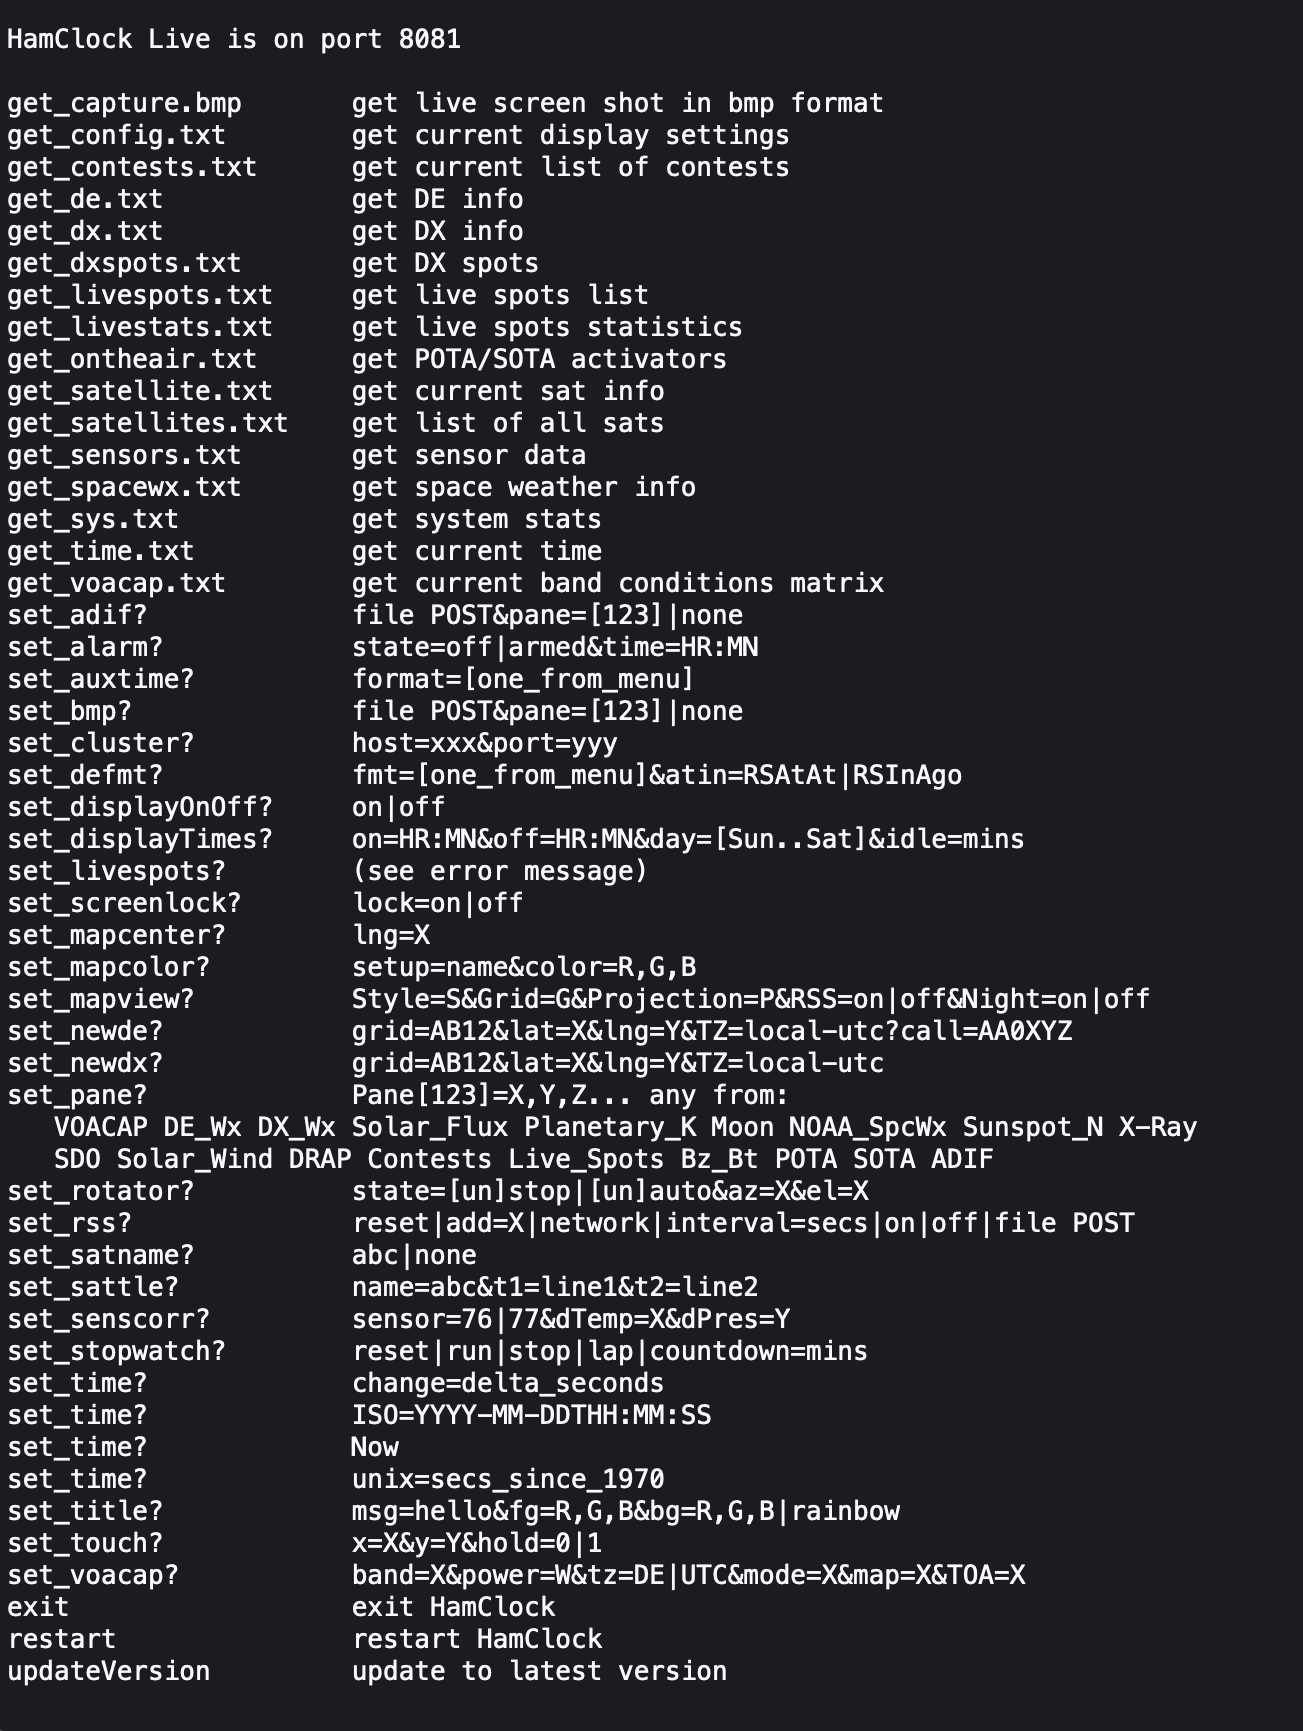
This is a great addition to any HAM shack especially if, like me you have an old HDTV on the wall of the shack that is crying out to display something useful.

More soon …

UPDATE: QO-100 Node Red Dashboard

I’ve been making a few improvements to my QO-100 Node Red Dashboard whilst waiting for the 2.4Ghz hardware to arrive. I’ve added the ability to split the RX and TX VFOs so that I can tune away from the TX frequency for working split stations or for tuning to slightly off frequency stations. I also added a series of tuning buttons to the top of the GQRX side of the dashboard to enable easy tuning using the trackball connected to my Kubuntu PC. This worked well but, I really missed having a real VFO knob like a conventional radio.

As I had a Griffin Powewrmate USB VFO from a previous SDR radio I added it to the flow as well so that I had a physical VFO knob for the SDR receiver. Details on how I got it working using evtest and a simple BASH script are in the Griffin Powermate article.

M0AWS QO-100 Node Red Dashboard Flow

The Node Red flow is looking a little busier with the addition of split mode and the Griffin Powermate USB VFO which has really enhanced the useability of the solution. It’s very impressive what can be achieved with Node Red with a little imagination. You really don’t need to be a heavy weight programmer to make things work.

M0AWS QO-100 Node Red Dashboard as of 07/06/23

I also put together some code to calculate the S Meter reading from the dBFS data the GQRX SDR software generates. It’s not 100% accurate but, it’s close enough to be useful.

On the IC-705 side of the Dashboard I also now display the 2.4Ghz uplink frequency so that it’s available for logging.

So with the QO-100 Dashboard ready to go live I have now started putting together the 2.4Ghz transmit path of the ground station. I have the 2.4Ghz transverter and matching 12w amplifier from DXPatrol, the IceCone Helix 2.4Ghz antenna from Nolle Engineering, some LMR-400-UF and connectors from Barenco and an appropriate water proof enclosure from Screwfix to fit all the kit into however, I’m now being held up by one simple little SMA male to SMA male connector that I need to connect the transverter and amp together.

The SMA connector has been ordered but, is taking a month of Sundays to arrive! Hopefully it’ll arrive soon and I’ll finally get on the QO-100 satellite and start enjoying the fun.

More soon …

QO-100 TX/RX Dashboard

I’ve now completed the GQRX Receive and Icom IC-705 Transmit dashboard in Node Red. It was a fun project to put together and needed some javascript coding to get the functionality I wanted but, I got there in the end.

M0AWS QO-100 GQRX/IC-705 control dashboard

The dashboard looks fairly simple but, there is a lot behind the scenes to get it to this stage.

On the left is the Icom IC-705 transmit control panel. It shows the transmit frequency, power output and SWR reading. The SWR is so that I can check that the input into the 2.4Ghz transverter doesn’t have any connectivity issues. The “S0” will actually display the S Meter reading when the IC-705 is being used as a normal transceiver rather than being in QO-100 Duplex mode as shown above where the GQRX app and Funcube Dongle SDR are being used as the receiver.

The GQRX side of the dashboard shows the downlink frequency which tracks the uplink frequency of the VFO on the IC-705. This will ensure that the Funcube Dongle Pro+ SDR receiver will always be on the correct downlink frequency relative to the uplink frequency, thus I should always be able to hear my own signal coming from the QO-100 satellite.

Once taken out of QO-100 mode the two radios can be used independently on any of the HAM bands and can be switched using the buttons on the dashboard.

I also coded in a simple memory facility where a frequency can be stored in Node Red and recalled later on both the transmit and receive sides.

Looking at the dashboard it all looks simple and straight forward however, if you look at the Node Red flow it becomes obvious that this isn’t the case.

QO-100 Dashboard Flow in the Node Red Editor (Click for larger image)

There’s a lot to the flow to get the information from the receiver and transmitter so that it can be presented on the dashboard. There’s also some code to convert between Rigctl protocol used by the GQRX application and XMLRPC used by the IC-705 via FLRig and WFview. I had to also code around a bug in the Node Red XMLRPC node whereby you have to add 0.1 onto the VFO frequency for it to be passed onto the radio otherwise the information is never sent. This was a real pain of a bug to find but, with a little experimentation I found the problem and managed to code around it. The strange thing about this is that the 0.1 added onto the frequency isn’t actually passed onto the radio via the XMLRPC node, it just has to have that on input otherwise it doesn’t work at all. A very strange bug and hopefully one that will be fixed by the node developer in future releases.

All that is left to do now is add the temperature sensors dashboard to complete the dashboard. These haven’t arrived yet and so I’ve not been able to create the necessary flow to collect the data from them.

Hopefully this coming week the weather will improve and I’ll start getting the dish antenna up and the get the receive side working.

UPDATE: Further development of my QO-100 Dashboard has taken place, you can read all about it here.

More soon …

Realtime WSJT-X Decode Map v2

Following on from my initial article on plotting realtime WSJT-X decodes on a Node Red map I’ve made a few enhancements to the flow so that it includes even more data then before.

The additions to the flow now enables collection of status information from WSJT-X so that the flow is able to capture the frequency that the radio is tuned to and also the mode that WSJT-X set to. Neither of these two bits of data are in the decode message payload and so a separate mini-flow has to be created to collect the data from the status payload along side the other main flow.

Node Red flow showing additional sub flow in the top left corner of the flow editor screen

Since the status information needs to be available to all other flows I used flow variables to store the status information in so that it can be addressed directly from any of the other flows in the Node Red app.

If you’d like to use the flow in your radio room then I have put a download link below for a file that you can import into Node Red and build the flow in an instant.

More soon …

Convert your RUMLogng radio logs to HTML

I’ve started using RUMLogng for logging on my MacBook Pro as it seems to be the most common logbook to use on the Apple Mac platform. I must admit that I’m not sure if I’ll carry on using it going forward as I’m not overly enamoured by it but, for the time being it’s all I have.

To get my logs on the blog I’ve written a small BASH shell script that reads the exported ADIF file from RUMLogng and creates a log in HTML format for each different mode.

You can see the output of the BASH script by selecting a log from the Logs menu at the top of this page.

If you want to be able to add your log to your own website then I’ve made the script available for download below.

Currently I’ve only tested the script with the few different modes that I have log entries for but, it should work for all modes. If you find any issues please contact me with all the details and I’ll look into resolving any problems.

As always, if you use my code to generate webpages on your website please consider leaving the footer in place so I get some credit, thanks!

adi2html v0.5 release

Following on from my original article where I detailed the adi2html Bash script that reads in the WSJT-X log and creates an HTML version of the data so that it can be presented in a palatable format on websites (See my WSJT-X log here), I’ve now released v0.5 for public consumption.

In adi2html v0.5 I’ve added colour to the webpage that is generated to make it easier on the eyes and rewritten the function process_log() so that it uses the column name to identify each field instead of the row position.

By making this change it should cope just fine if the order of the fields is ever altered in the WSJT-X log during its development.

As before the code can be downloaded using the link below.

If you use my code please consider leaving the footer in place so I get some credit, thanks!

Create HTML webpage from wsjtx_log.adi file

I had some spare time today so I finished a small BASH program that I started writing yesterday that reads the wsjtx_log.adi file and writes the data out in HTML format so that it can be incorporated into my website (See the Logs Menu).

(Sorry the font is so small but WordPress is crap at displaying code!)

It’s a fairly simple piece of code that anyone who is into Linux and has a basic understanding of the BASH shell will easily be able to comprehend. (Yes there’s a little awk and sed in it just to add to the entertainment value!).

There are a few places where the code can be improved which I’ll address in v0.3 when I have time but, for now I’ll put it online just incase anyone is interested in using it.

If you do use the code please consider leaving the footer in place so I get some credit.

More soon …