I’ve recently built a new AllStarLink (ASL) node for my MB7IBW gateway that I have recently brought up on air on the 2m band.
AllStarLink 3 has a lot of changes in it when compared to the previous version and this of course impacts my Node-Red Control Dashboard that I’ve been using to manage my first ASL node for well over a year now.
To build the node I used the RaspberryPi imager and added the AllStarlink 3 image as detailed on the allstarlink.org website.
Installing the system this way makes it pretty easy compared to previous installs but, it comes with some quirks which cause issues with Node-Red.
From the outset the plan has always been to have AllStartLink 3 and Node-Red running on the same Pi4 to keep it totally self contained. This was easy enough to achieve and works without issue.
Node-Red Control Dashboard for AllStarLink 3
Installing Node-Red onto a Pi4 is really easy and is fully documented on the Node-Red Website.
Once the AllStarLink 3 operating system was installed on my SD card, booted and operational I installed Node-Red. I soon realised that there were a few things I had to do before loading the Node-Red flow.
AllStarLink 3 no longer logs connect and disconnect messages in the connectlog like it did in AllStarLink 2. To get logging working again I had to create two new BASH scripts as detailed below and put them into /etc/asterisk/myscripts.
For the connect information I created the BASH script as detailed below.
Next I disabled the temporary filesystems that are used by default for the apache and asterisk logging as it’s useful to keep the apache logs for debugging and I needed the asterisk logs for the Node-Red dashboard.
Disabling the temporary file system is very easy to do, just edit the /etc/fstab and comment out the two lines as shown below.
# Comment out the next line for persistent Apache logs
#tmpfs  /var/log/apache2        tmpfs   defaults,noatime,nosuid,nodev,noexec,mode=0775,size=32M 0 0

# Comment out the next line for persistent Asterisk logs
#tmpfs  /var/log/asterisk       tmpfs   defaults,noatime,nosuid,nodev,noexec,mode=0775,size=32M,uid=102,gid=106 0 0

# Note: These lines are wrapped, should be on 1 line in the /etc/fstab
Once the entries in the /etc/fstab were commented out I rebooted the Pi4 to get persistent filesystems.
The final thing that had to be done was to allow user repeater to use sudo without a password so that it could be used to perform reboot/shutdown/process restart as user root from within the dashboard.
# /etc/sudoers

# Allow repeater sudo without password
repeater ALL=(ALL) NOPASSWD: ALL
Once this was all done I imported the Node-Red flow, configured the SSH nodes with login credentials for the Pi4 (important to use the user repeater for SSH), clicked deploy and the dashboard was ready for use.
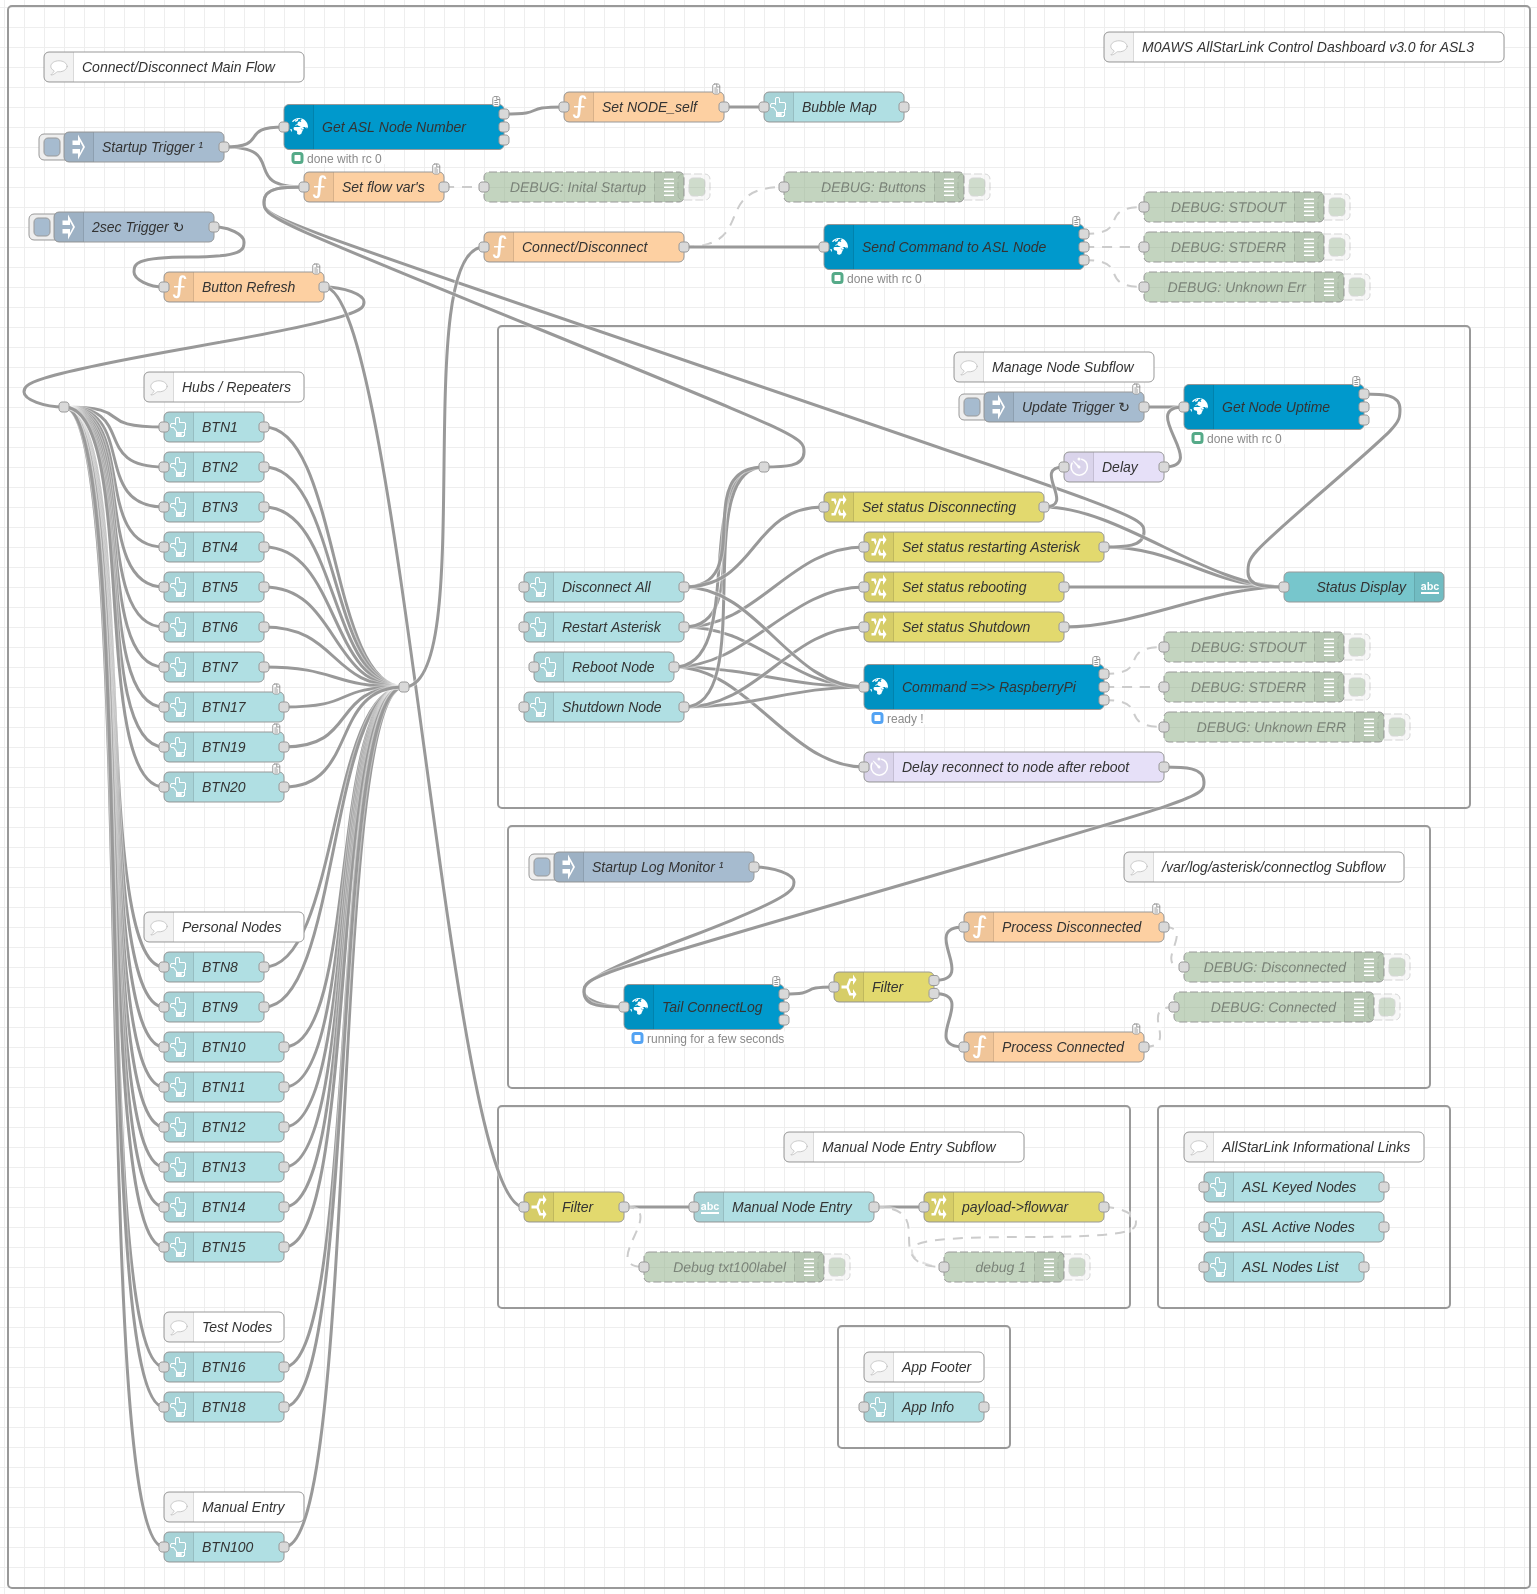
Node Red AllStarLink3 Control Dashboard Flow
I’ve been using the dashboard for a few weeks now and it’s running perfectly, without error.
If you want to build your own Node-Red Control Dashboard for your AllStarLink 3 node then, just download the flow using the button below and import it into your flow editor.
I’ve spent some time this afternoon modifying my Node-Red Dashboard for controlling AllStarLink nodes to work with the new AllStarLink version 3.
My original AllStarLink Control Dashboard was designed to work with AllStarLink 2 which I have running on an old RaspberryPi 3b on the 70cm band. The dashboard has worked reliably ever since deployment and is in use daily.
With the release of AllStarLink 3 and all the changes that it entails I’ve had to make a few changes to the dashboard flows in order to make it compatible with AllStarLink 3 nodes.
This entails not only flow changes but also the addition of two new bash scripts that are called by Asterisk to log connect and disconnect messages as they are not logged by default any more. (Seems a bit of a step backwards)
Node-Red AllStarLink Control Dashboard v3.0 for ASL3
The changes also entail disabling the temporary filesystems used by default in the new ASL3 build so that log files etc become persistent.
I’ll spend some time using the new dashboard to ensure it’s working correctly and then will release it into the wild for all those that are brave enough to move over to AllStarLink 3.
Following on from my previous article on using Node-Red to build interactive log maps I’ve now reworked the flow to make it more efficient with less Javascript.
The original flow had a function that handled the issue of FT4 contacts being recorded in two different ways depending on which app you use for your FT4/8 operations.
<mode:4>MFSK <submode:3>FT4
or
<mode:8>MFSK FT4
The code I wrote to handle this wasn’t particularly elegant and so I decided to remove the code entirely and just use a simple change node.
M0AWS New node to handle FT4 more efficiently
This is the great thing about Node-Red, there’s always more than one way to do something.
With this fix in place and the old code stripped out of the format generic payload function, the new flow is much tidier and easier to comprehend.
M0AWs Updated ADI Log Map flow
With testing complete and the two maps now live on my website the flow is finally ready for release into the wild.
If you fancy presenting your ADIF logs in a more visual, interactive format then just download the flow below and import it into your Node-Red flow editor.
Don’t forget that you will need to change the path to the log files in the file read nodes to suit your setup and change the location data in the My QTH trigger to match your callsign and location. Other than this the flow should just work.
I’ve not been on the radio much over the last few weeks as I’ve had my head down other radio related rabbit holes.
One of the rabbit holes is a Node-Red project to make my online logs a little more interactive. For sometime now my logs have been displayed on my website as nicely formatted, searchable HTML pages however, they don’t really allow the viewer (myself included) to see the global coverage of all the contacts so, I decided to write a Node-Red flow that would do just that.
M0AWS Interactive Log Flow
The flow itself isn’t too complicated and basically consists of reading in the individual ADIF formatted log files, processing the data and then sending the data in the correct format to the map node for display.
I’ve had to write a few functions to handle the processing of the ADIF formatted data but, these aren’t particularly complex and are fairly easy to understand even if like me, you’re not a Javascript programmer.
The flow is working perfectly however, I’m in the process of reworking the format generic payload function to reduce the amount of code and make it more efficient.
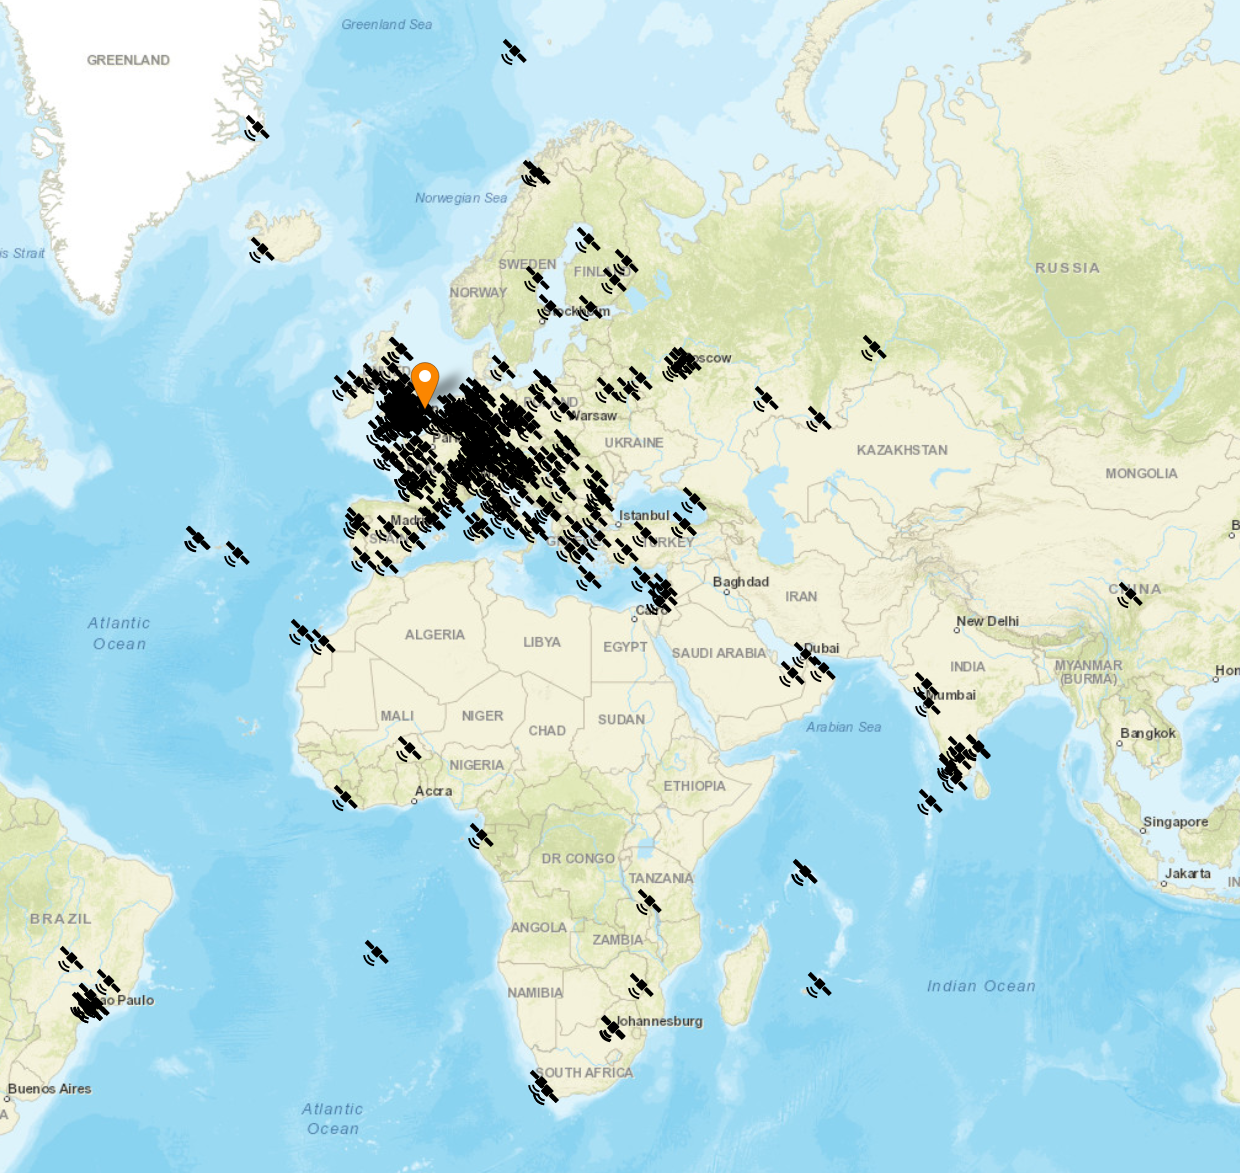
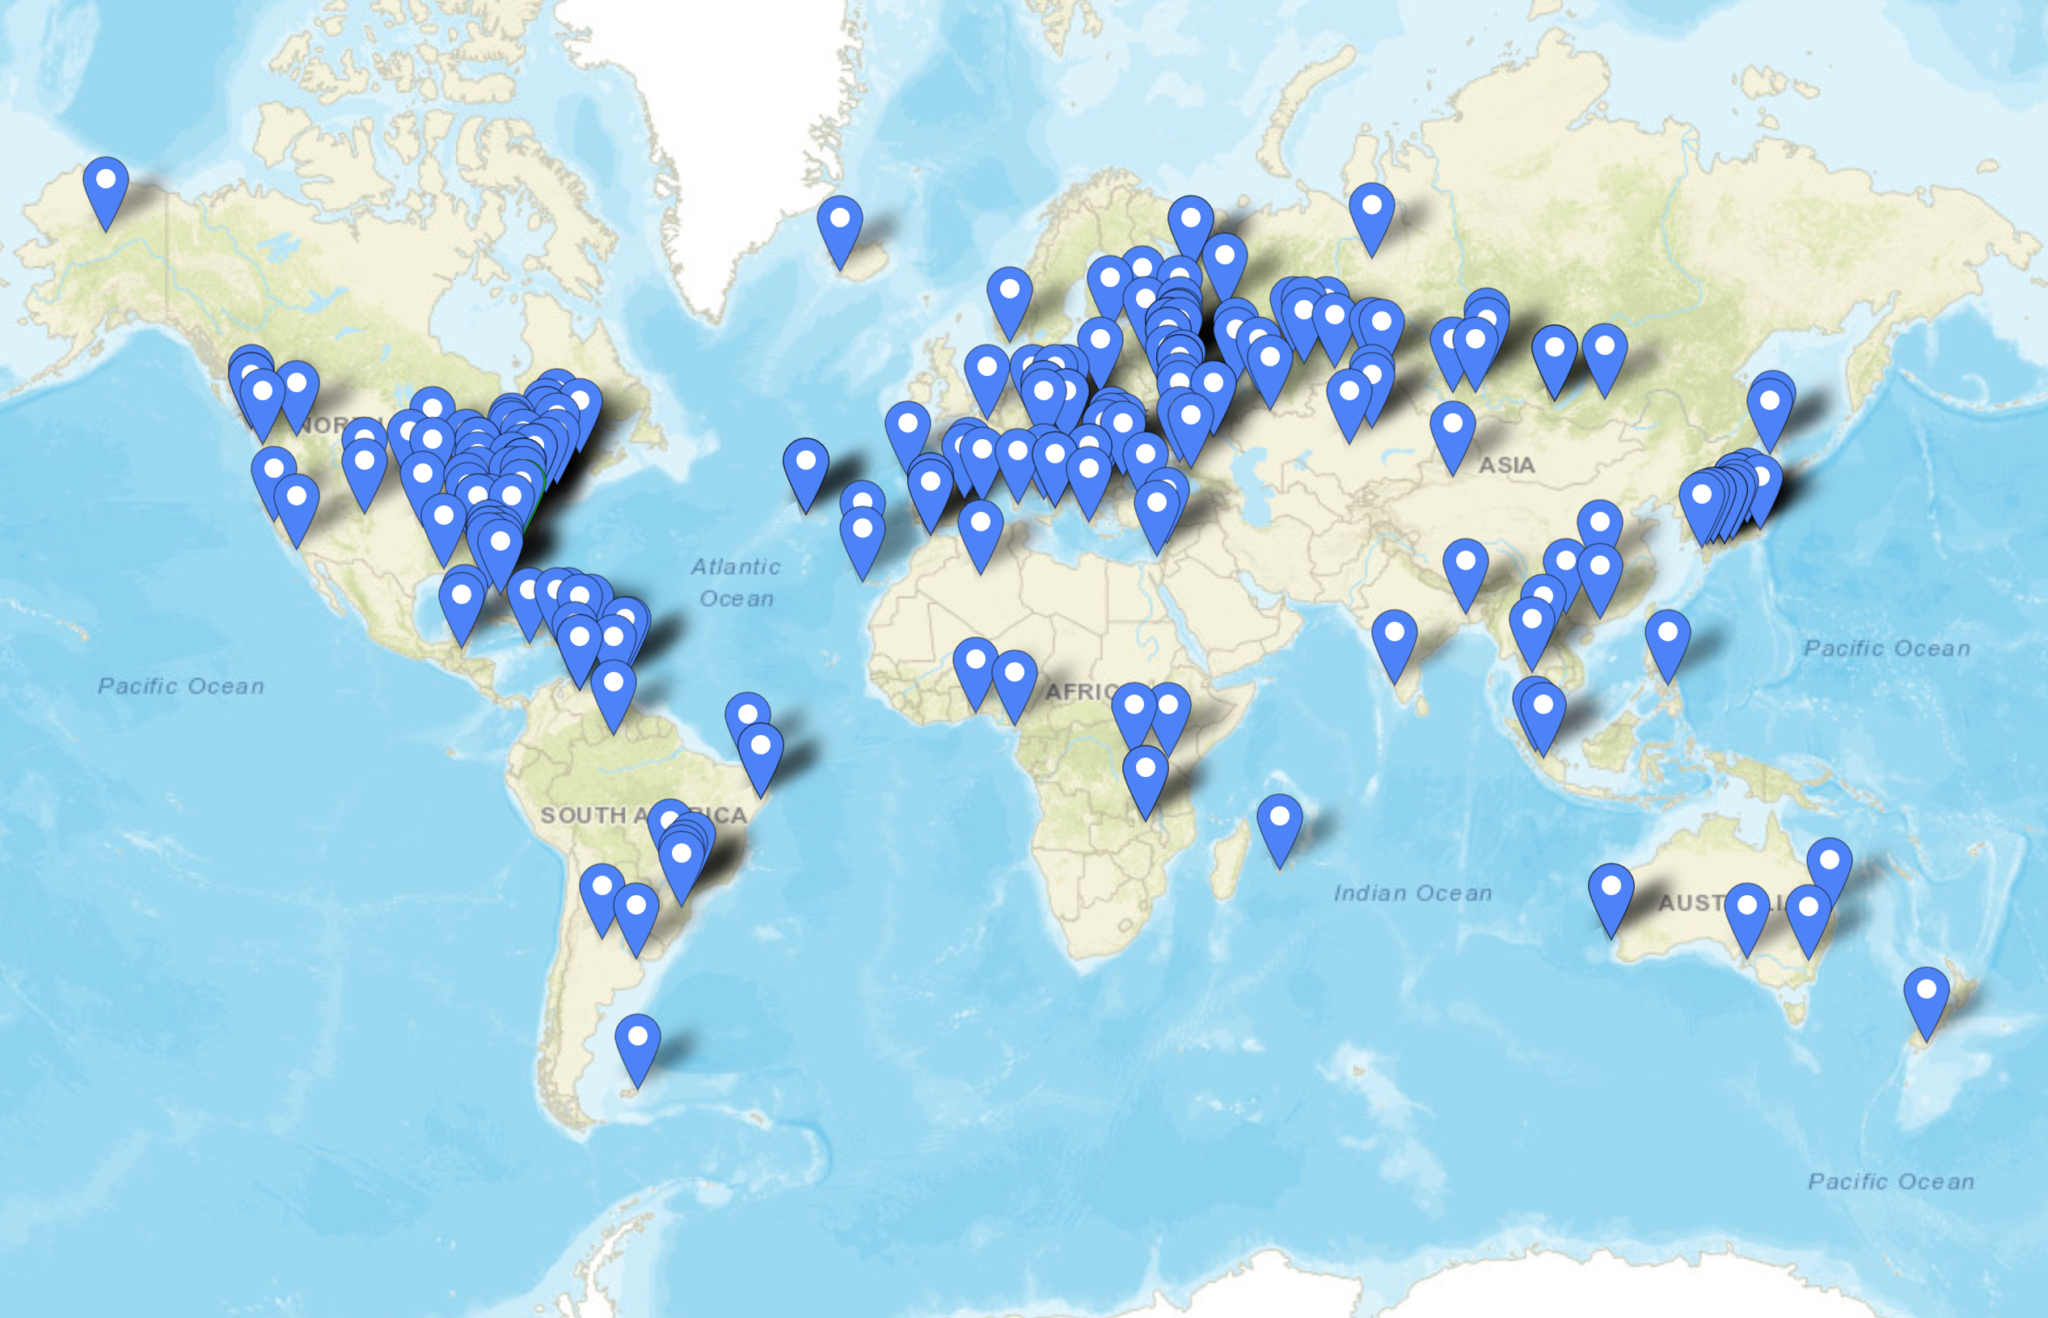
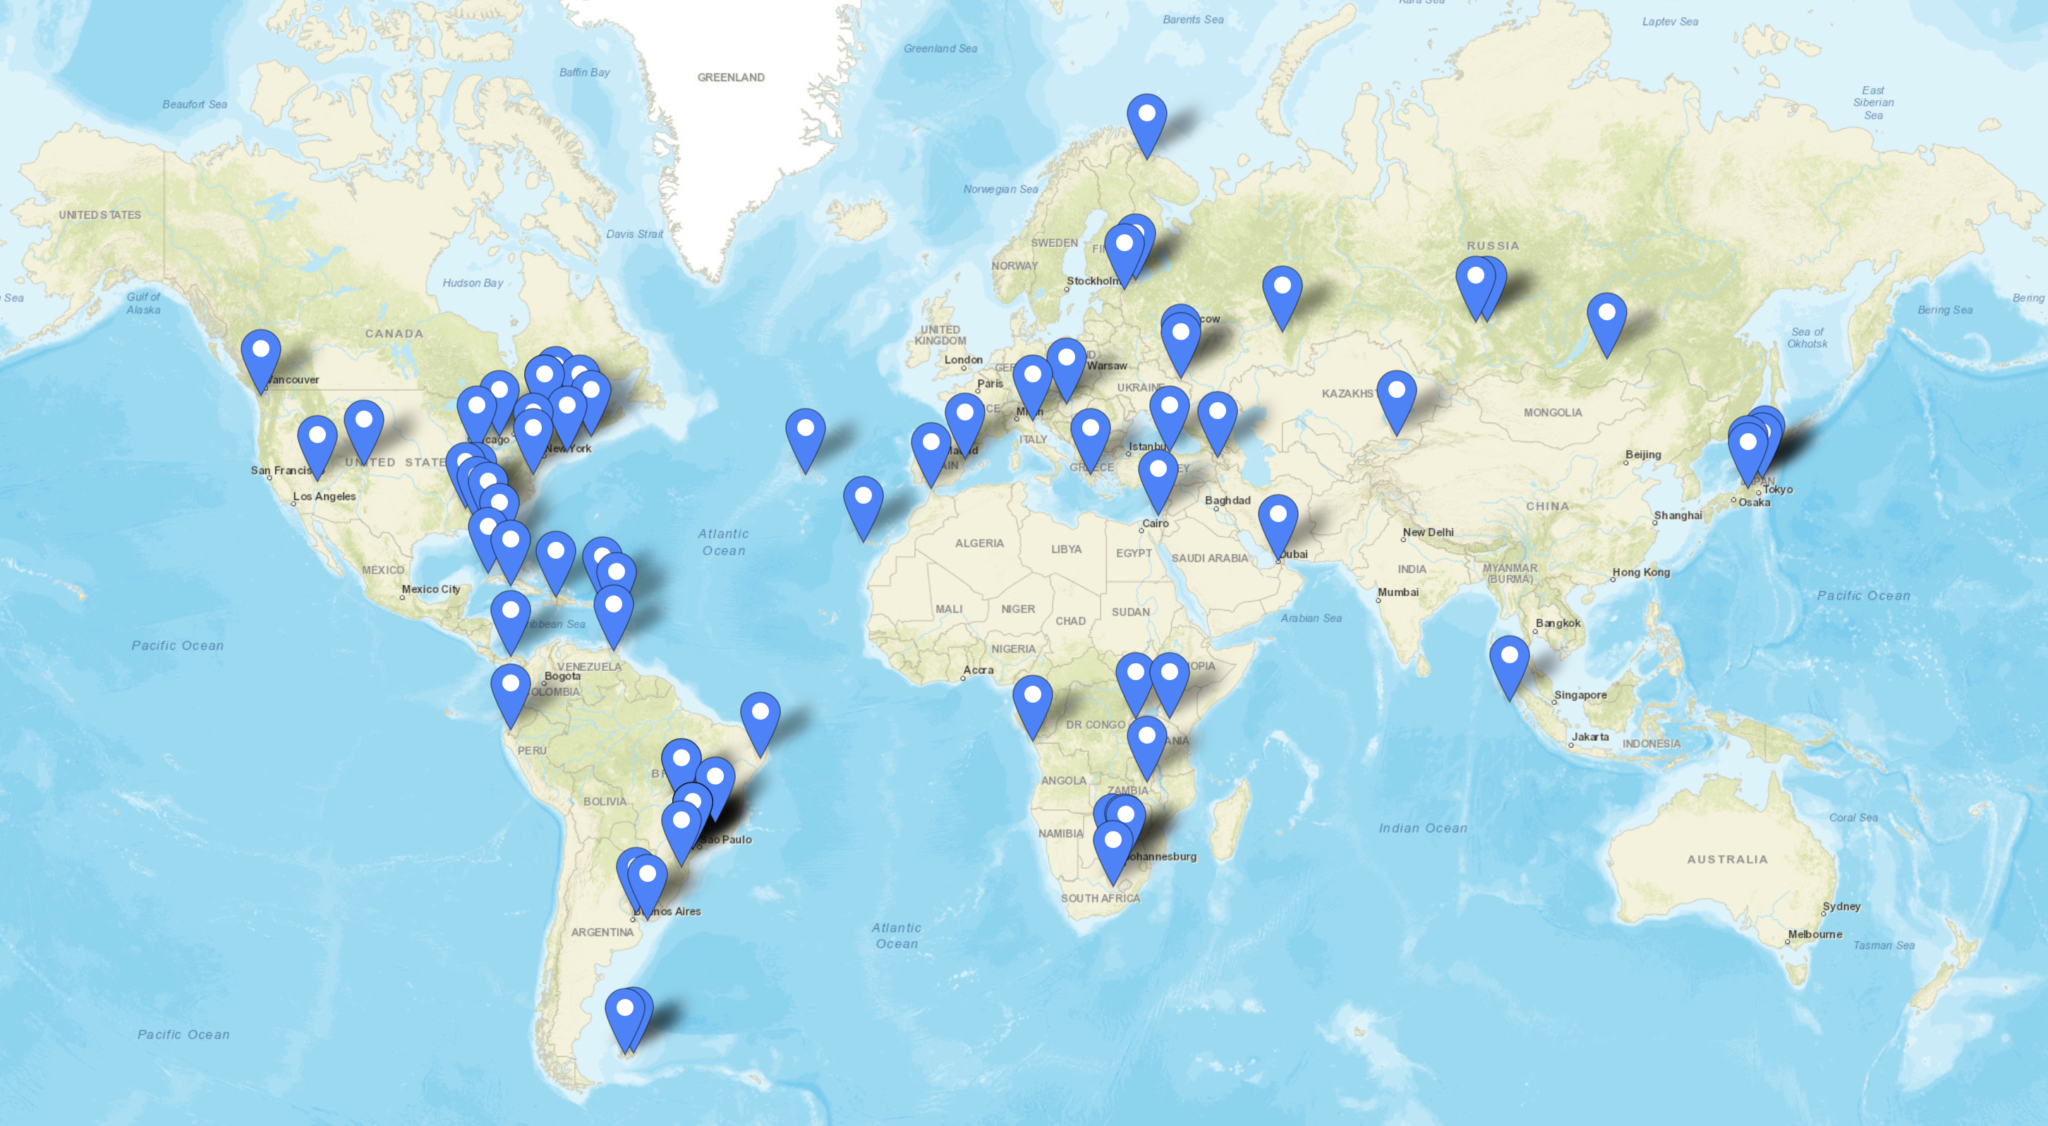
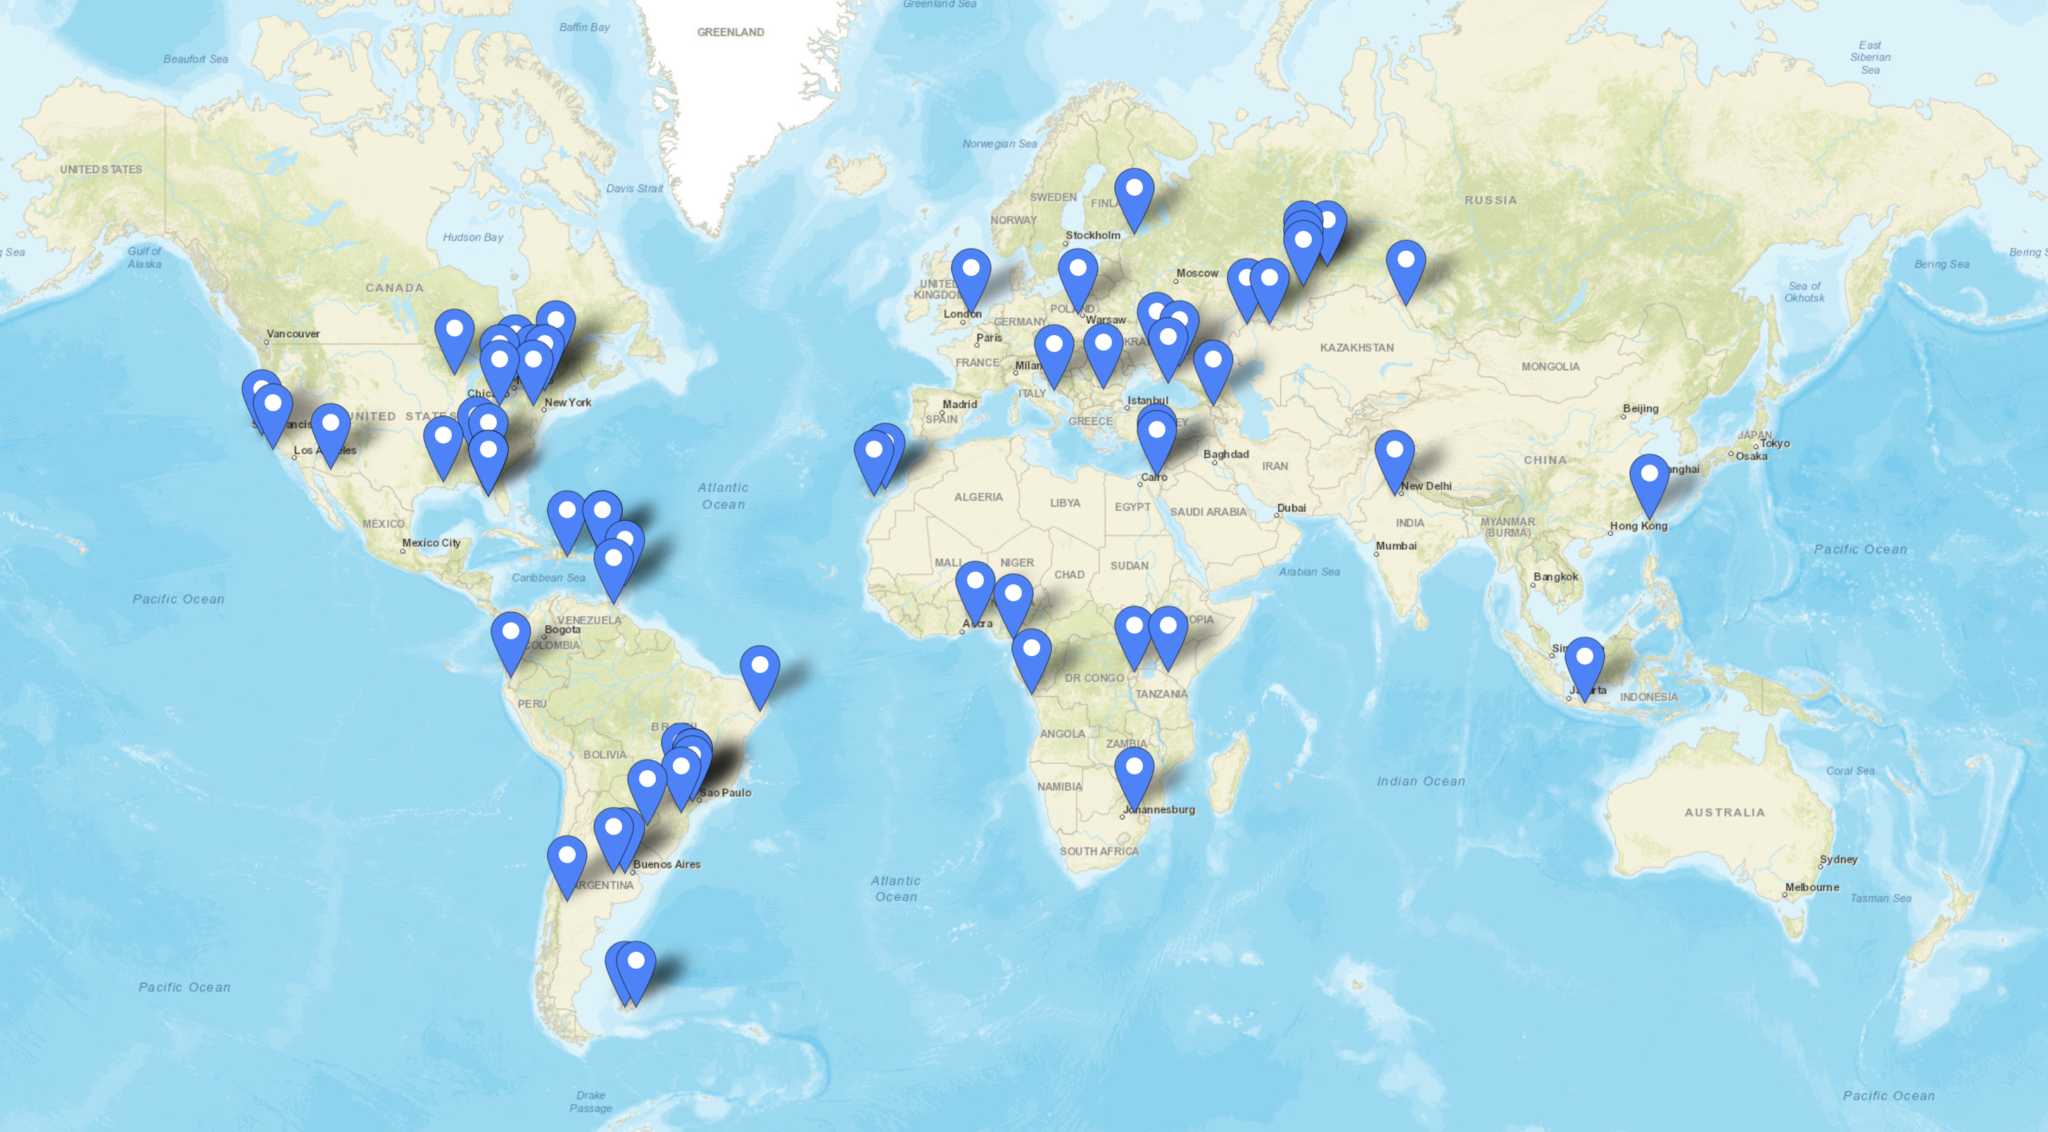
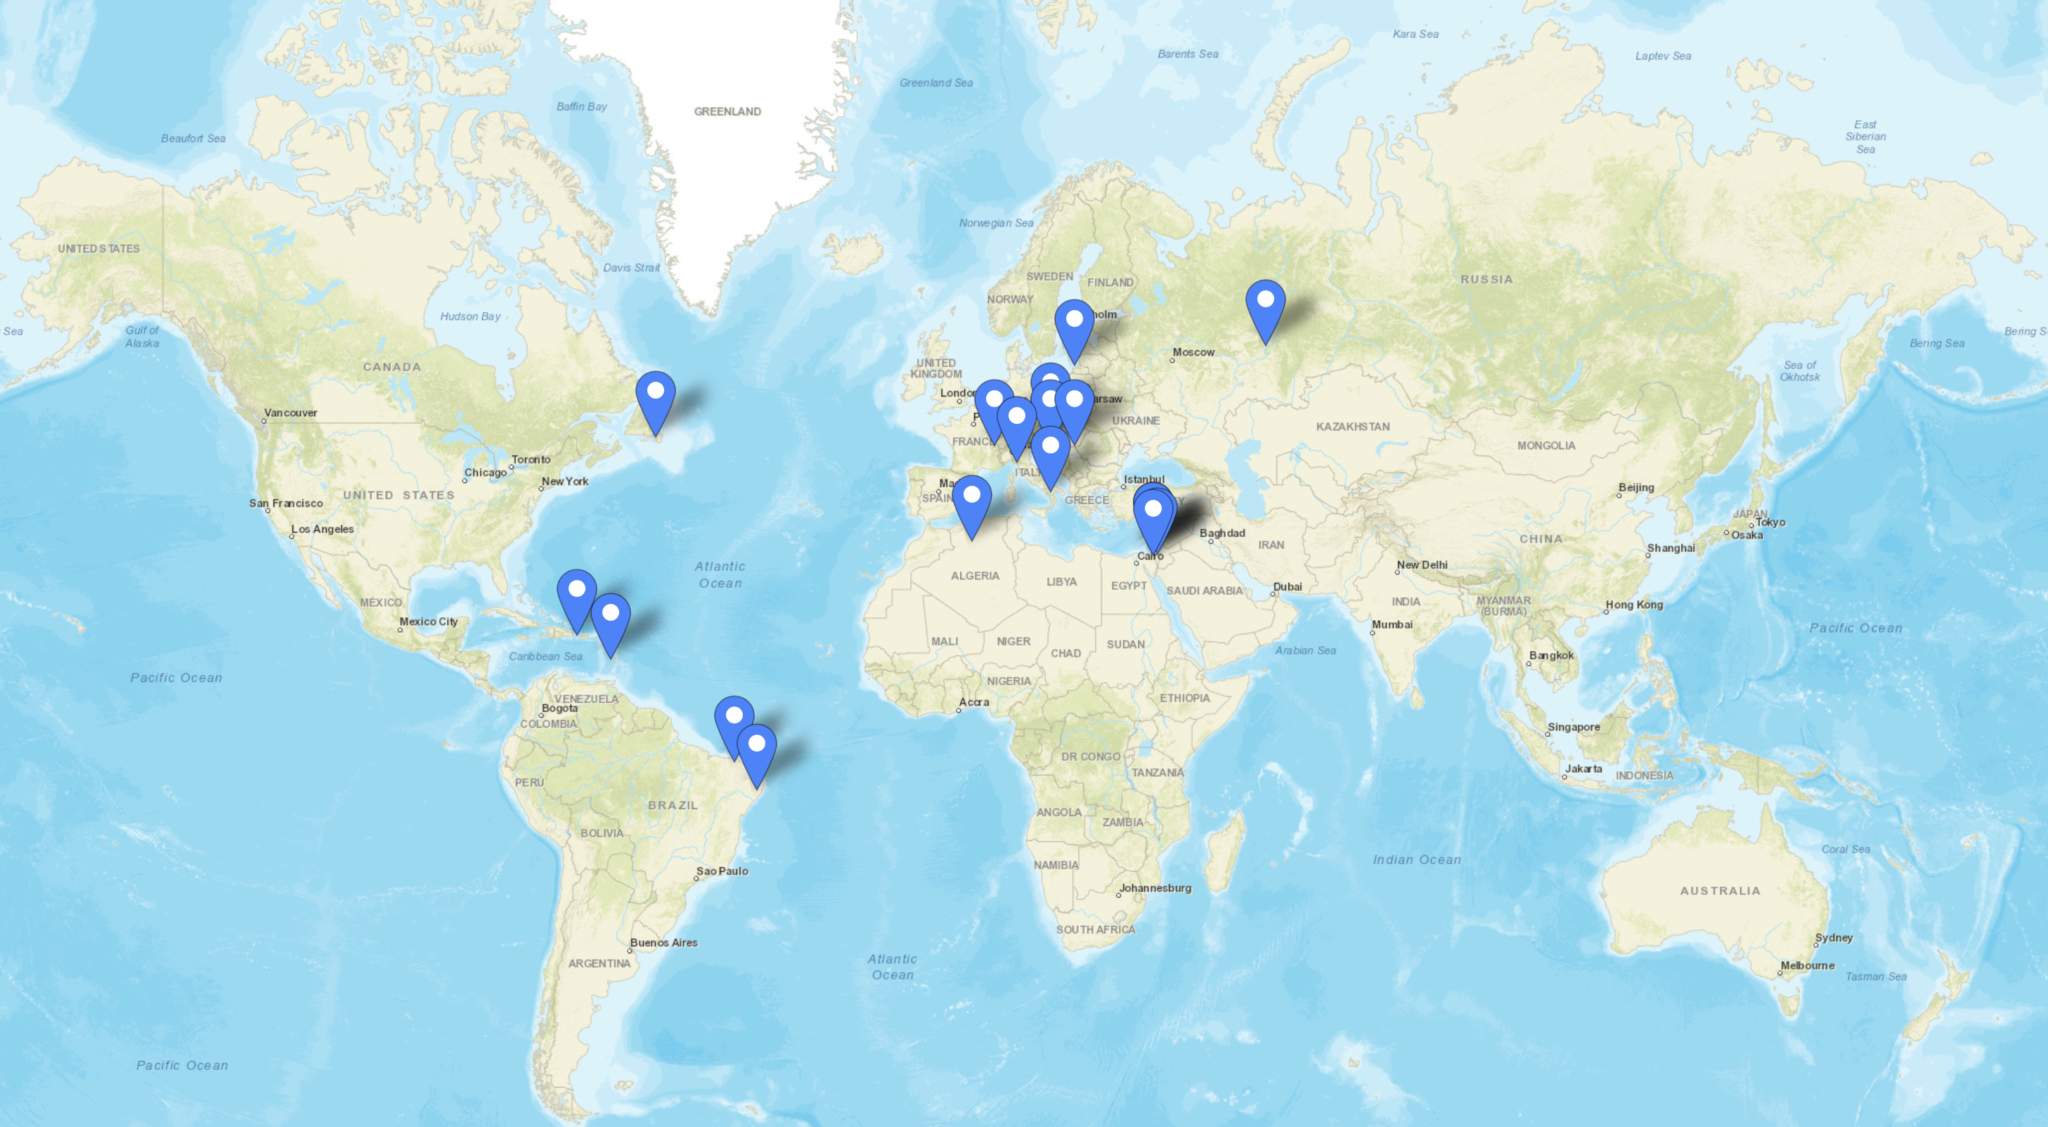
M0AWS SSB / CW / FreeDV Interactive Log World Map
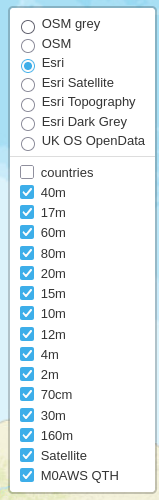
M0AWS Interactive Log Map Layers Menu
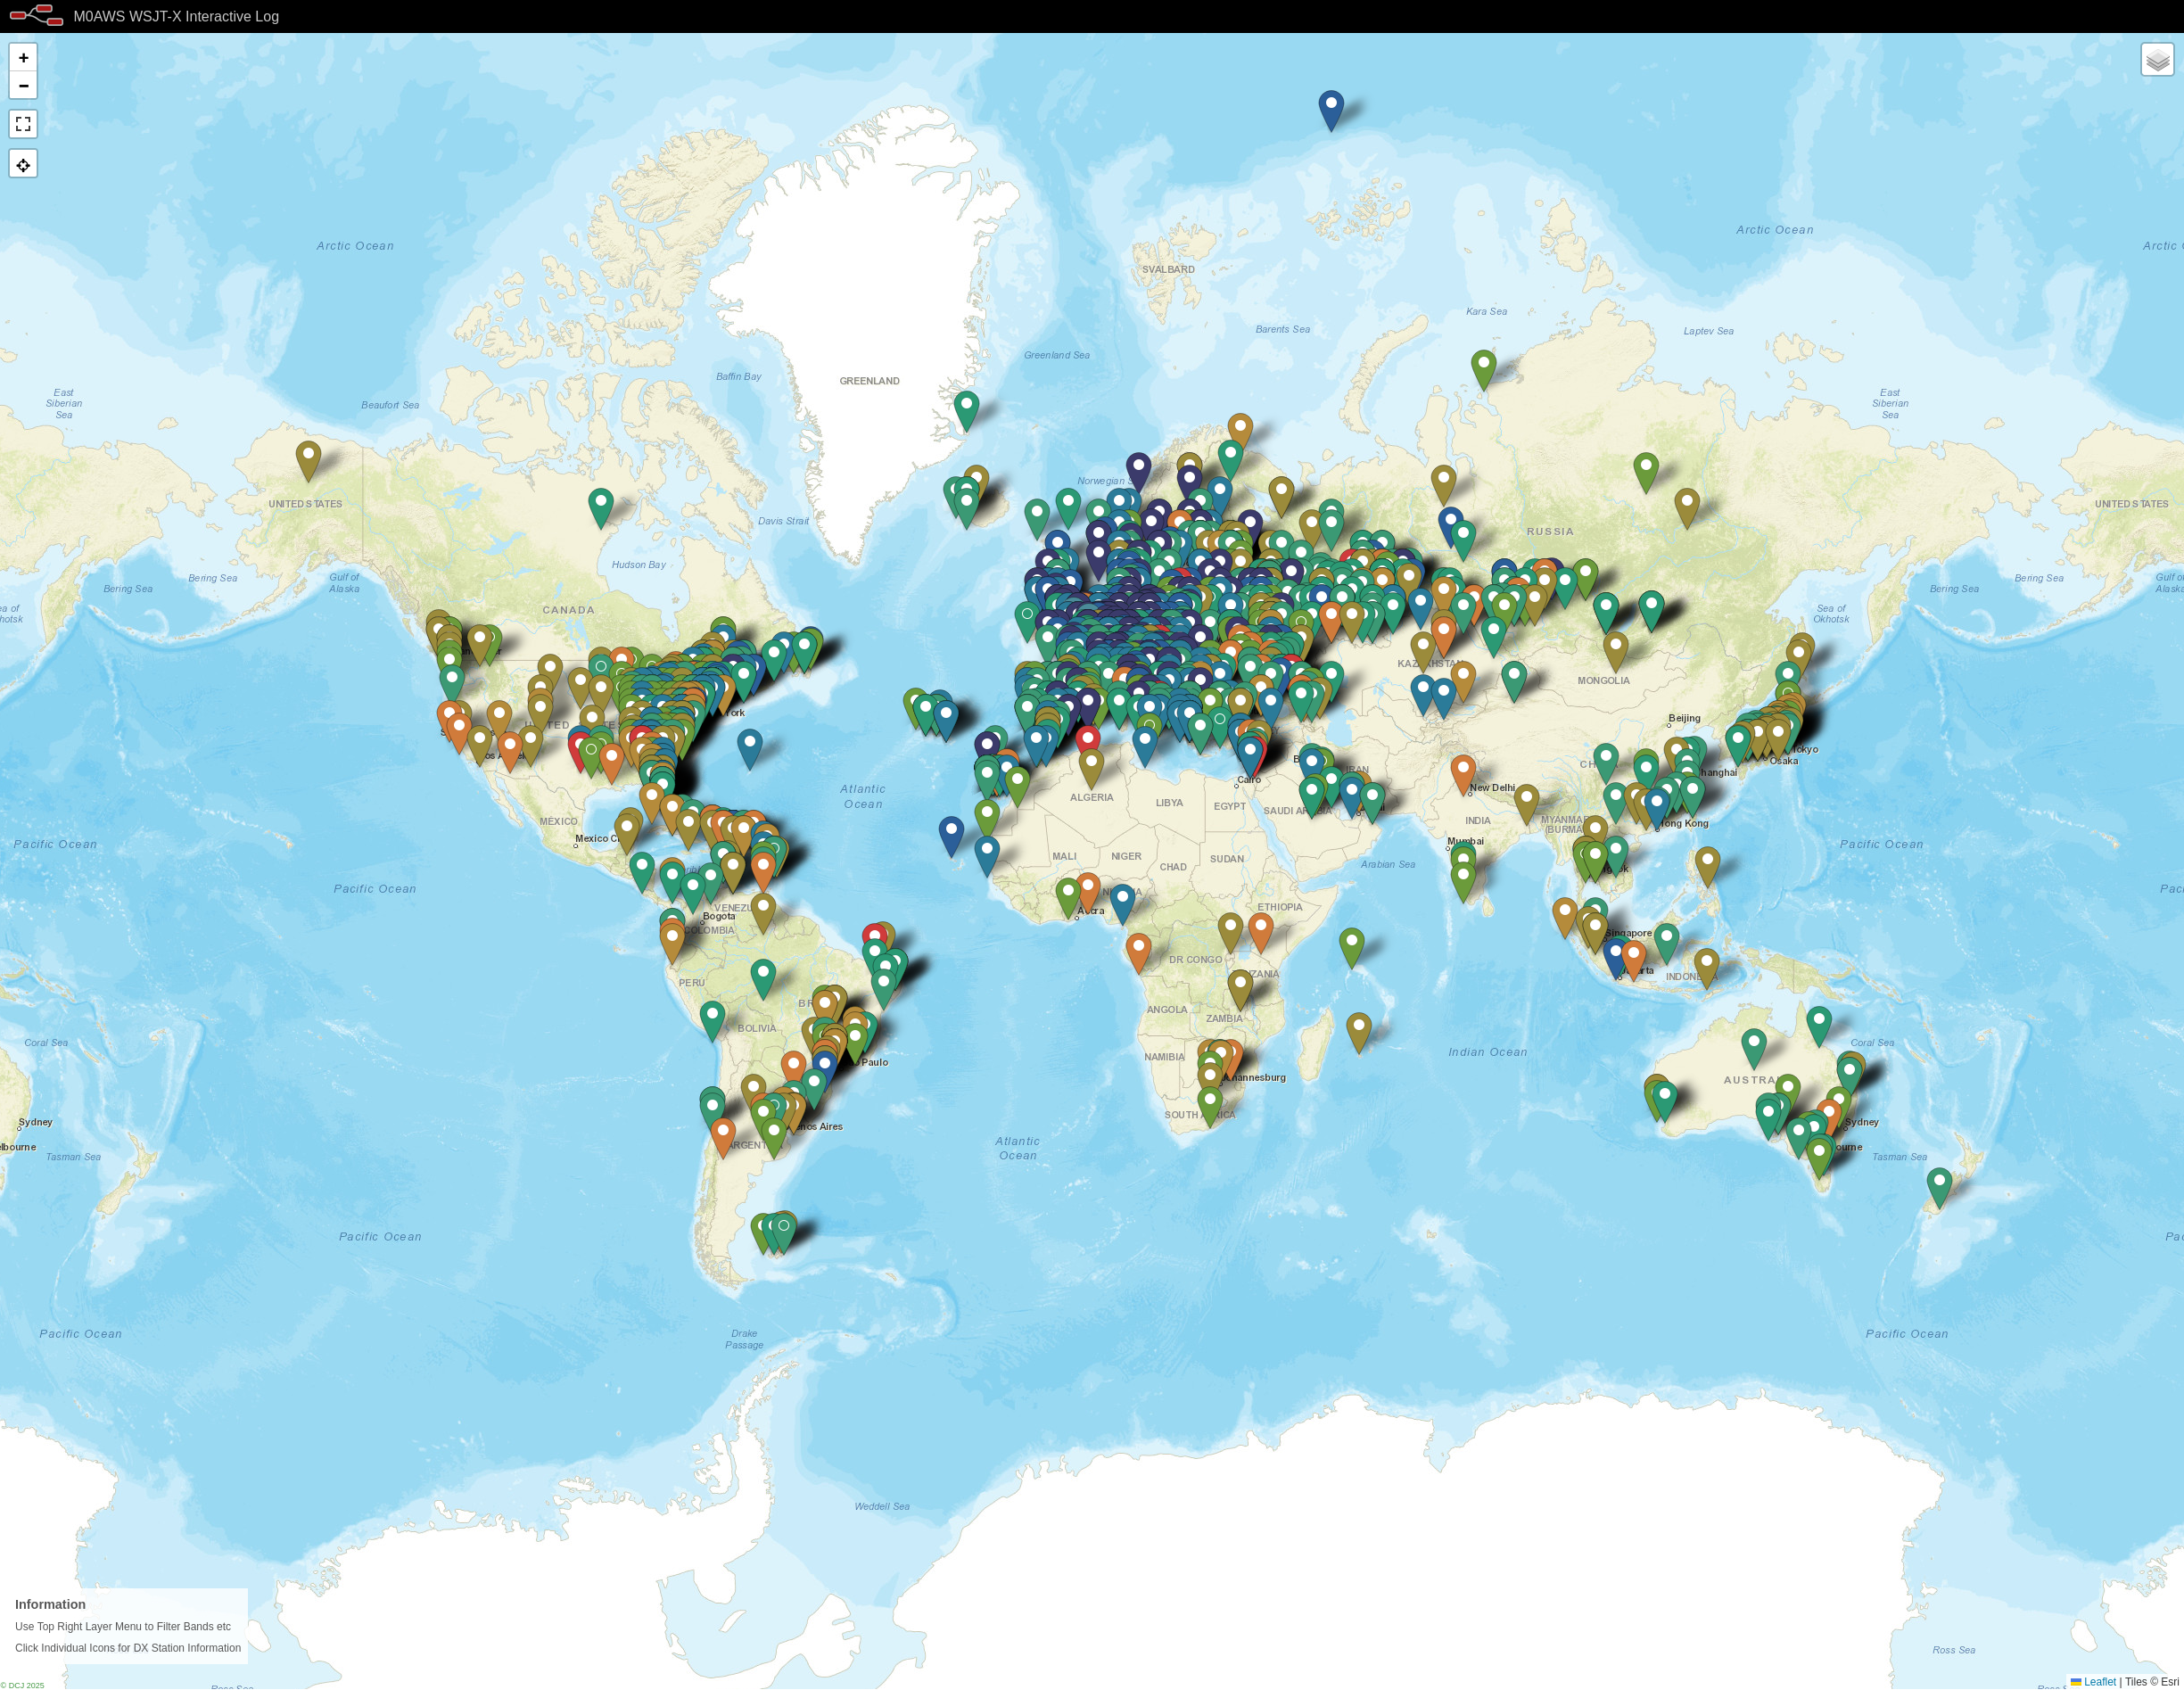
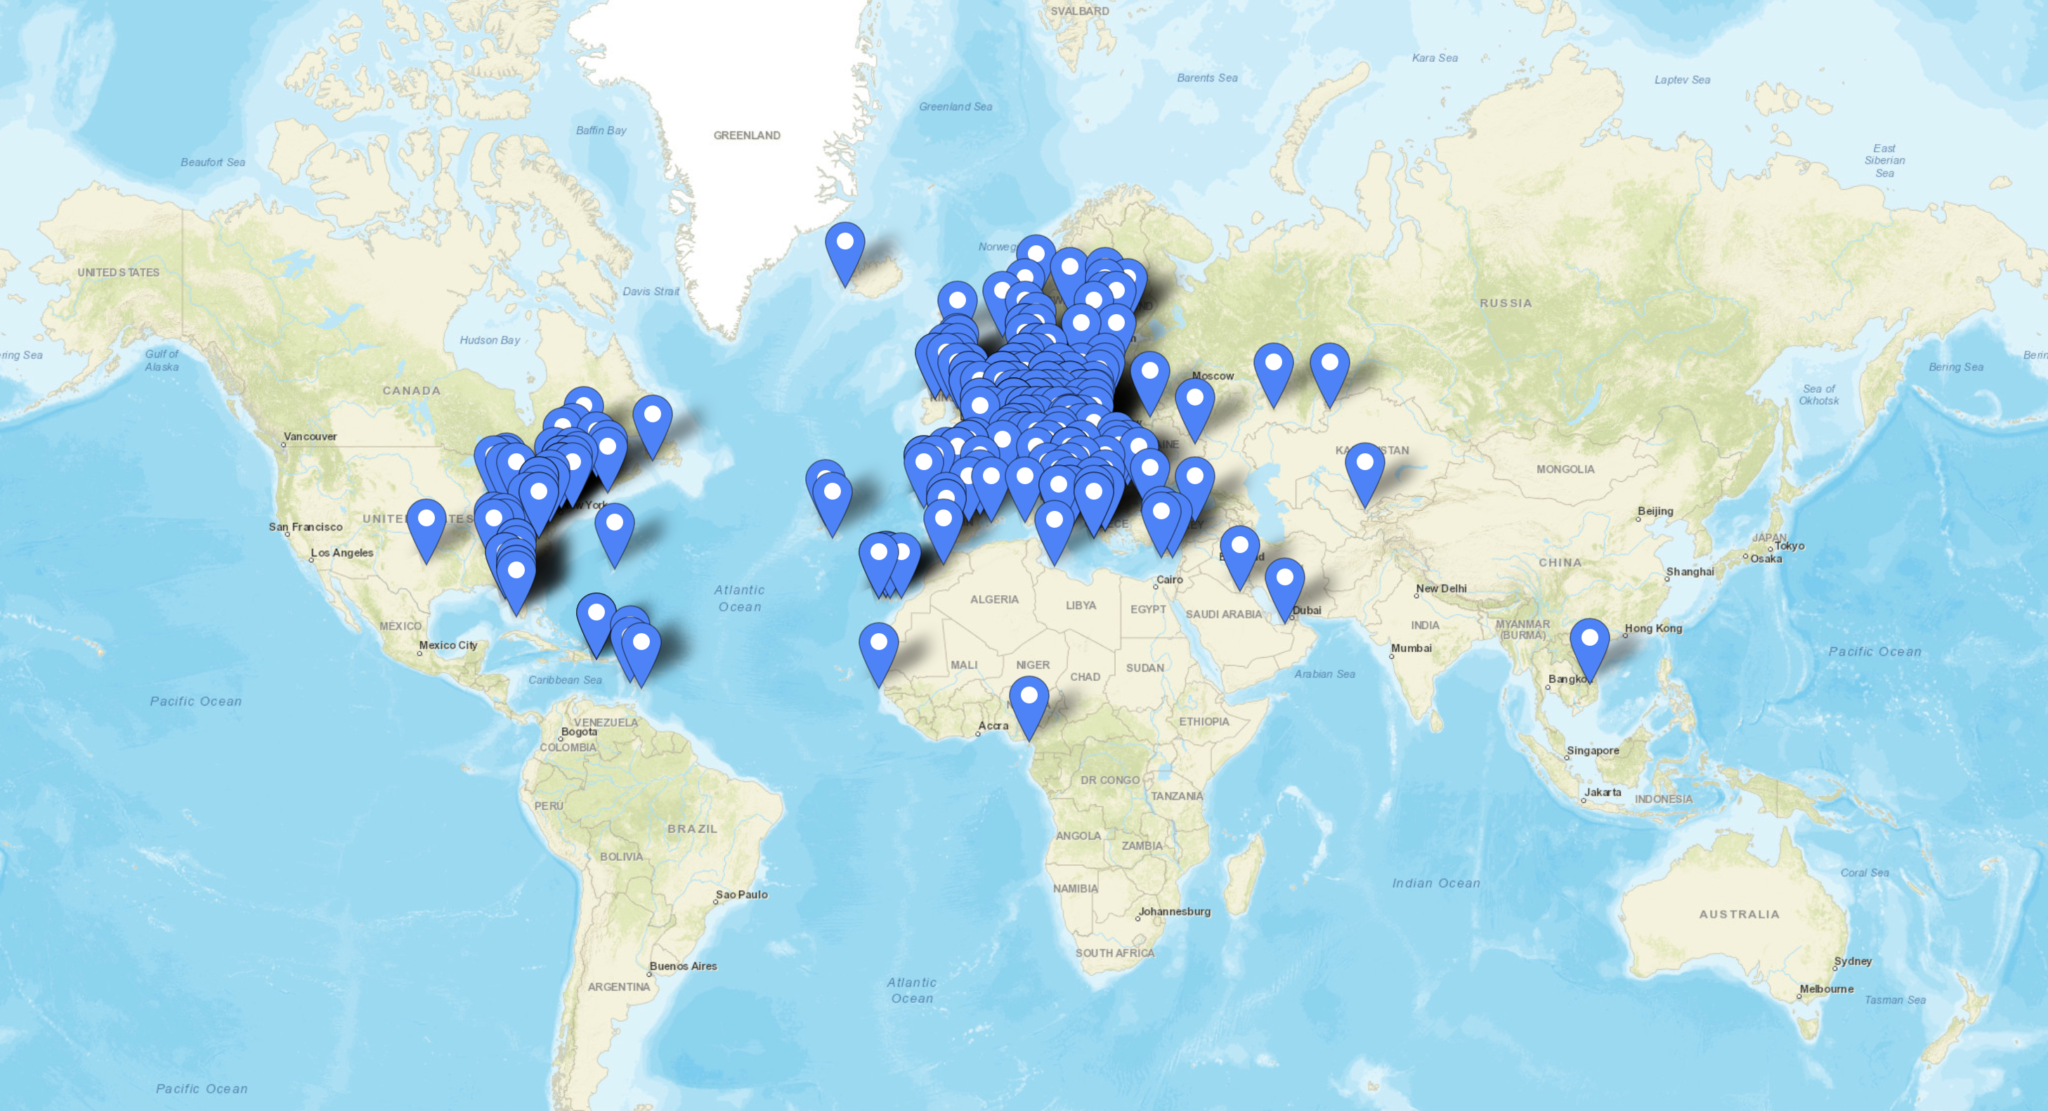
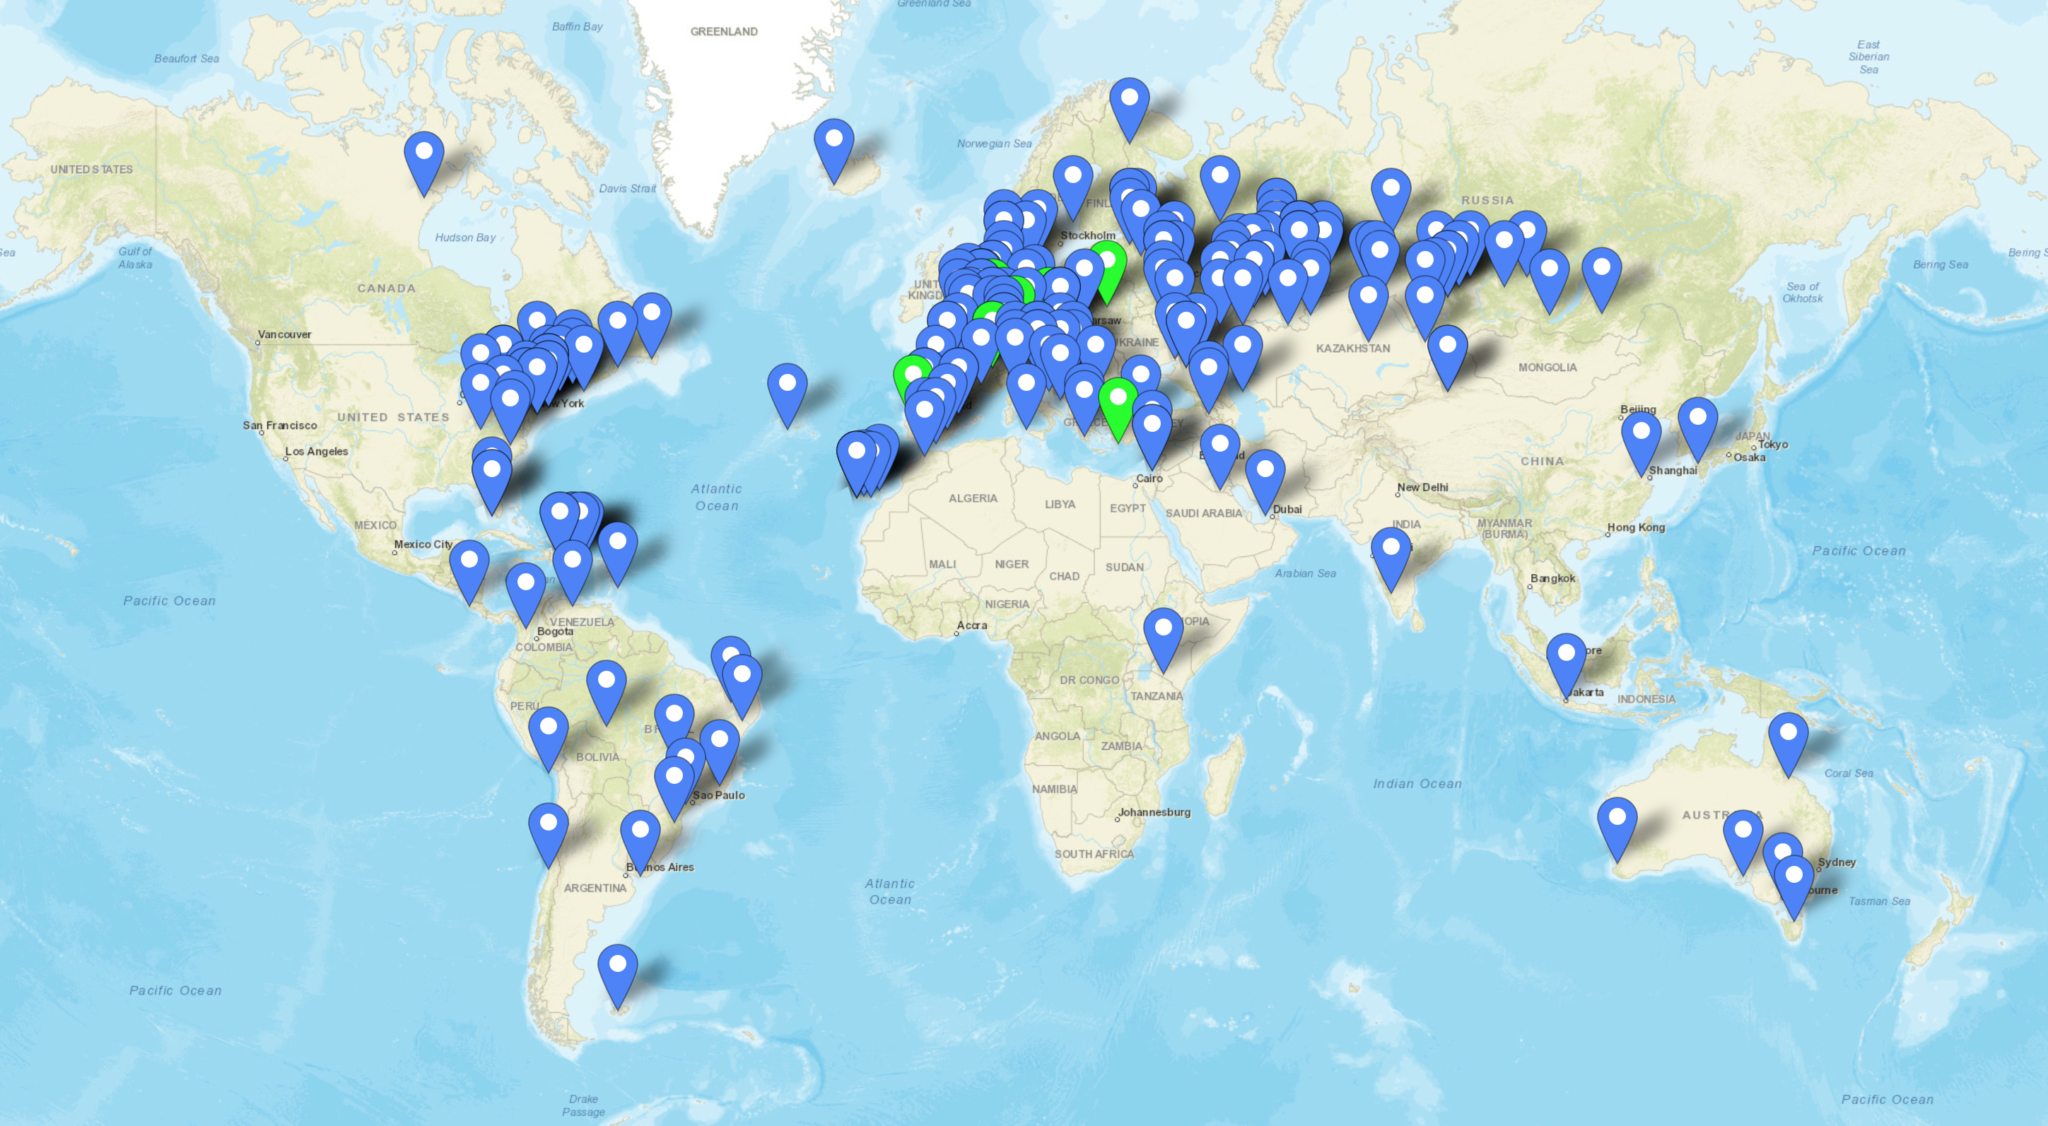
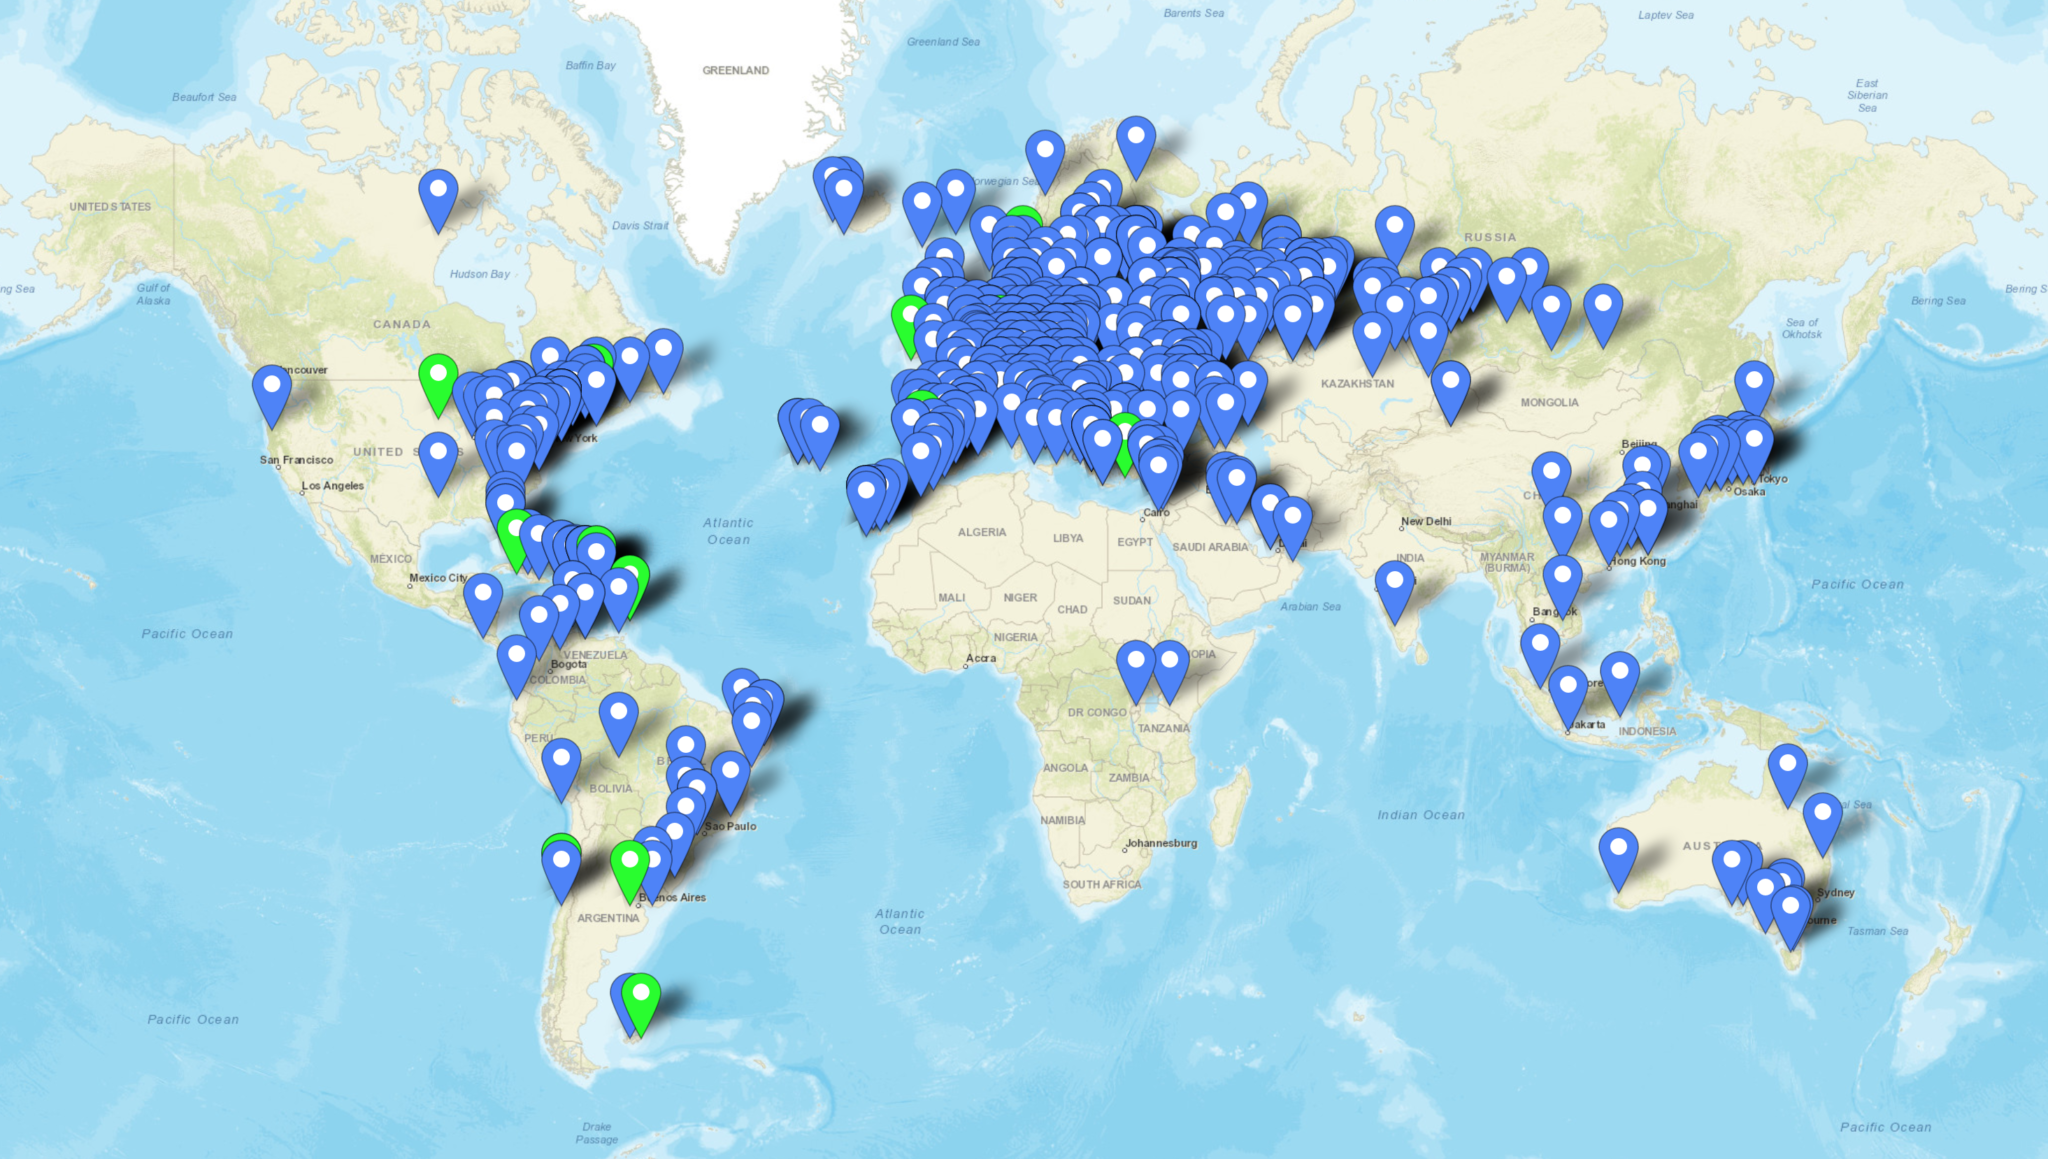
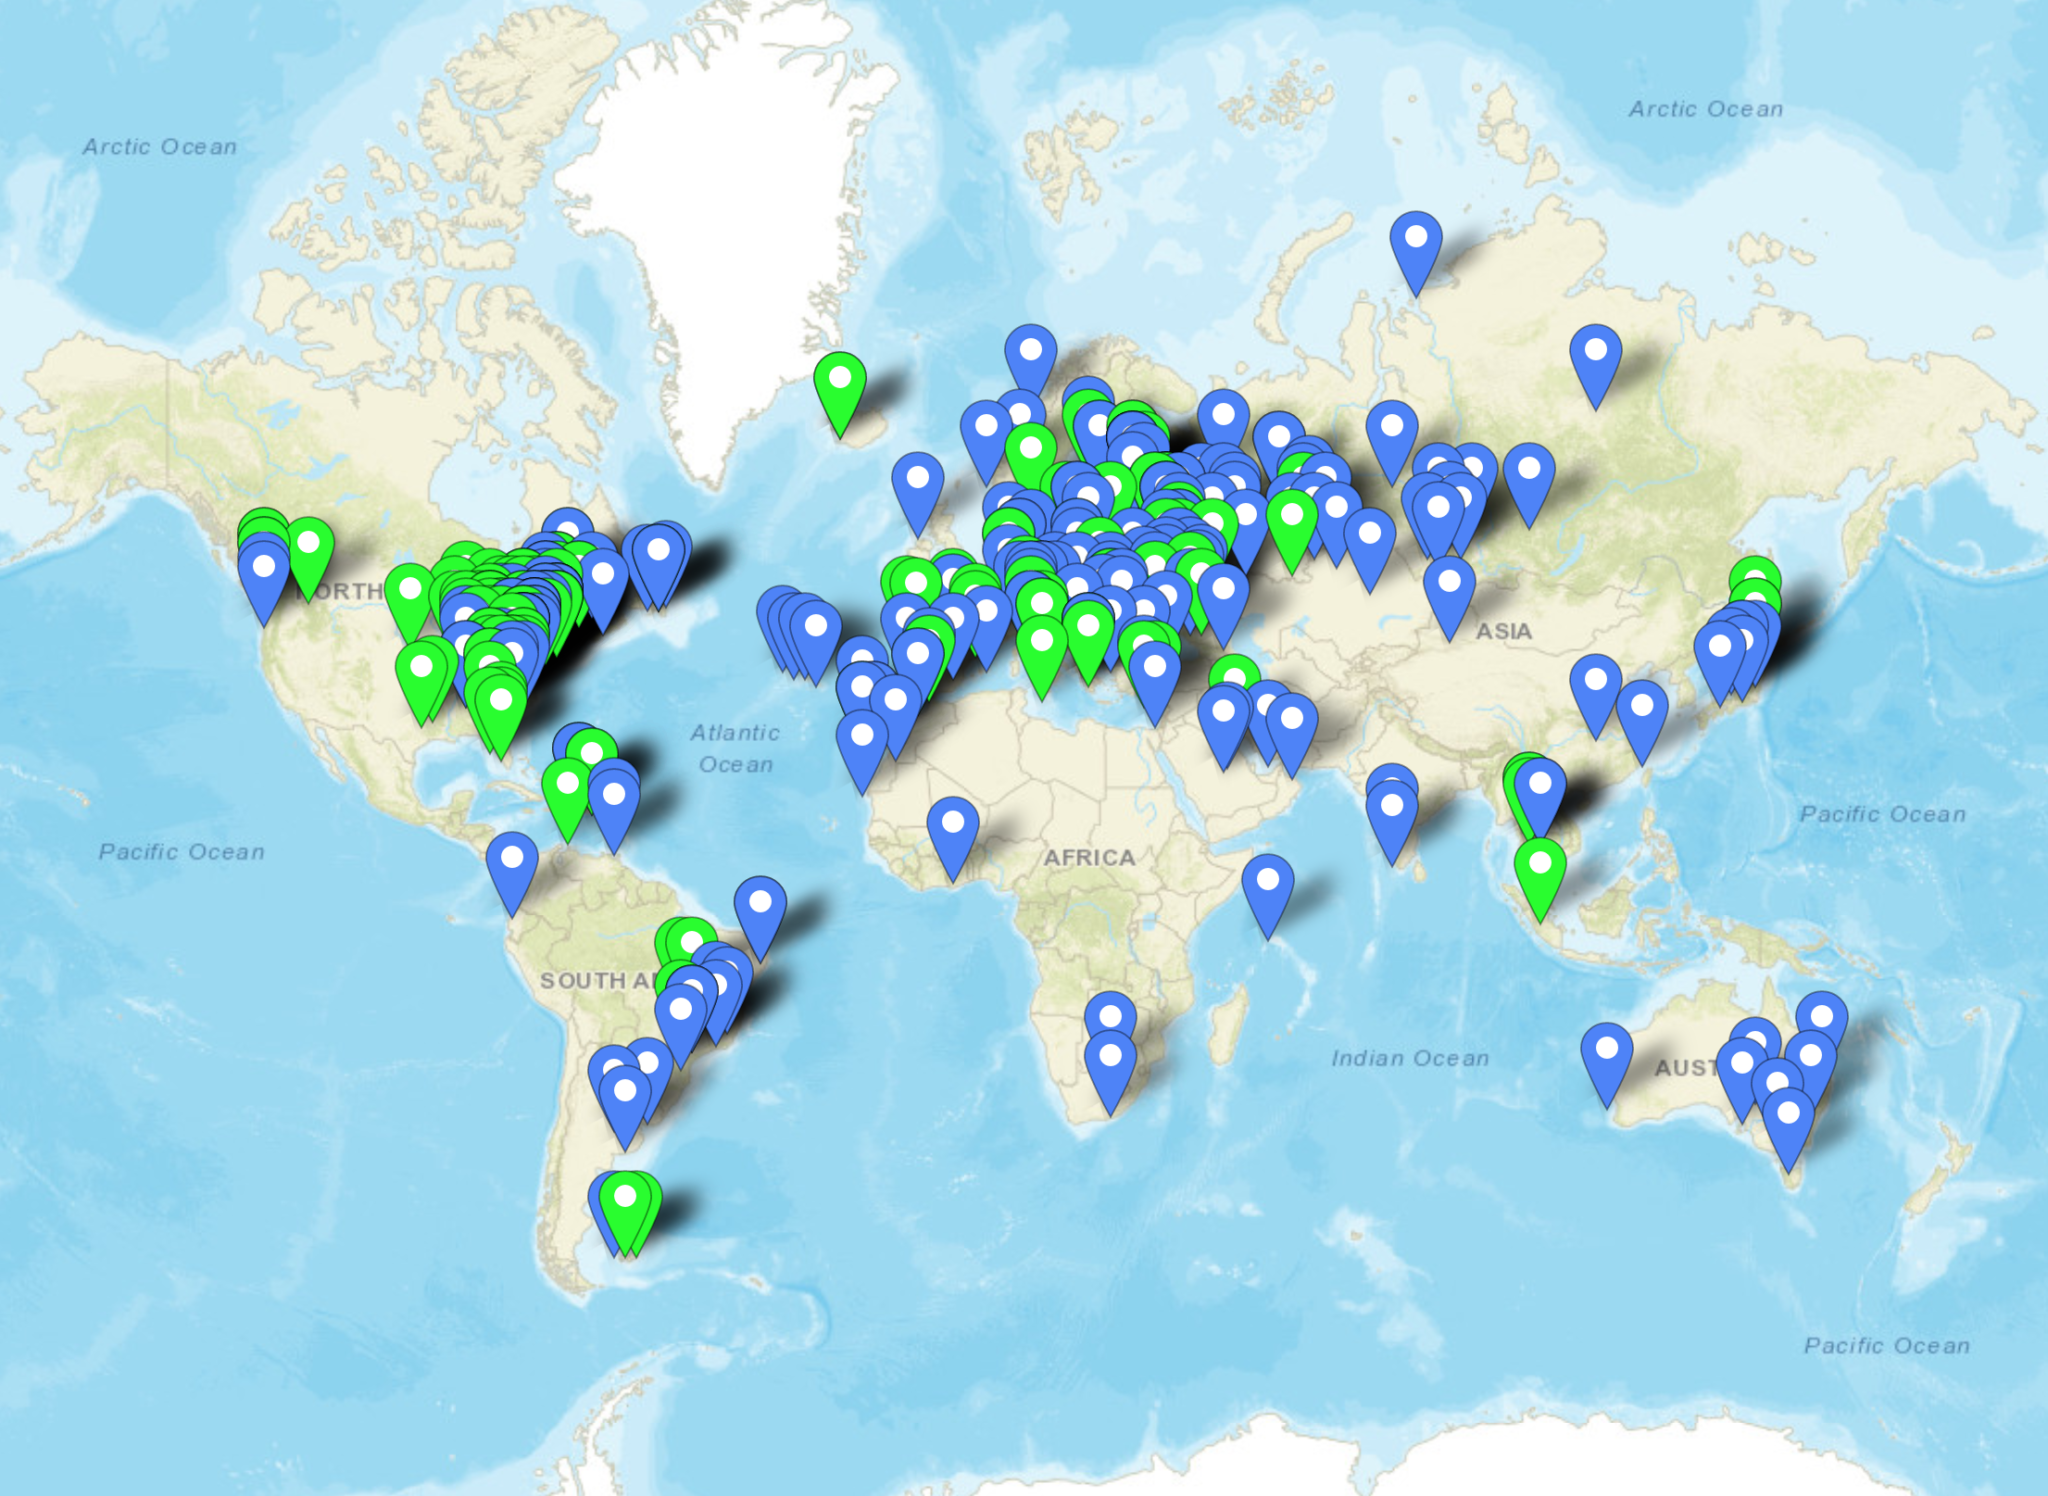
The flow generates two maps, one for voice / CW /Satellite contacts and the other for WSJT-X FT4/8 contacts. Every pin on the map is colour coded by band with satellite contacts being denoted by a satellite icon.
Each pin / icon on the map is clickable and reveals the data of the QSO being displayed.
In the top right-hand corner of the map there is a drop down layermenu that allows the viewer to filter by band thus reducing the number of icons on the screen at any one time.
Seeing the data presented on a map really brings my logs alive. An example of this is that I had no idea I’d worked so many stations in India on the QO-100 Satellite.
The small icons in the pins show a microphone for SSB/FM/FreeDV contacts and a downwards pointing triangle in a box for CW contacts. Sadly I couldn’t find a Morse key icon in the collection available.
M0AWS filtered view of QO-100 Satellite contacts
I only use FT4/8 for testing new antenna designs however, it’s interesting to see the global coverage accomplished with this weak signal mode.
M0AWS WSJT-X FT4/8 Interactive Log World Map
Once I’ve finished rewriting the format generic payload function I will make the flow available for download here so that others can also create an interactive view of their radio logs.
If you want to have a look at the maps and try them out for yourself, they are available under the Logs menu above.
This Node-Red instance is running in a virtual machine (VM) on a 16GB RAM RaspberryPi 5 that is also running a number of other VMs at the same time so, it’s safe to say it’s not heavy on CPU and will run on the older Pi4 as well.
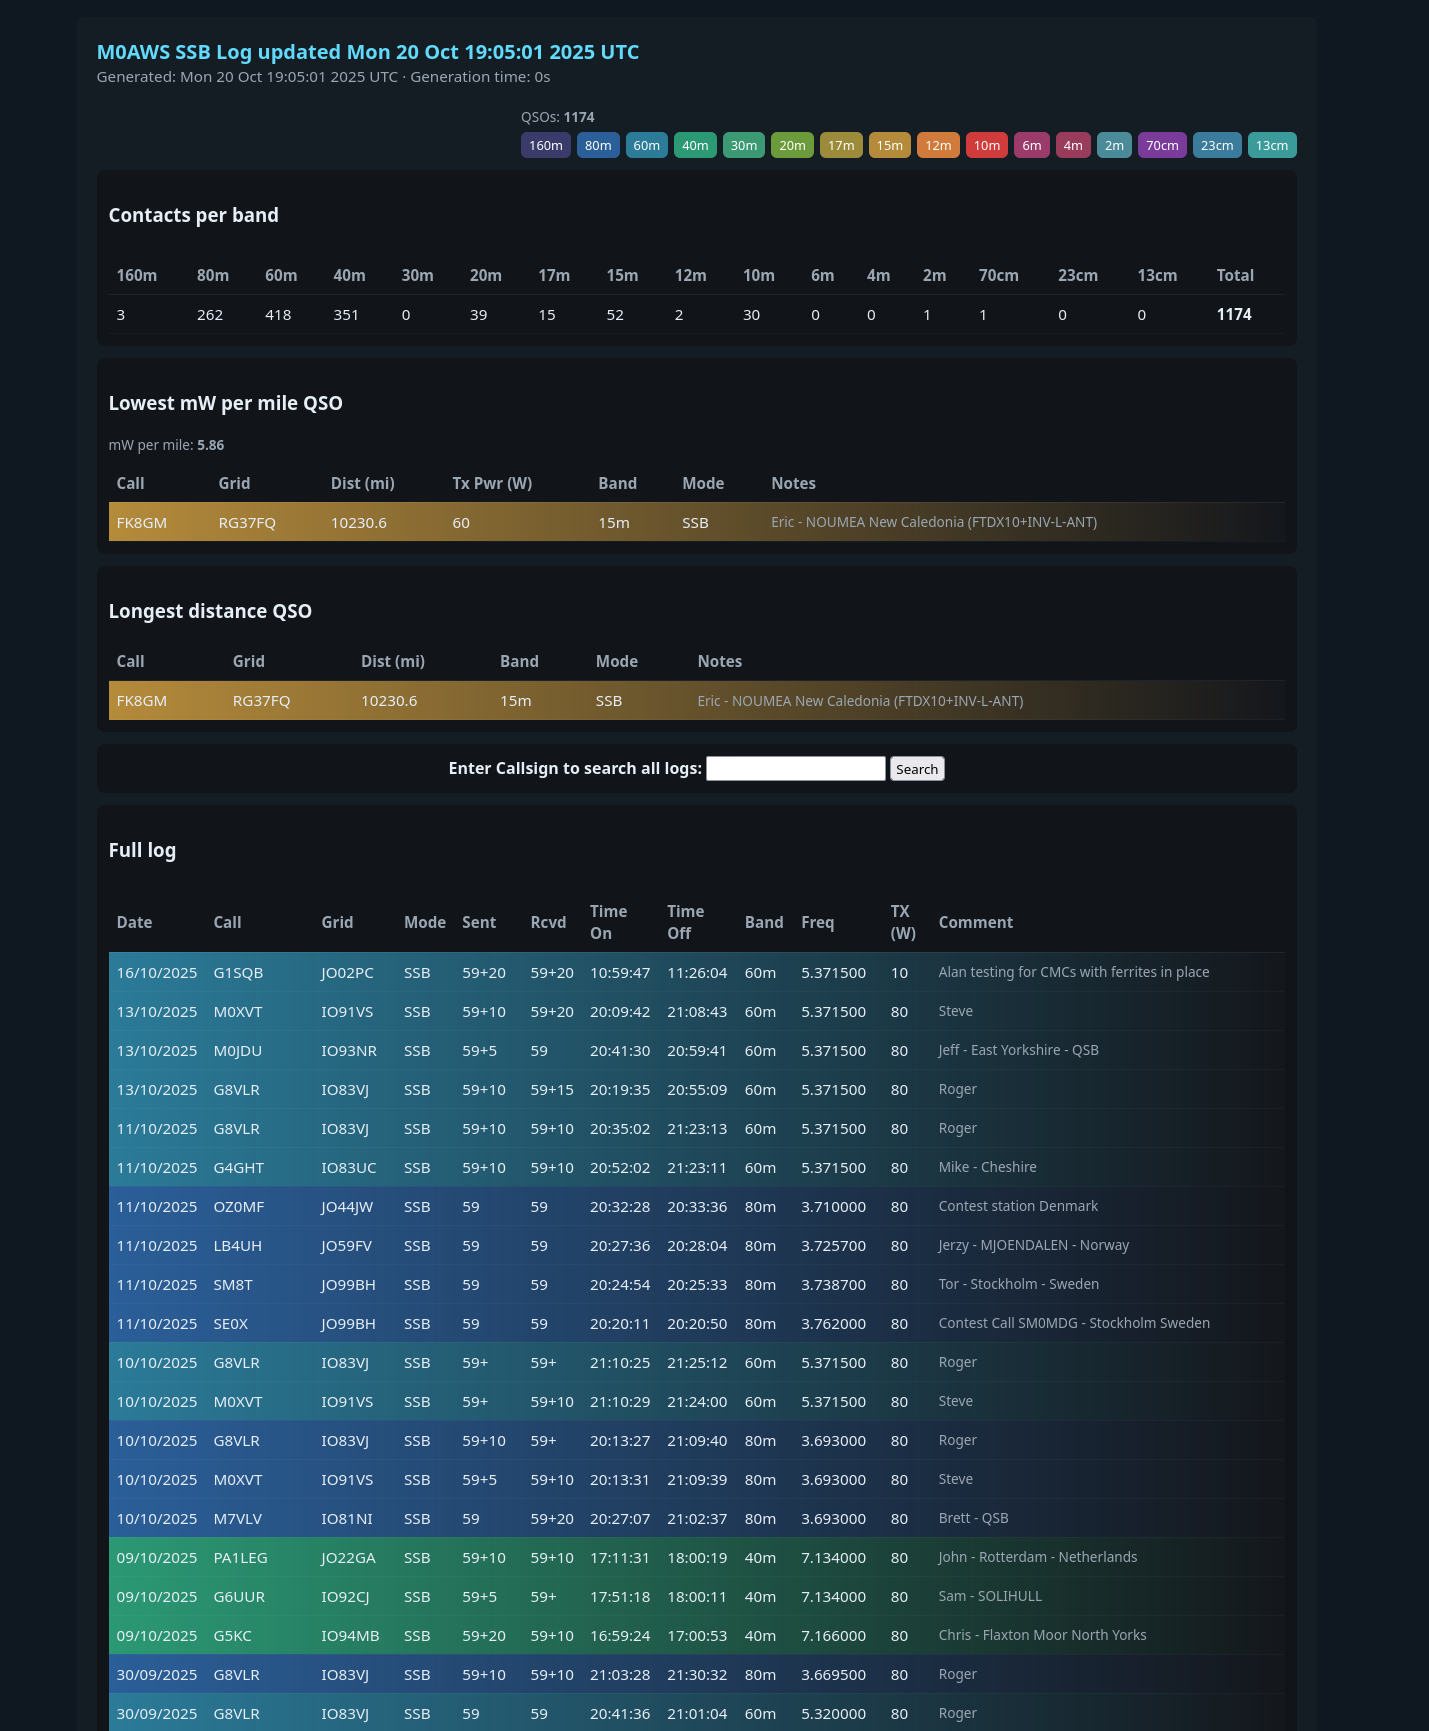
I’ve spent some considerable time of late coding a new version of adi2html that I use to convert my ADIF log files into online web pages for all my HAM Radio logs.
The old version that I wrote quite some time ago was written using BASH shell which was quick and easy at the time but, as the logs grew in size it got slower and slower to process the ever increasing number of log entries.
Now I’m retired I have the time to revisit these things and write better, more modern versions of my various programs that run silently in the background.
Writing the new version of adi2html in Python3
It’s taken a little over a week to put this code together, test and debug it, I don’t like to rush these things!
I’ve finally put v1.2 into production today.
The 585 lines of code produce a very nice, modern looking web page and can be used to convert any ADIF file into HTML. The code is extremely quick, taking less than a second to process almost 2500 log entries, a huge improvement over the old version of adi2html.
New look M0AWS Log web page
All of my logs are available here on my blog under the Logs menu above, feel free to have a look at them.
I now need to rewrite the log search functionality so that it uses the same format of presentation for the results.
Ever since I built my RaspberryPi/SHARI AllStarLink node I’ve had to manage connecting/disconnecting to/from other nodes using the Allmon2 or Supermon web admin interfaces. These work fairly well albeit, a bit clunky and buggy. It’s impossible to use from a mobile device though and so I have to get my Macbook out each time I want to connect/disconnect nodes.
Being a Node-RED fanatic I decided that I should put something together that was more portable, mobile friendly and much easier to use. A simple user interface is all that is required and can be achieved very easily using the standard Node-RED dashboard nodes.
Initially I started investigating the Linux command-line interface for Asterisk, the VOIP system that underpins AllStarLink (ASL). I very quickly discovered that the ASL node can be very easily controlled directly from the command-line and that this would be an ideal interface to use to enable node management via a Node-RED dashboard.
In very little time at all I had an experimental control dashboard working with the ASL node and was able to connect/disconnect to/from a single node. All that was required now was to extend this so that I could connect to a number of nodes with nothing more than a push of a button.
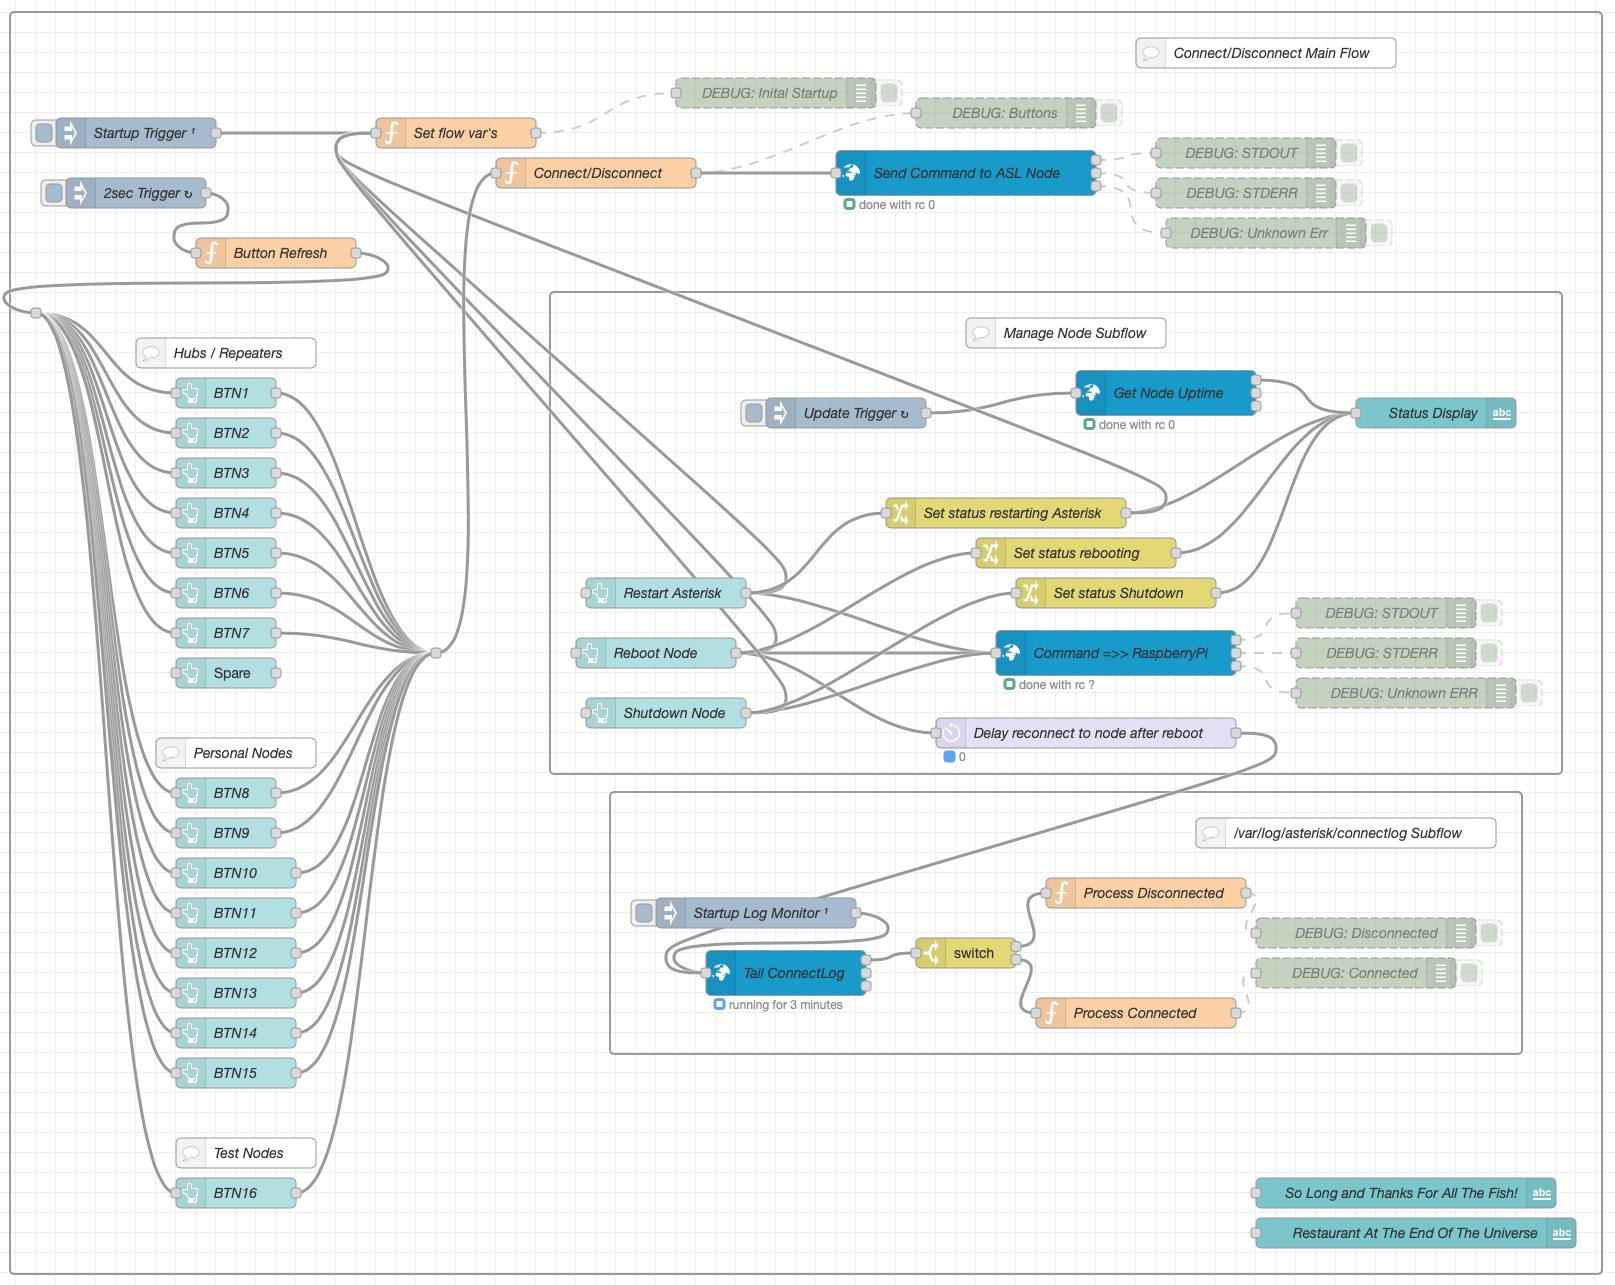
Completed v1.0 AllStarLink Control Dashboard – Node-RED Flow
The resultant flow consists of 3 sections, Connect/Disconnect Main Flow, Manage Node Subflow and /var/log/asterisk/connectlog Subflow.
The Connect/Disconnect Main Flow handles all the input from the buttons on the dashboard and the communication to the underlying Asterisk VOIP system.
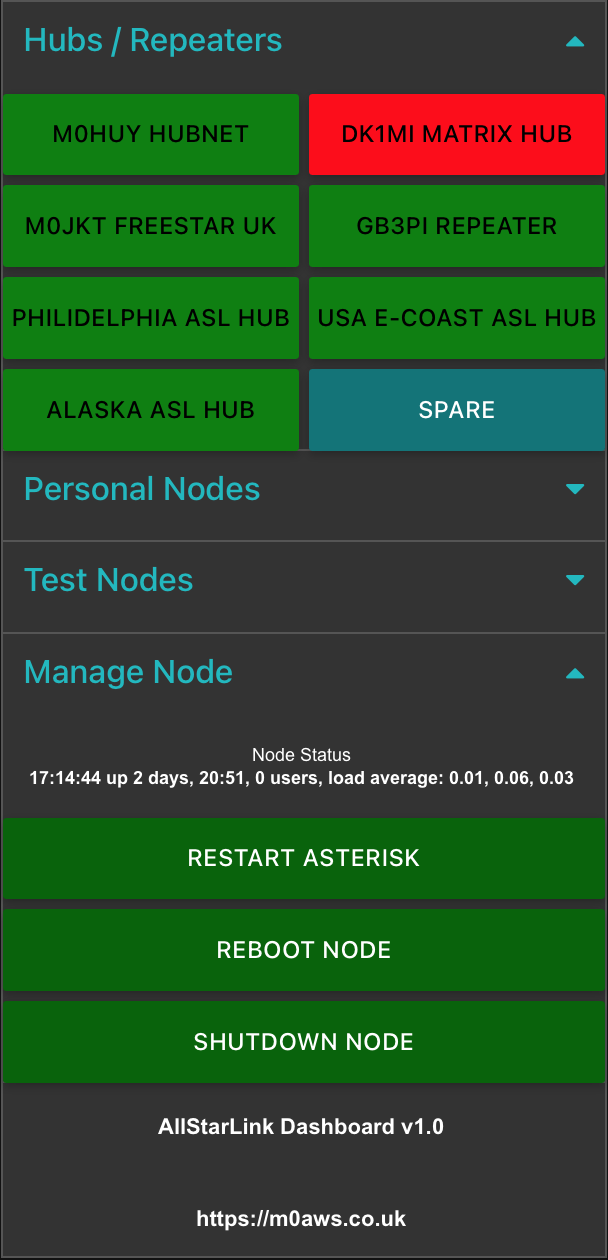
The button status is denoted by 3 colours, green (Ready to connect), orange (Transitioning to/from connect) and red (Connected). Each button is updated automatically by the button refresh function that is triggered every 2 seconds.
The Manage Node Subflow provides a simple interface to restart the Asterisk VOIP system, reboot the RaspberryPi and shutdown the RaspberryPi. The node status is automatically updated every 45 seconds and will show when the Asterisk subsystem is being restarted or the node is being rebooted or shutdown.
Finally the var/log/asterisk/connectlog Subflow monitors the Asterisk connectlog looking for connect/disconnect messages so that it can signal to update each button status.
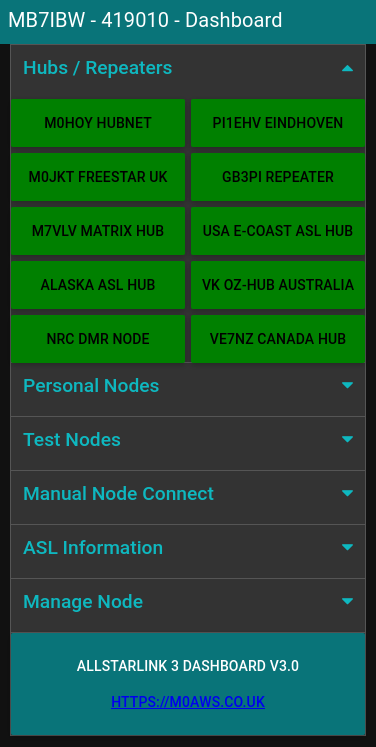
Node-RED AllStarLink Dashboard
Each section of the dashboard can be collapsed/opened by touching/clicking the little blue arrows on the right of the dashboard. The dashboard works fine on Android, iOS, Windows, MacOS and Linux.
If you’re not familiar with Node-RED and haven’t yet installed it to your PC, take a look at the Node-RED Getting Started Page. The information takes you through installing Node-RED onto a multitude of devices including PC and RaspberryPi devices.
Once you have Node-RED installed all you need to do is download the AllStarLink Control Dashboard Flow and import it to your Node-RED flow editor.
Note: The link above is now for v1.2 of the flow which includes some critical bug fixes. You can read about the bug fixes in the v1.2 release article.
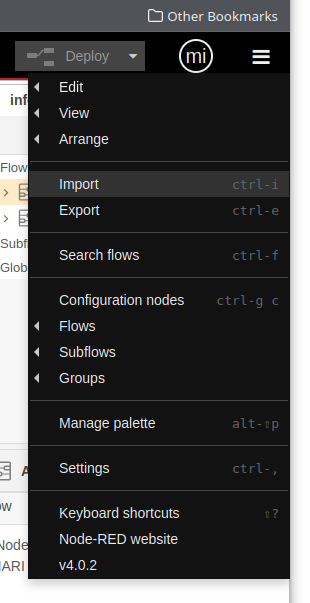
Once downloaded, select Import from the burger menu icon on the right-hand side of the flow editor as shown below and import the flow file.
Node-RED Flow Editor import Menu Item
Once imported you will find that some of the nodes in the flow are not available. This is because you need to add them to the flow editor palette before being able to deploy the flow.
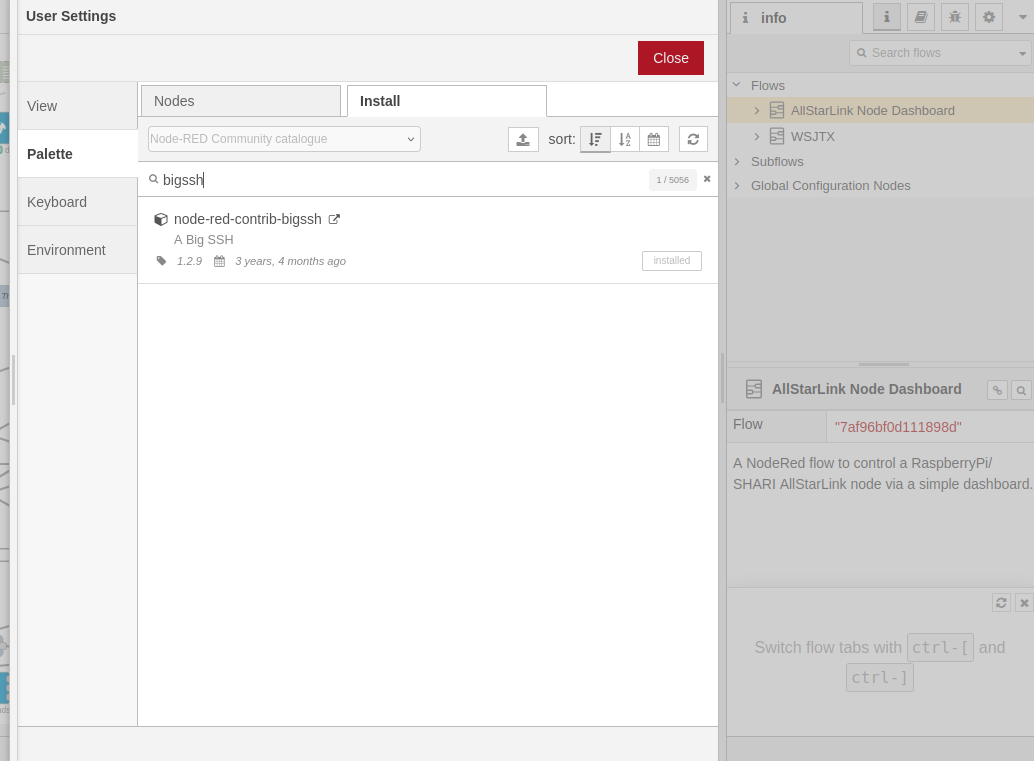
Drop down the same menu as shown above but, this time select Manage Palette. This will open another window where you will need to select the Install tab as shown below.
Node-RED Flow Editor Palette Install Tab
You need to install two node sets to complete the flow, node-red-contrib-bigssh and node-red-dashboard. Type in the name of each package one at a time in the search bar and then click the Install button. Once the two packages are installed you then need to configure the credentials for logging into your RaspberryPi. This is simply done by double clicking the blue Send Command to ASL node at the top of the main flow and then clicking the Pencil button at the end of the Credentials field. This will open another window where you will need to type in the IP Address of your ASL RaspberryPi into the Host field, then enter 22 into the port field, add repeater into the Username field (repeater is the default username, if you have changed this then you will need to add the new username name in instead) and then the password associated with the repeater login into the Password field. (Normally allstarlink)
Once this is done, do the same on the other blue nodes, namely “Get Node Uptime“, “Command =>> RaspberryPi” and “Tail ConnectLog”.
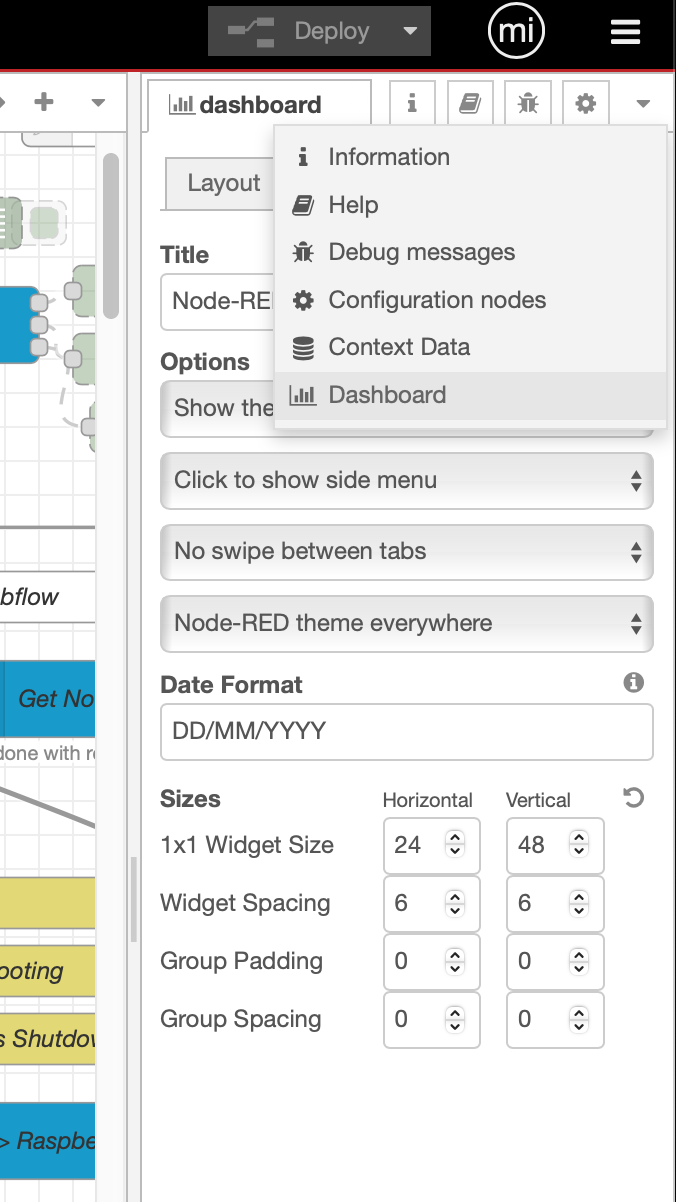
The final thing to setup is the dashboard size. Click on the downward pointing triangle at the top right of the menu bar (under the burger menu) and select dashboard. Check that the sizes are set the same as in the image below. For some reason, these settings aren’t always imported (Possible bug?) so, if your dashboard layout isn’t like shown above it will be because these settings failed to import.
ASL Dashboard Settings
You are now ready to deploy your AllStarLink Control Dashboard! Press the red Deploy button at the top of the flow editor window.
Finally, if you want to change the nodes that each button connects/disconnects you will need to edit the set flow var’s function at the top of the main flow. All you will need to do is replace the existing node numbers taking care not to alter the rest of the code in any way otherwise, it could stop the flow from working.
Once you’ve edited the node numbers, double click on the associated button node and change its Label to show the new node name.
Once your changes are complete, Deploy the flow again and your changes will be live.
This is version 1 of the ASL Dashboard, I already have ideas for version 2 that will also have the ability to enter a node number into a field and connect to it without the need to program it into a button.
I’ve been active on QO-100 for a few days now and I have to admit that I’m really pleased with the way the ground station is performing. I’m getting a good strong, quality signal into the satellite along with excellent audio reports from my Icom IC-705 and the standard fist mic.
I’m very pleased with the performance of the NooElec v5 SDR receiver that I’m now using in place of the Funcube Dongle Pro+ SDR receiver. Being able to see the entire bandwidth of the satellite transponder on the waterfall in the GQRX SDR software is a huge plus too.
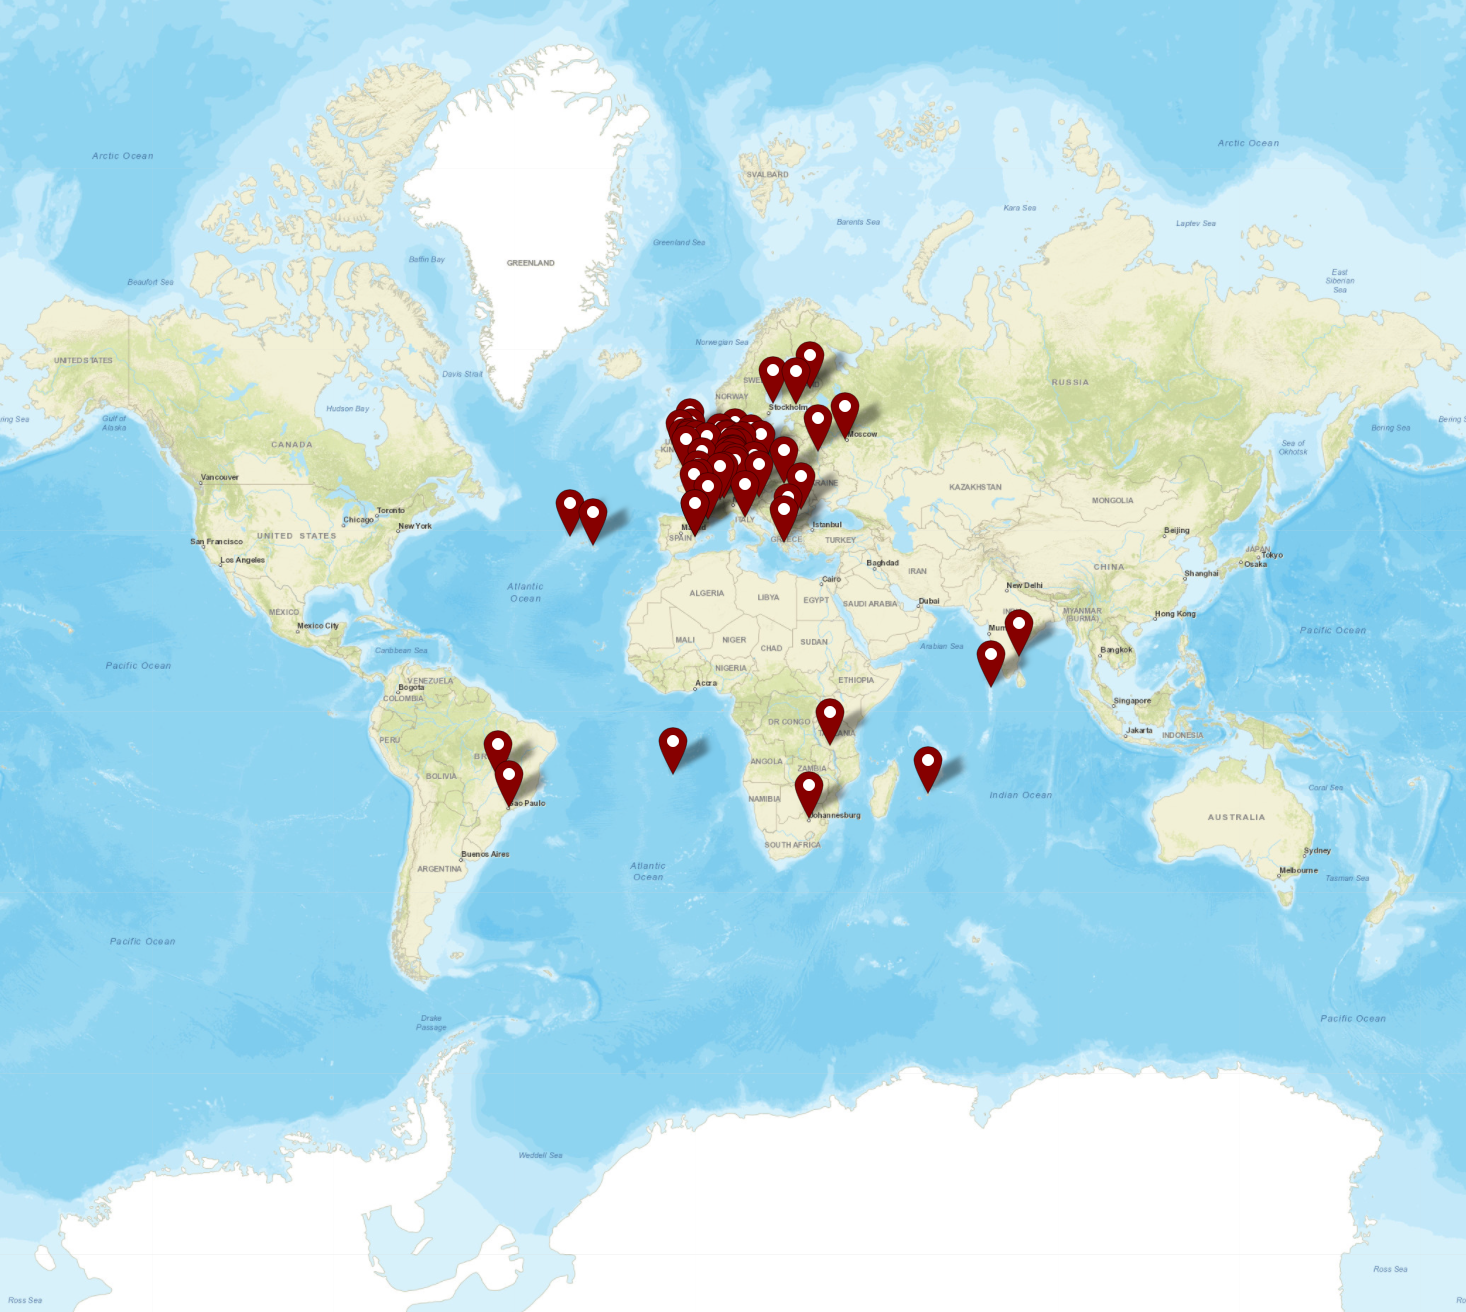
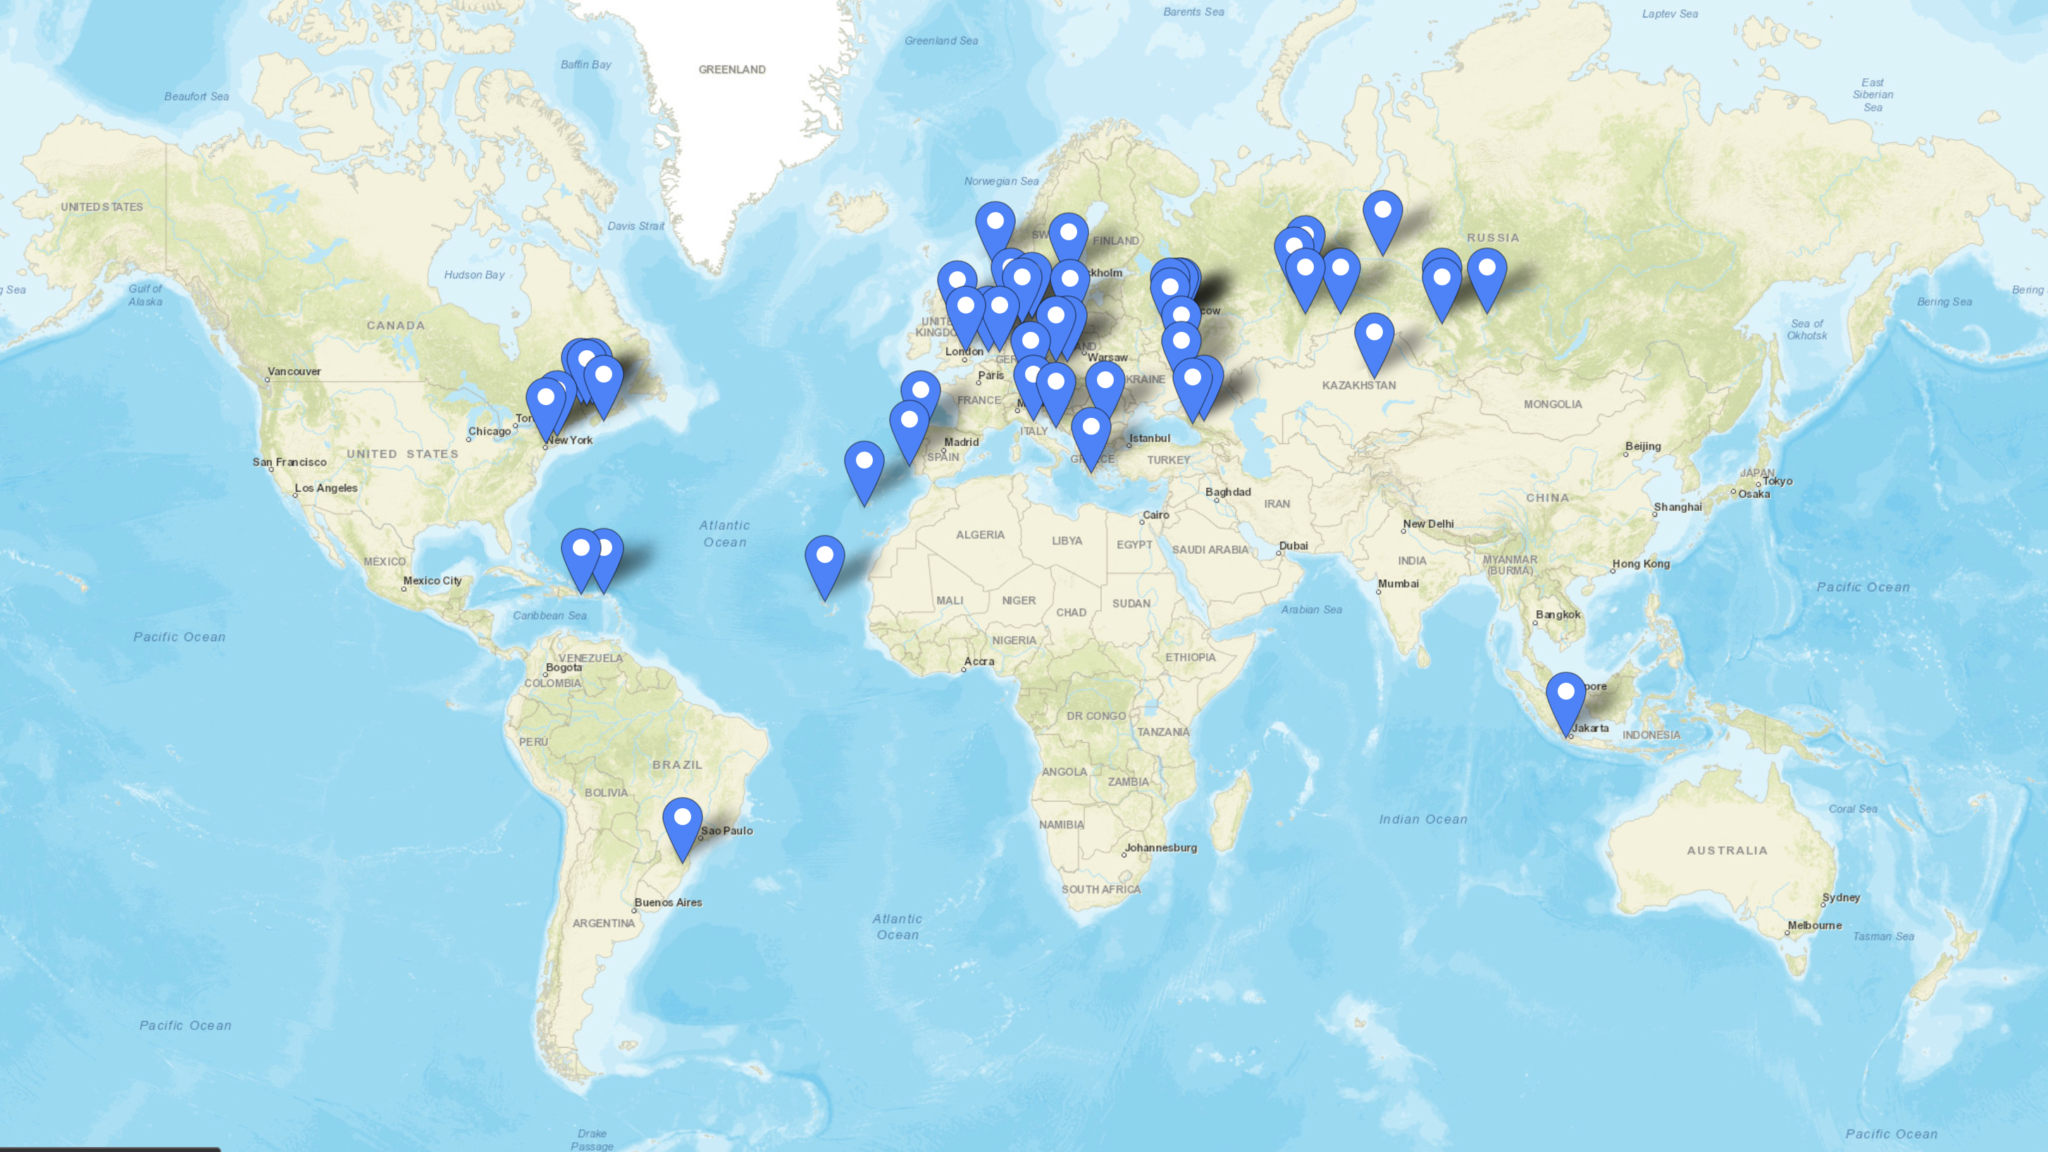
M0AWS QO-100 Satellite Log map showing contacts as of 23/06/23
As can be seen on the map of contacts above, I’ve worked some interesting stations on some of the small islands in the Atlantic and Indian Oceans. The signals from these stations are incredibly strong on the satellite and an easy armchair copy.
DX of note are ZD7GWM on St. Helena Island in the South Atlantic Ocean, PP2RON and PY2WDX in Brazil, 8Q7QC on Naifaru Island in the Maldives, VU2DPN in Chennai India, 5H3SE/P in Tanzania Africa and 3B8BBI/P in Mauritius.
There are many EU stations on the satellite too and quite a few regular nets of German and French stations. I’ve not plucked up the courage to call into the nets yet, perhaps in the future.
There are a lot of very experienced satellite operators on QO-100 with a wealth of information to share. I’ve learnt a lot just from chatting with people with some conversations lasting well over 30mins, a rarity on the HAM bands today.
We also had our first Matrix QO-100 Net this week, an enjoyable hour of chat about all things radio and more. We have a growing community of Amateur Radio enthusiasts from around the world on the Matrix Chat Network with a broad spectrum of interests. If you fancy joining a dynamic community of radio enthusiasts then just click the link to download a chat client and join group.
I’ve been making a few improvements to my QO-100 Node Red Dashboard whilst waiting for the 2.4Ghz hardware to arrive. I’ve added the ability to split the RX and TX VFOs so that I can tune away from the TX frequency for working split stations or for tuning to slightly off frequency stations. I also added a series of tuning buttons to the top of the GQRX side of the dashboard to enable easy tuning using the trackball connected to my Kubuntu PC. This worked well but, I really missed having a real VFO knob like a conventional radio.
As I had a Griffin Powewrmate USB VFO from a previous SDR radio I added it to the flow as well so that I had a physical VFO knob for the SDR receiver. Details on how I got it working using evtest and a simple BASH script are in the Griffin Powermate article.
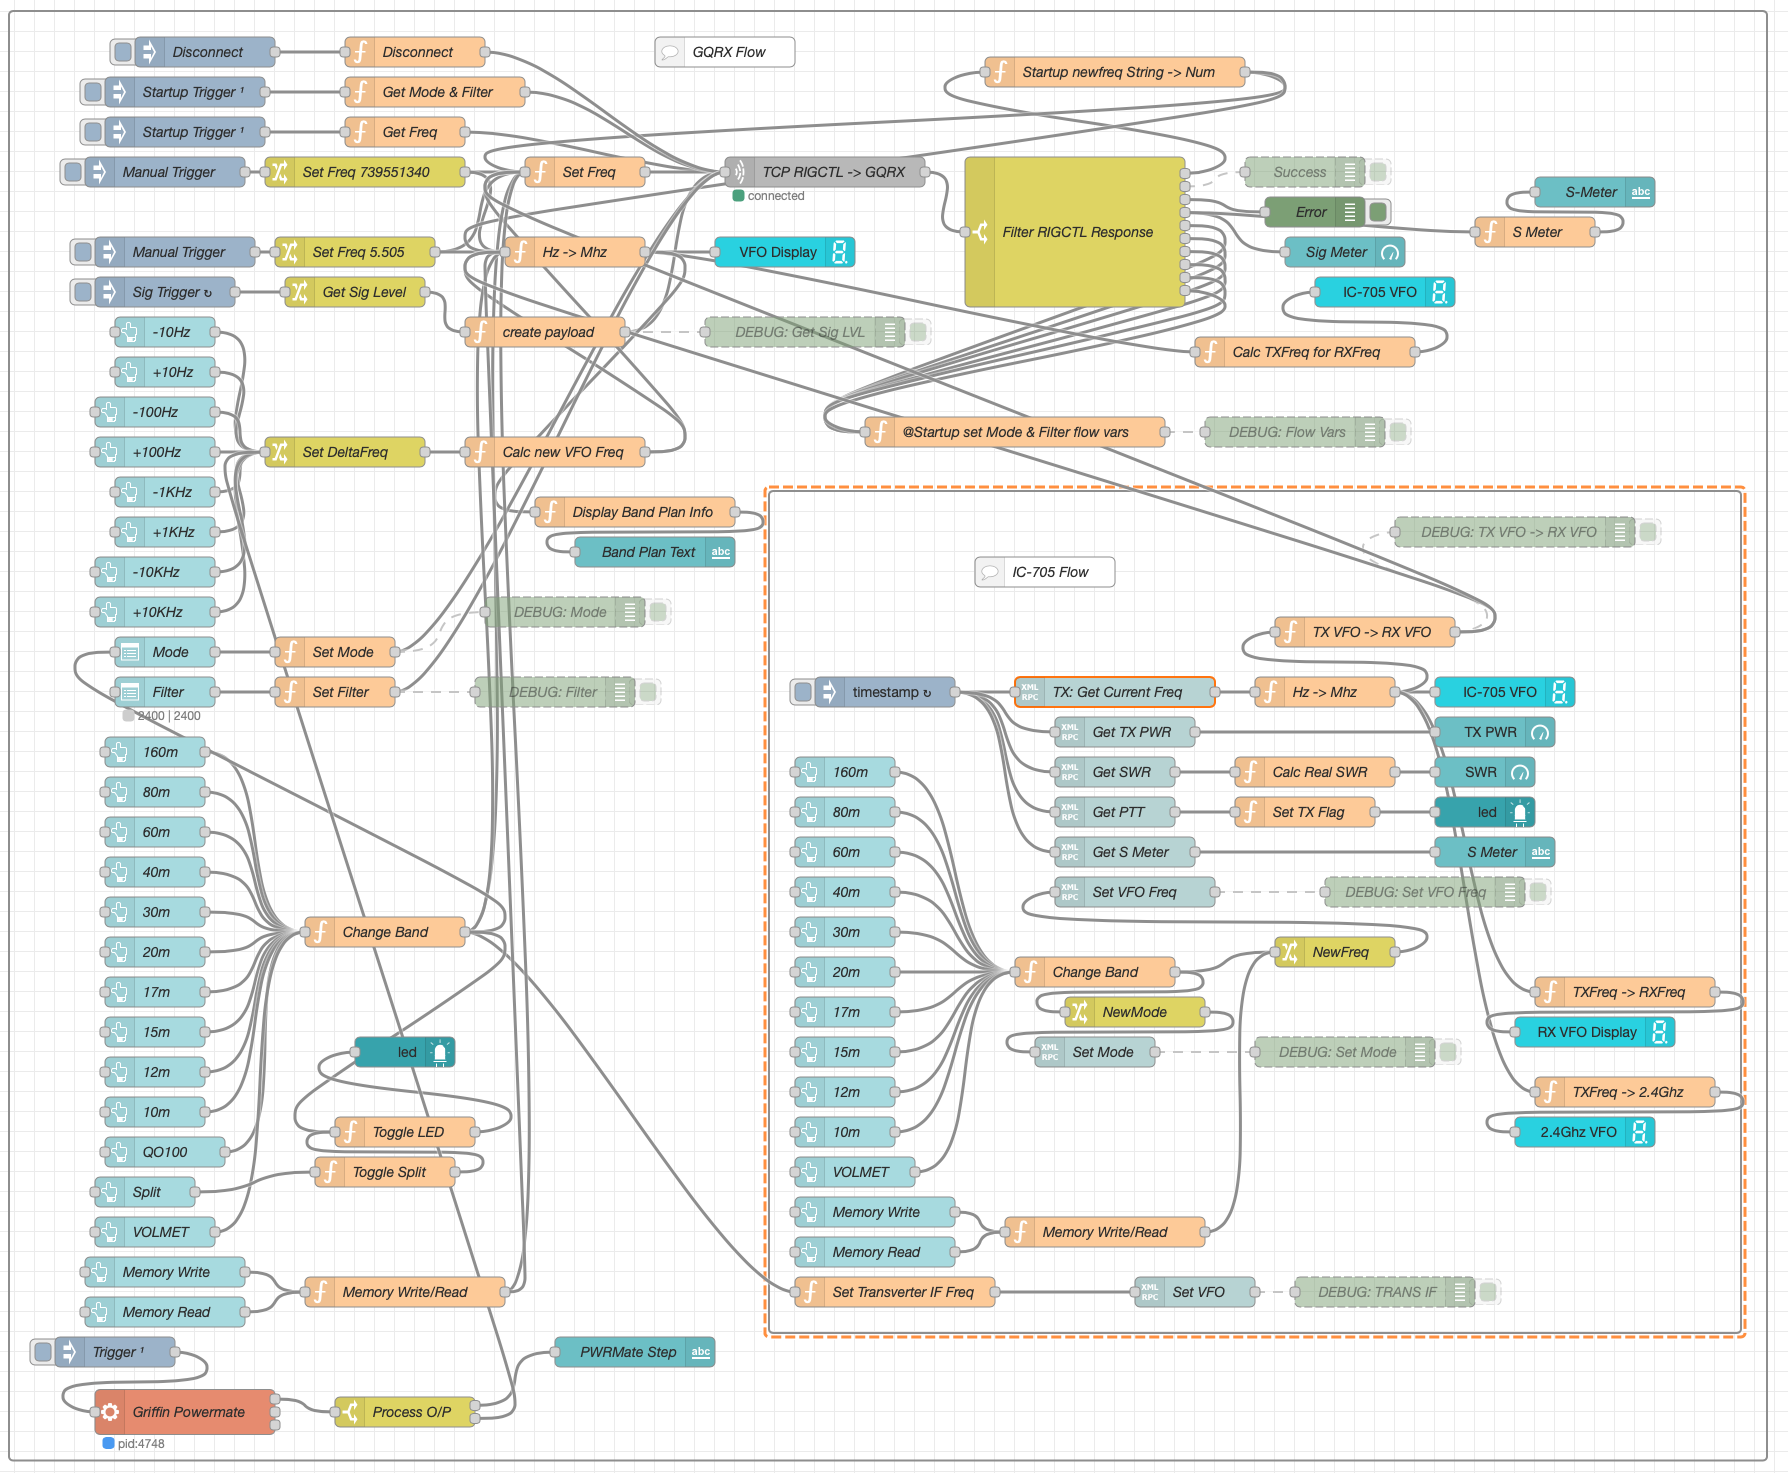
M0AWS QO-100 Node Red Dashboard Flow
The Node Red flow is looking a little busier with the addition of split mode and the Griffin Powermate USB VFO which has really enhanced the useability of the solution. It’s very impressive what can be achieved with Node Red with a little imagination. You really don’t need to be a heavy weight programmer to make things work.
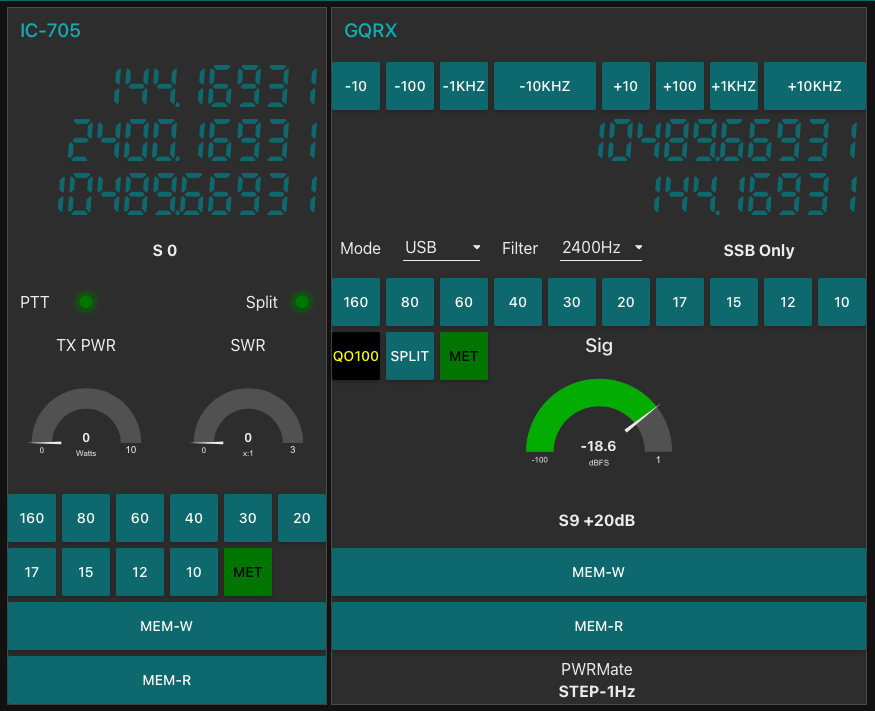
M0AWS QO-100 Node Red Dashboard as of 07/06/23
I also put together some code to calculate the S Meter reading from the dBFS data the GQRX SDR software generates. It’s not 100% accurate but, it’s close enough to be useful.
On the IC-705 side of the Dashboard I also now display the 2.4Ghz uplink frequency so that it’s available for logging.
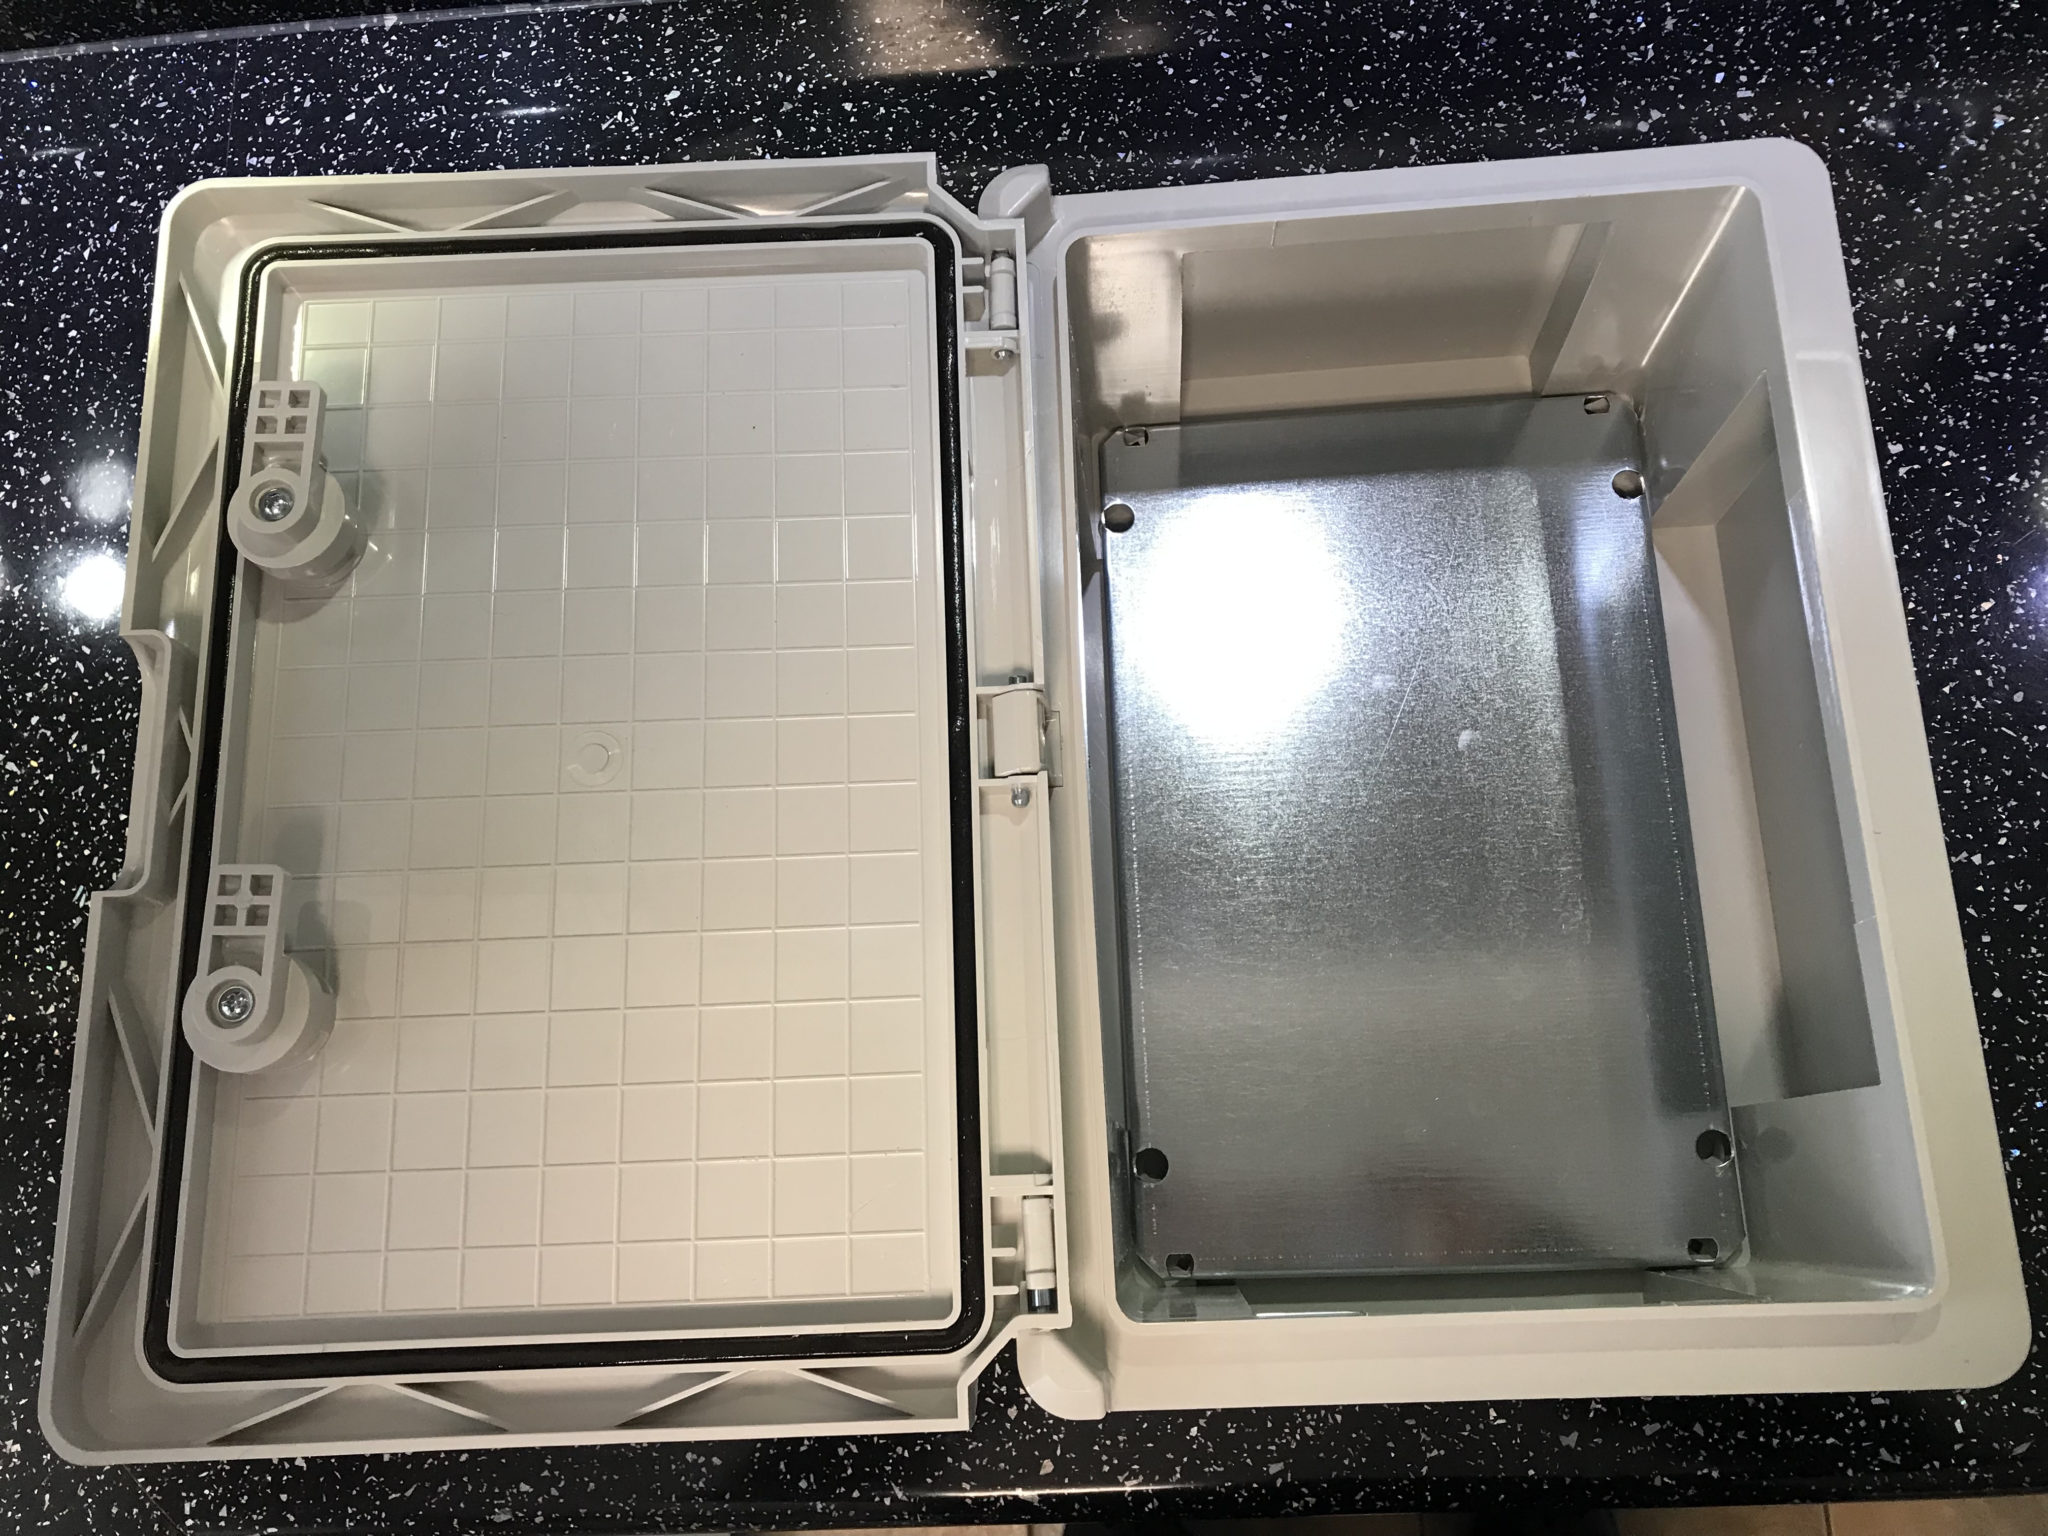
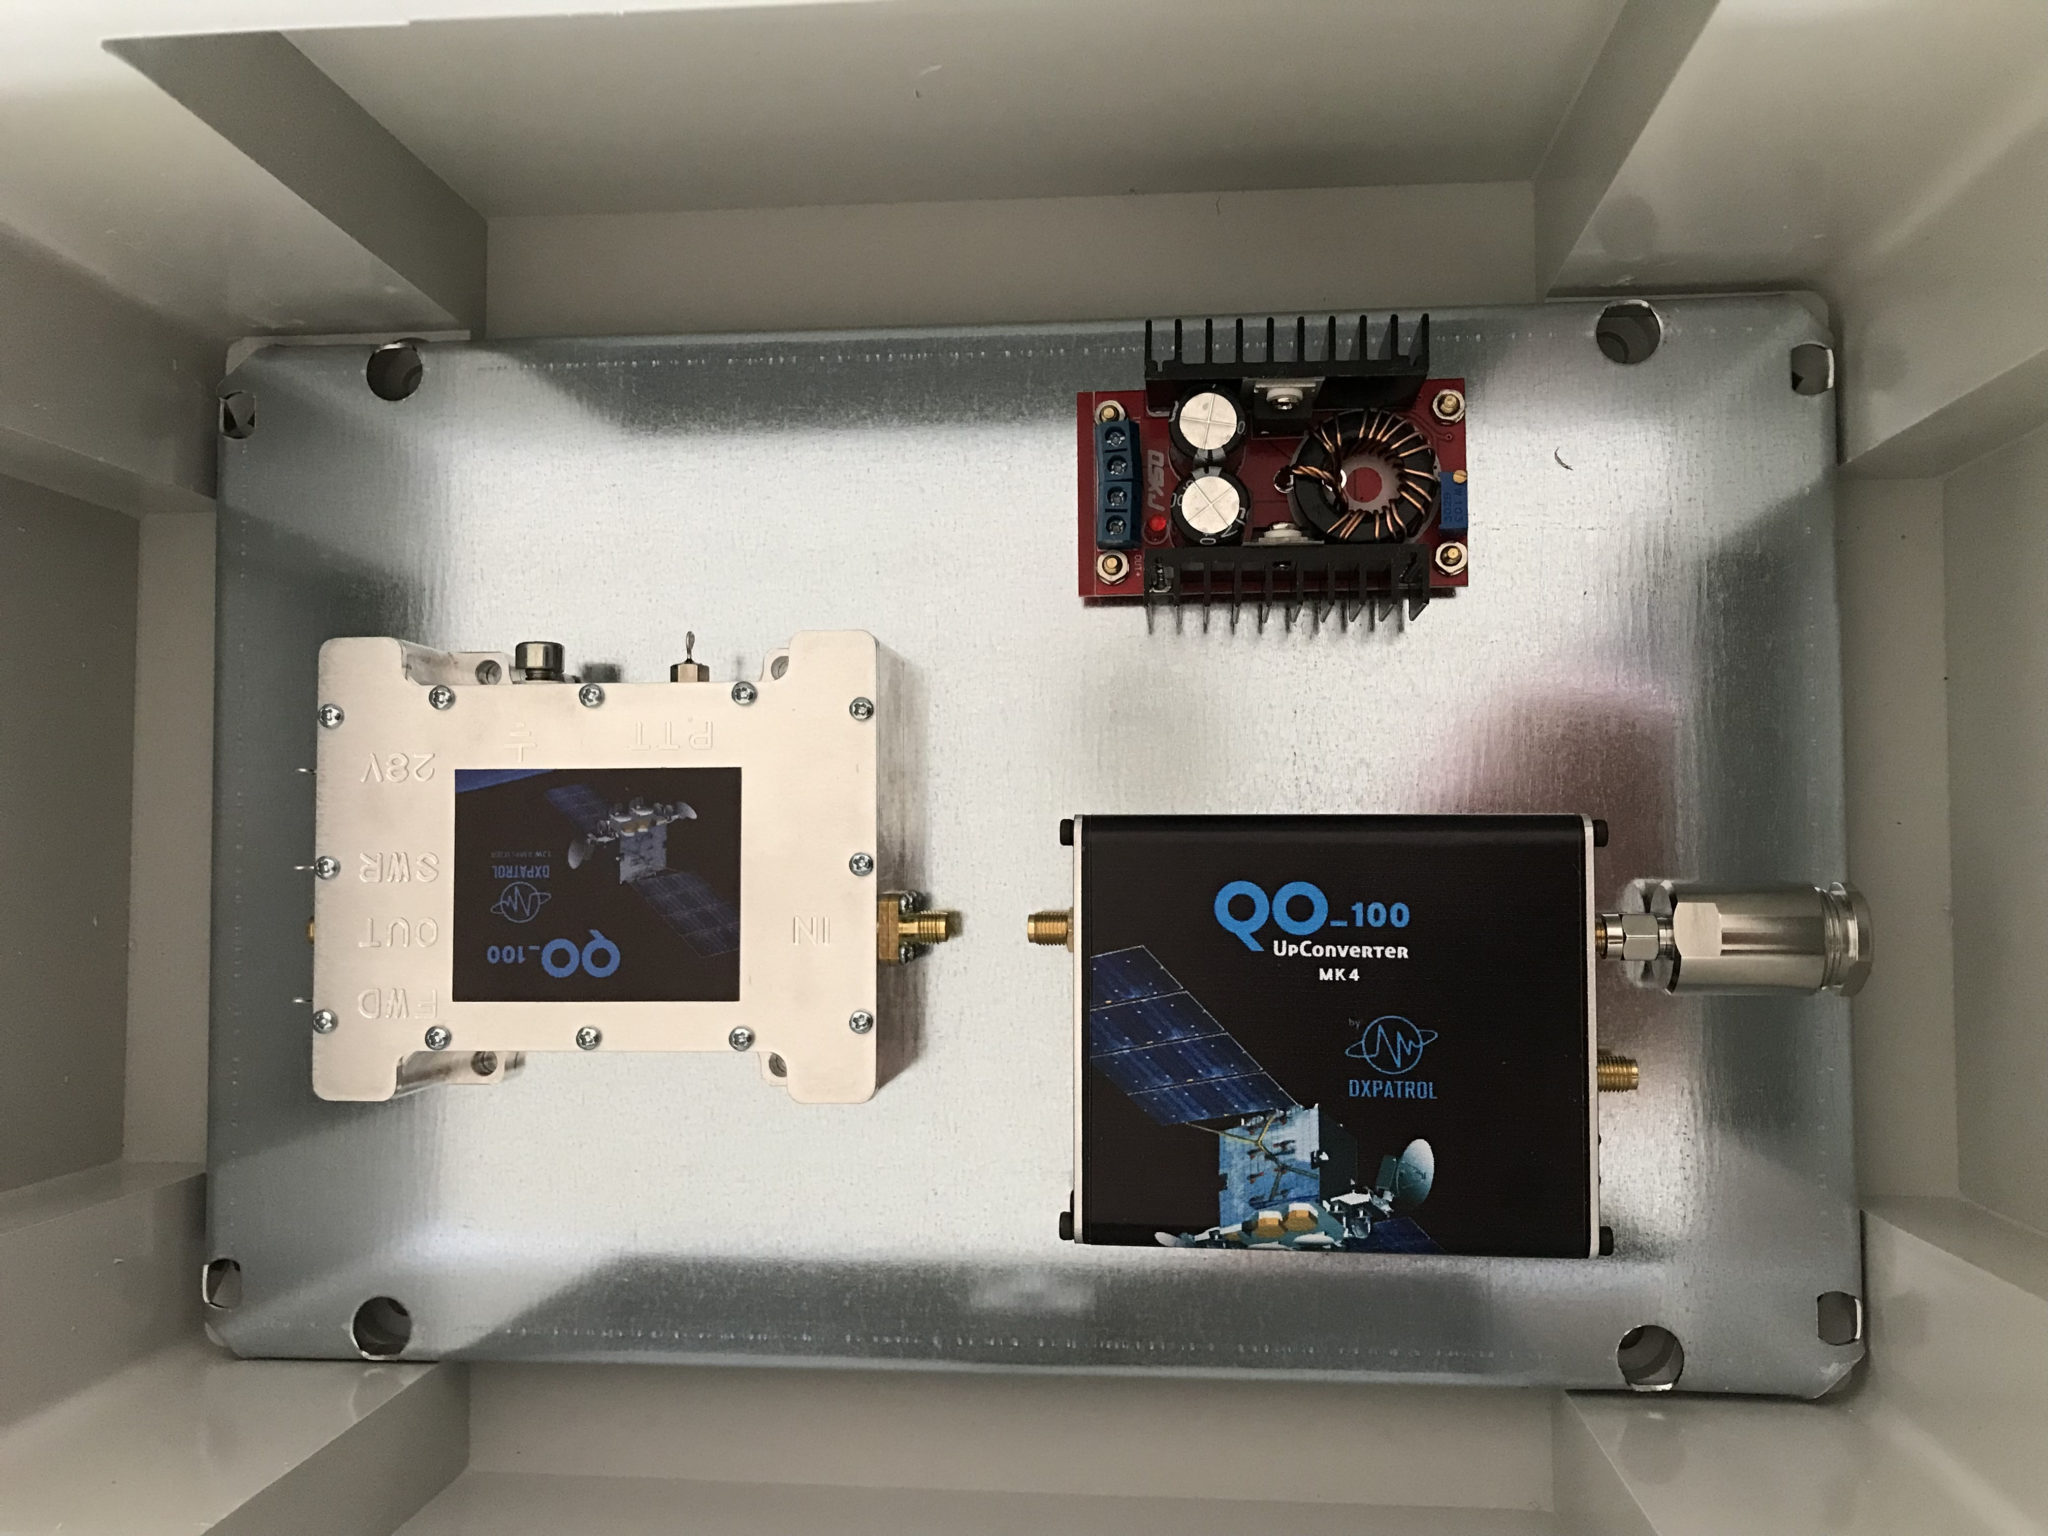
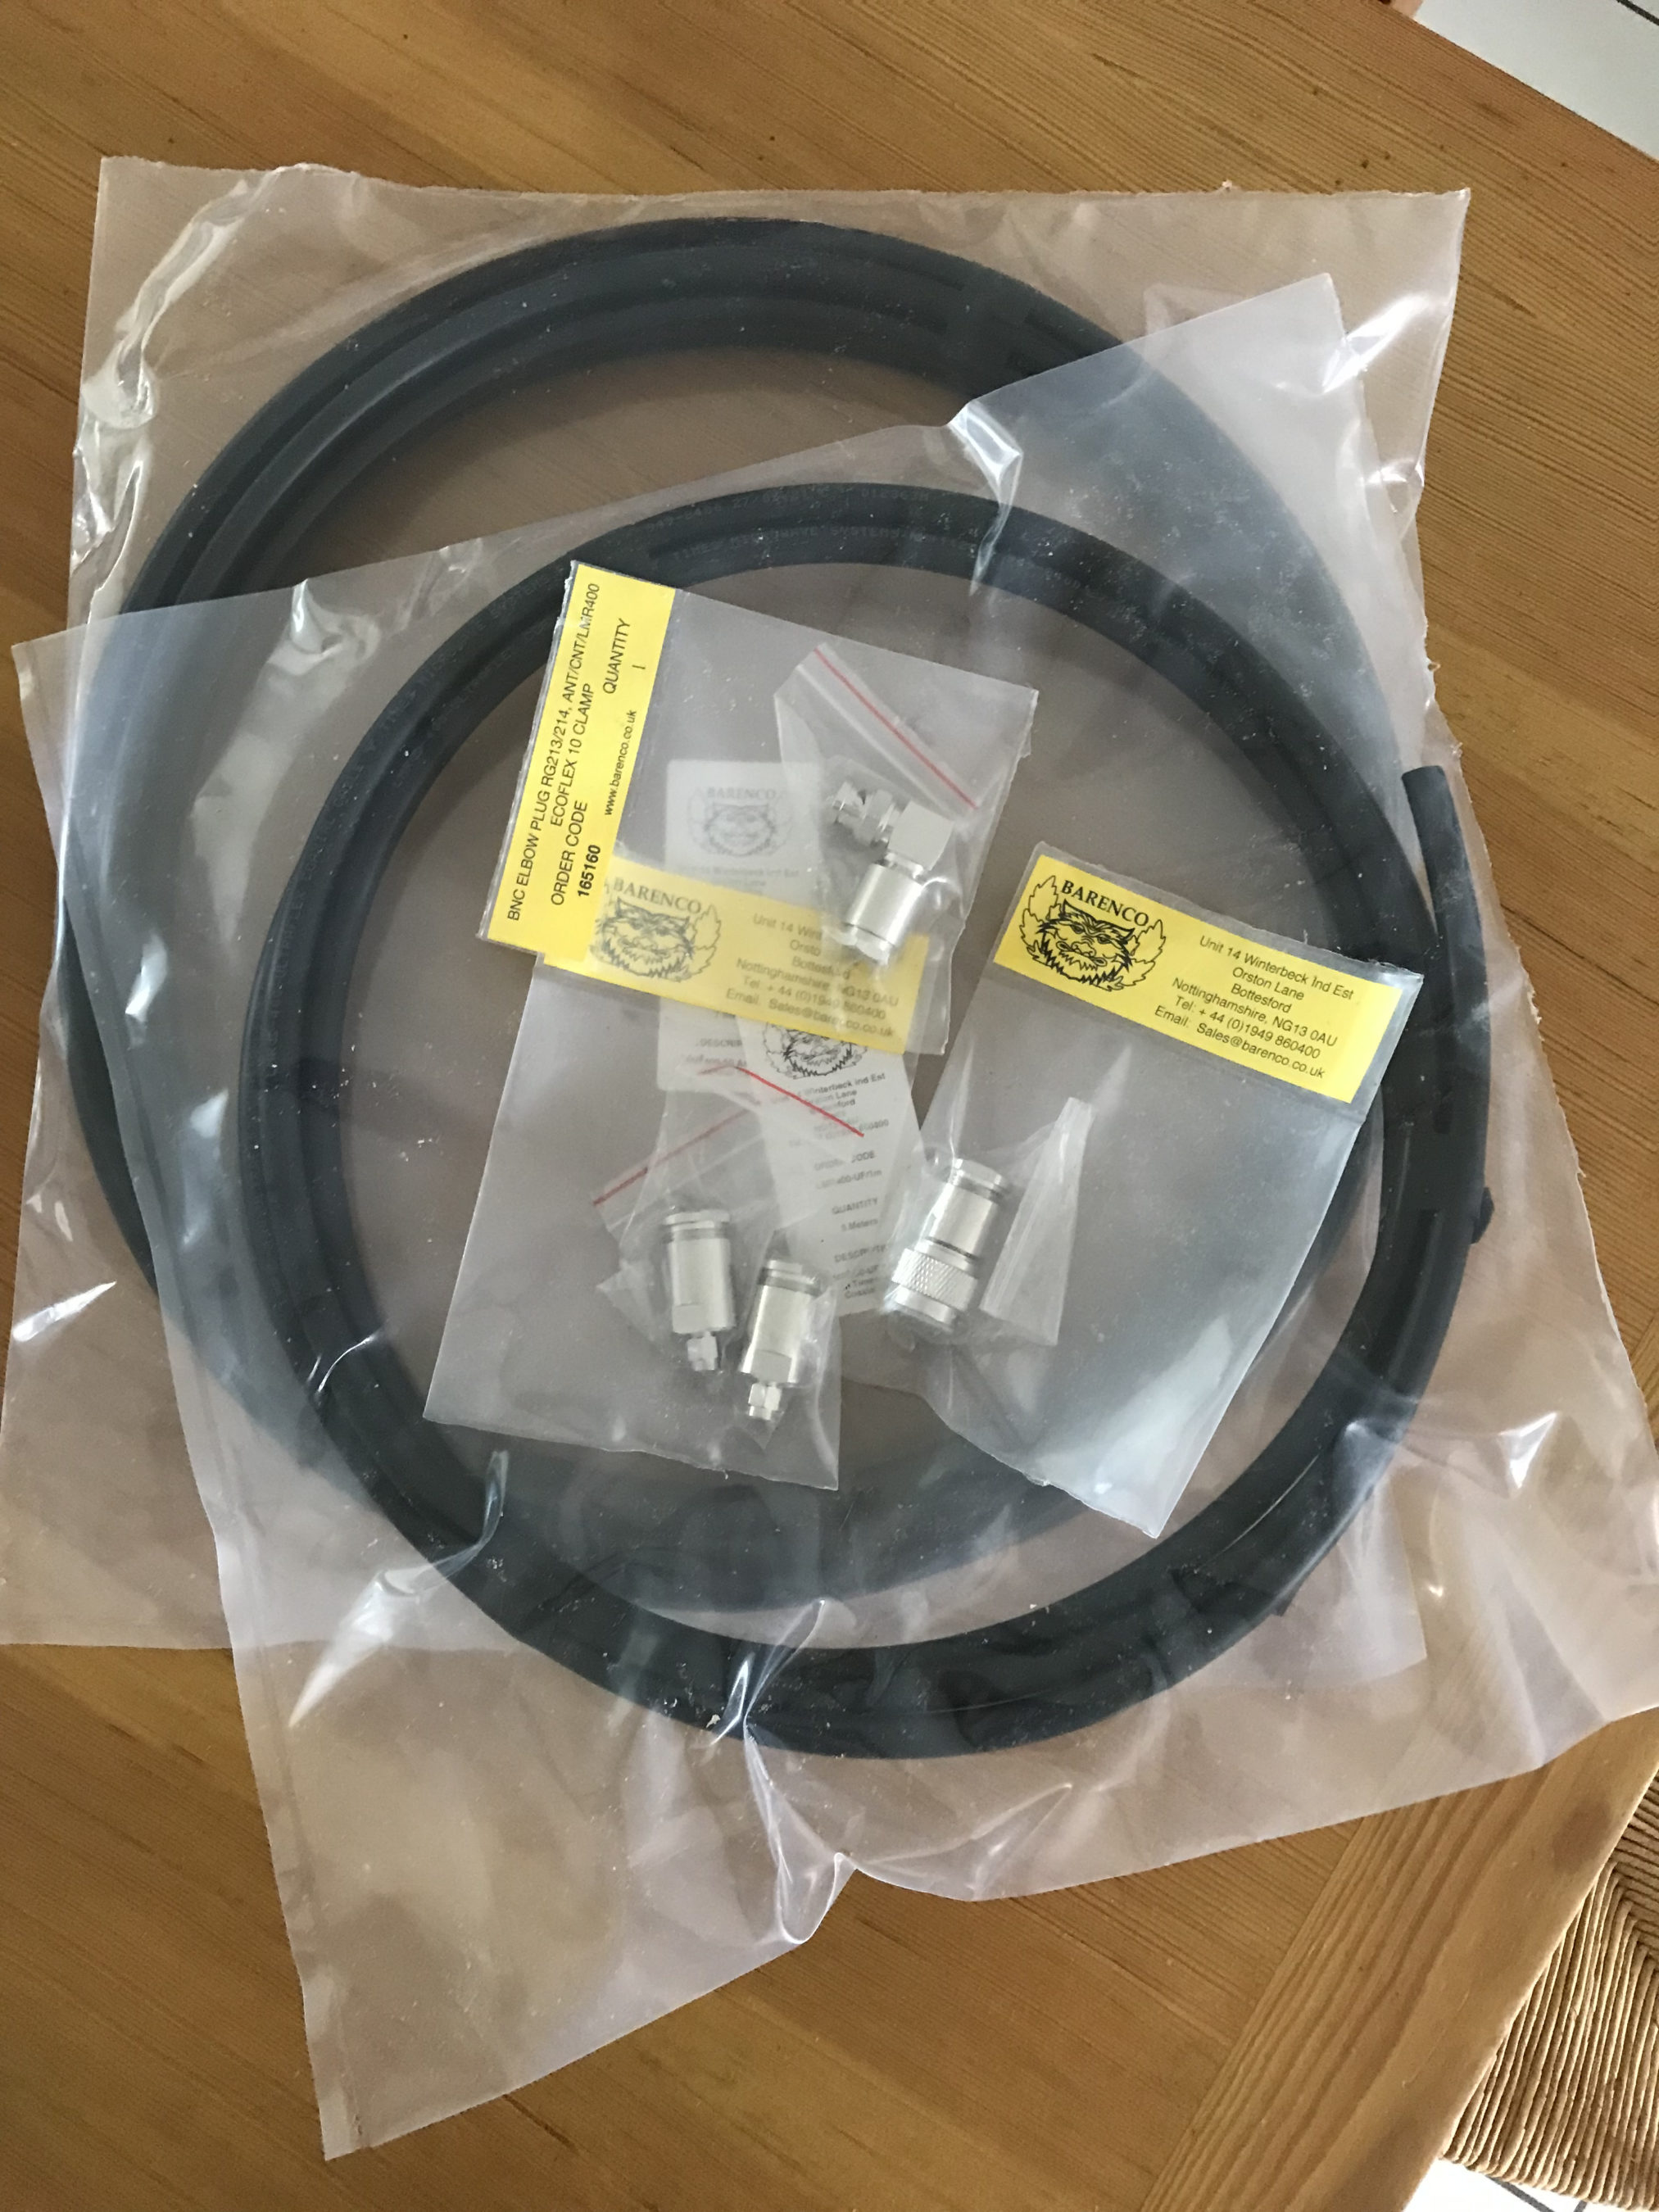
So with the QO-100 Dashboard ready to go live I have now started putting together the 2.4Ghz transmit path of the ground station. I have the 2.4Ghz transverter and matching 12w amplifier from DXPatrol, the IceCone Helix 2.4Ghz antenna from Nolle Engineering, some LMR-400-UF and connectors from Barenco and an appropriate water proof enclosure from Screwfix to fit all the kit into however, I’m now being held up by one simple little SMA male to SMA male connector that I need to connect the transverter and amp together.
M0AWS Waterproof enclosure from ScrewfixM0AWS Laying out the 2.4Ghz TX kit in the enclosureM0AWS LMR-400-UF coax from Barenco
The SMA connector has been ordered but, is taking a month of Sundays to arrive! Hopefully it’ll arrive soon and I’ll finally get on the QO-100 satellite and start enjoying the fun.
Over the years I’ve built many multi band vertical HF antennas including multi-element quarter wave verticals like the DXCommander configuration, multiple end fed vertical dipoles all on the same pole and a host of other configurations. As with all multi band antennas there’s always a compromise, on some bands it performs well and on others it doesn’t, it’s the nature of the beast.
For some time now I’ve been using a multi band vertical antenna that has over the last year performed incredibly well on all bands from 80m to 10m. Don’t get me wrong, it’s not perfect however, it has out performed every other multi band HF vertical I’ve tried to date even though it’s by far the simplest antenna design and according to the antenna modelling software I have it shouldn’t be as good as it is.
So what is this magical multi band HF vertical I speak of? Well it’s nothing more than a piece of wire 13.4m long taped up a 12.4m vertical Spiderpole with 1m of wire tucked down into the top of the Spiderpole.
Obviously this is not going to be resonant on any band without some sort of impedance matching circuit at the bottom of the wire. Originally this antenna was my end fed half wave vertical antenna for the 30m band that was fed via a 49:1 Unun. This antenna worked incredibly well on the 30m band allowing me to work DX globally with ease but, it was a single band antenna and I wanted a multi band solution.
I decided to remove the 49:1 Unun and replace it with a home brew LC circuit made up of a coil made from 5mm copper tubing and a large air spaced variable capacitor I had laying around from an old ATU project I built many moons ago.
This simple LC arrangement at the bottom of the wire worked incredibly well and tuned the wire from 80m to 10m with a perfect SWR on each band using nothing more than a ground rod and 4 x 12m radials. Performance was surprisingly good on all bands 80-10m giving me the ability to get some DX stations that I’ve never been able to hit before. The only drawback to this solution was the fact that I had to go out and manually tune the antenna every time I wanted to change band. Not so much of a problem in the summer but, in the winter in the pouring rain and howling wind it’s no fun at all. (I resolve this issue further down in the article!)
Multi Band Vertical HF Antenna using a 12.4m Heavy duty Spiderpole at the end of the garden
Performance on the HF bands is incredibly impressive with this antenna. Modelling it on EzNEC software it shouldn’t be that great on bands above 20m however, it seems to defy the modelling software as it performs amazingly well on 17m, 15m and 12m, better than any other vertical antenna I’ve made for those bands. How this can be I do not know, normally my antenna builds match closely what the modelling software shows but, in this instance it doesn’t and I’ve really no idea why.
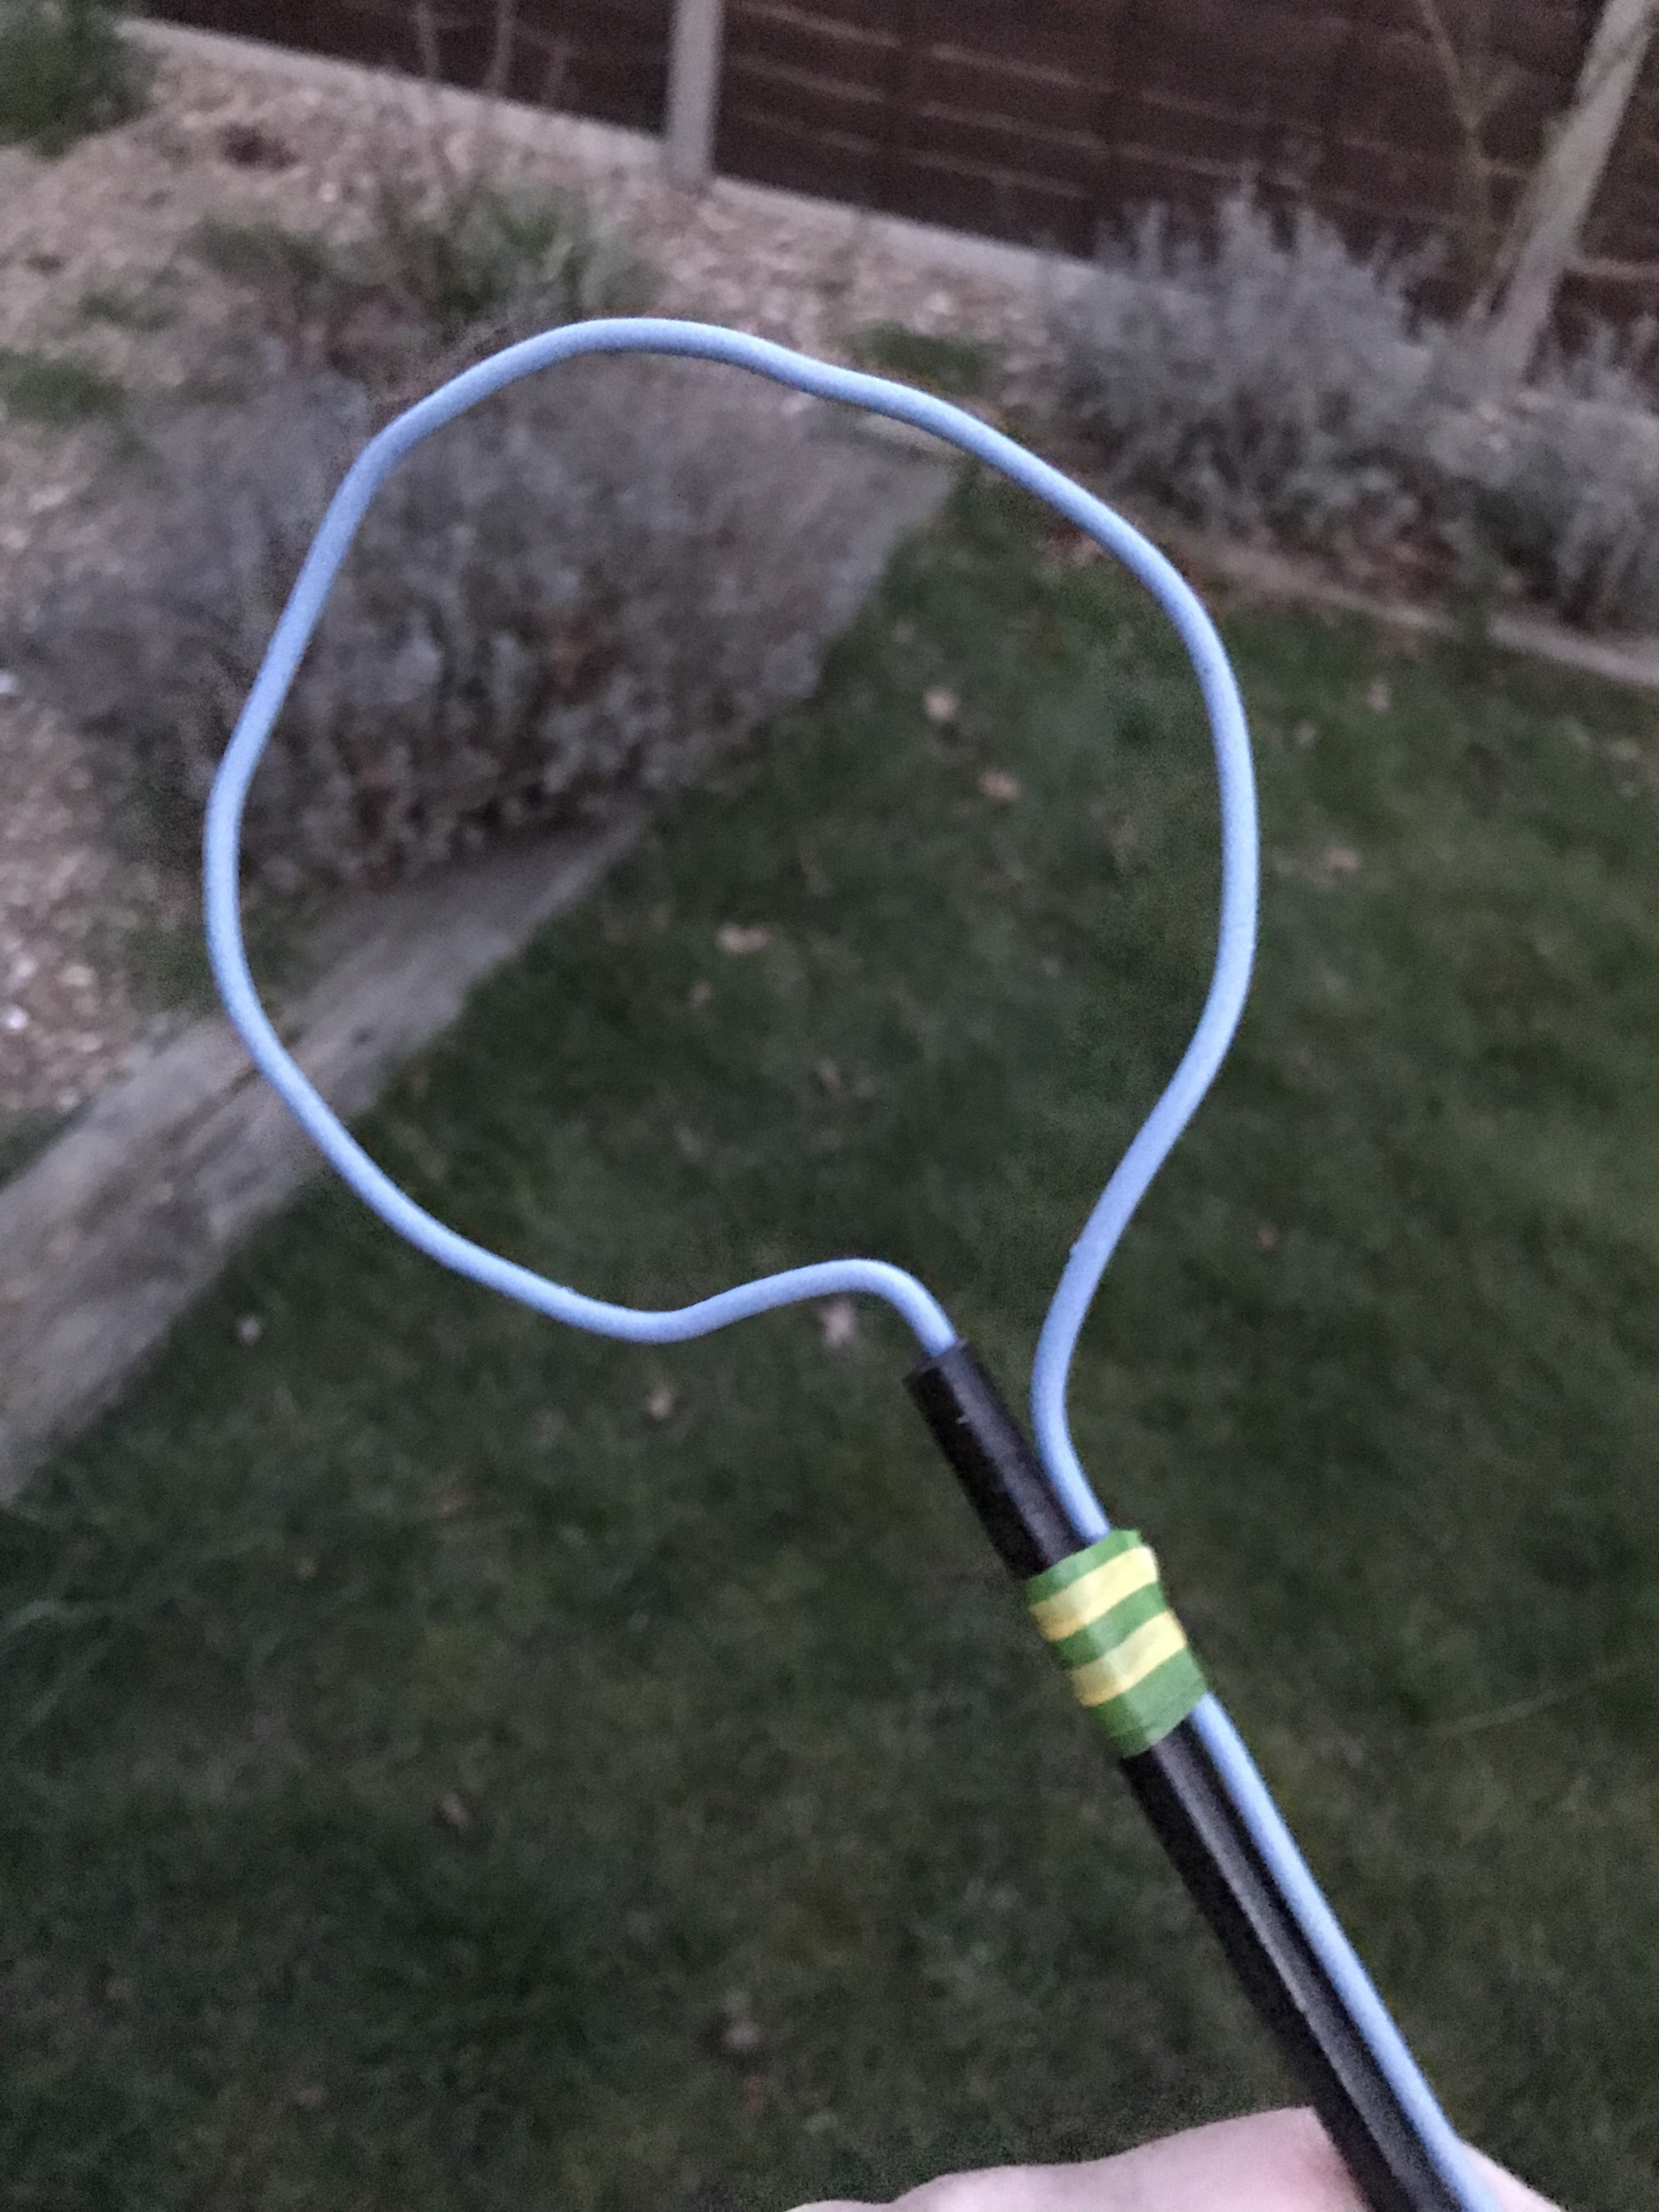
Multi Band Vertical HF Antenna showing loop at top and wire tucked down into pole
Always wanting to put things into perspective here’s some details of the contacts I’ve made on each band showing how well this antenna has performed over the last year or so.
Firstly the 80m band, I’ve not used this band much over the winter months as I’ve got into the higher bands however, the map below shows all the stations worked on 80m using this antenna.
Stations worked on the 80m band from the M0AWS QTH
There are 51 contacts in total, not a big number by any means however, there are some good distances made with contacts into North America, South America and Indonesia. I’m sure I could had done better if I’d spent more time on this band, something to aim for next winter perhaps.
Next is the 60m band, a band I really like and have enjoyed over the winter months. The antenna performs incredibly well on this band even though we have very limited access to 60m here in the UK. With 288 contacts in the log with a good spread of distances I’m really pleased with how this antenna performs on this band.
Stations worked on the 60m band from the M0AWS QTH
Moving up in frequency the 40m band is the next one on the list, this is a great band and one that I’ve loved for many years. I’ve spent countless hours on CW on this band in the past and worked some great DX. The performance of this antenna on the 40m band is excellent, if I can hear the DX normally I can work them regardless of where in the world they are located. With 226 contacts in the log spread globally over the winter here in the northern hemisphere I have no complaints about performance of this antenna on the 40m band.
Stations worked on the 40m band from the M0AWS QTH
Moving up onto the 30m band I have to admit this is probably my favourite band of all. I’ve spent so many hours on CW working some of the best fists I have ever heard on the air I’ve grown to love this band not just for the DX available but, for the quality of operator found on this narrow piece of the RF spectrum. Needless to say since the antenna is a half wave on the 30m band performance is stunning, out performing any other 30m band antenna I have ever made. It’s even better than the 30m Delta Loop antenna that I built and used when I lived in France.
With 467 contacts in the log on the 30m band you can tell this is my goto band and one that offers access to some of the best DX in the world.
Stations worked on the 30m band from the M0AWS QTH
The 20m band is a band that I never really used until I moved back to the UK from France. Living in France I had acres of land and so I was very much into the low bands, 160m to 30m and never ventured above this part of the spectrum. Now living back in the U.K. with a typical U.K. sized garden the low bands are much more difficult to get onto and so my interests have moved up in frequency somewhat.
Getting onto the 20m band I was amazed at how easy it is to work DX stations compared to the low bands, it’s simply a case of if you can hear them you can work them, there’s no real challenge to be honest. Because of this the band is always super busy with people shouting over the top of each other to get the DX. Not to be put off, I’ve made a surprising 412 contacts on 20m covering the globe. This antenna works incredibly well on this band and you really don’t need anything else to work DX on 20m.
Stations worked on the 20m band from the M0AWS QTH
Next is the 17m band, one of the WARC bands that I’ve never really ventured onto until now. I have to admit I really like this band, when it’s open it’s normally open to the world all at the same time. With an almost undetectable background noise level you can hear the faintest of signal on this band. This is one of the bands that according to the EzNEC modelling software this antenna shouldn’t be any good on but, I have to say that it’s performance is beyond anything I ever imagined. I’ve worked my longest distance yet on this band and with this antenna, ZL4AS at 11776 miles, a distance I haven’t achieved yet on any other band. The 17m band really is a great band, I’d actually say it’s better than the 20m band even though there is considerably less spectrum available. With 220 contacts in the log it’s been a fun band to use.
Stations worked on the 17m band from the M0AWS QTH
Continuing the theme of the WARC bands, the 15m band is another one that I’ve only discovered in the last 12 months. It’s only now that I realise what I’ve missed out on due to my addiction to the low bands for so many years.
I’ve only made 76 contacts on the 15m band, not a lot at all really. This is mainly due to the fact that I get easily side tracked by the 17m and 30m bands most of the time and the radio VFO never gets as far as 21Mhz. Performance of the antenna is good on 15m, I would say not as good as on the 17m band but, it’s no slouch by any means.
As you can see on the map below, I may of only made 76 contacts on the 15m band but, they are spread right across the world proving that this antenna’s DX-ability on 21Mhz really is rather good.
Stations worked on the 15m band from the M0AWS QTH
Finally we arrive at the top of the WARC bands, the little 12m band. Once again this band is very much like the 17m band, super low background noise level, when it’s open you can work huge distances with very little power but, often there is quite deep QSB that can make getting that elusive DX a bit more challenging.
With only 66 contacts in the log once again I’ve not spent a huge amount of time on this band but, it hasn’t disappointed. With global coverage from this antenna on 12m once again I am astounded at how well it works. With software modelling saying it should be terrible on 24.9Mhz with nothing but super high angle radiation, it really shouldn’t be a good antenna for DXing on this upper WARC band but, it is and I have no idea as to why!
Stations worked on the 12m band from the M0AWS QTH
Finally we arrive at the 10m band, another band that I have never got into even though many refer to it as the magic band. This is the band that I’ve made the fewest contacts on, not because the antenna doesn’t work at the dizzy heights of 28Mhz but, because I hardly ever get the VFO dial past the lower bands due to the level of DX available. I really should make more effort to get the best out of the 10m band, especially now the summer is coming.
With a measly 19 contacts in the log I should be ashamed of myself for not doing more on this band as it is very often open and busy with traffic. Since I’ve not really used the antenna that much on the 10m band it’s hard to say how well it performs however, I have had contacts into North and South America and so it shows potential.
Stations worked on the 10m band from the M0AWS QTH
As you can see, the performance of this antenna is self evident from the log entries, it works superbly even though the modelling software says it shouldn’t above 14Mhz. This is now my main antenna here in the U.K. and I’ve only made one change to the initial setup and that is to add a CG3000 remote auto ATU to replace the home-brew LC tuning circuit.
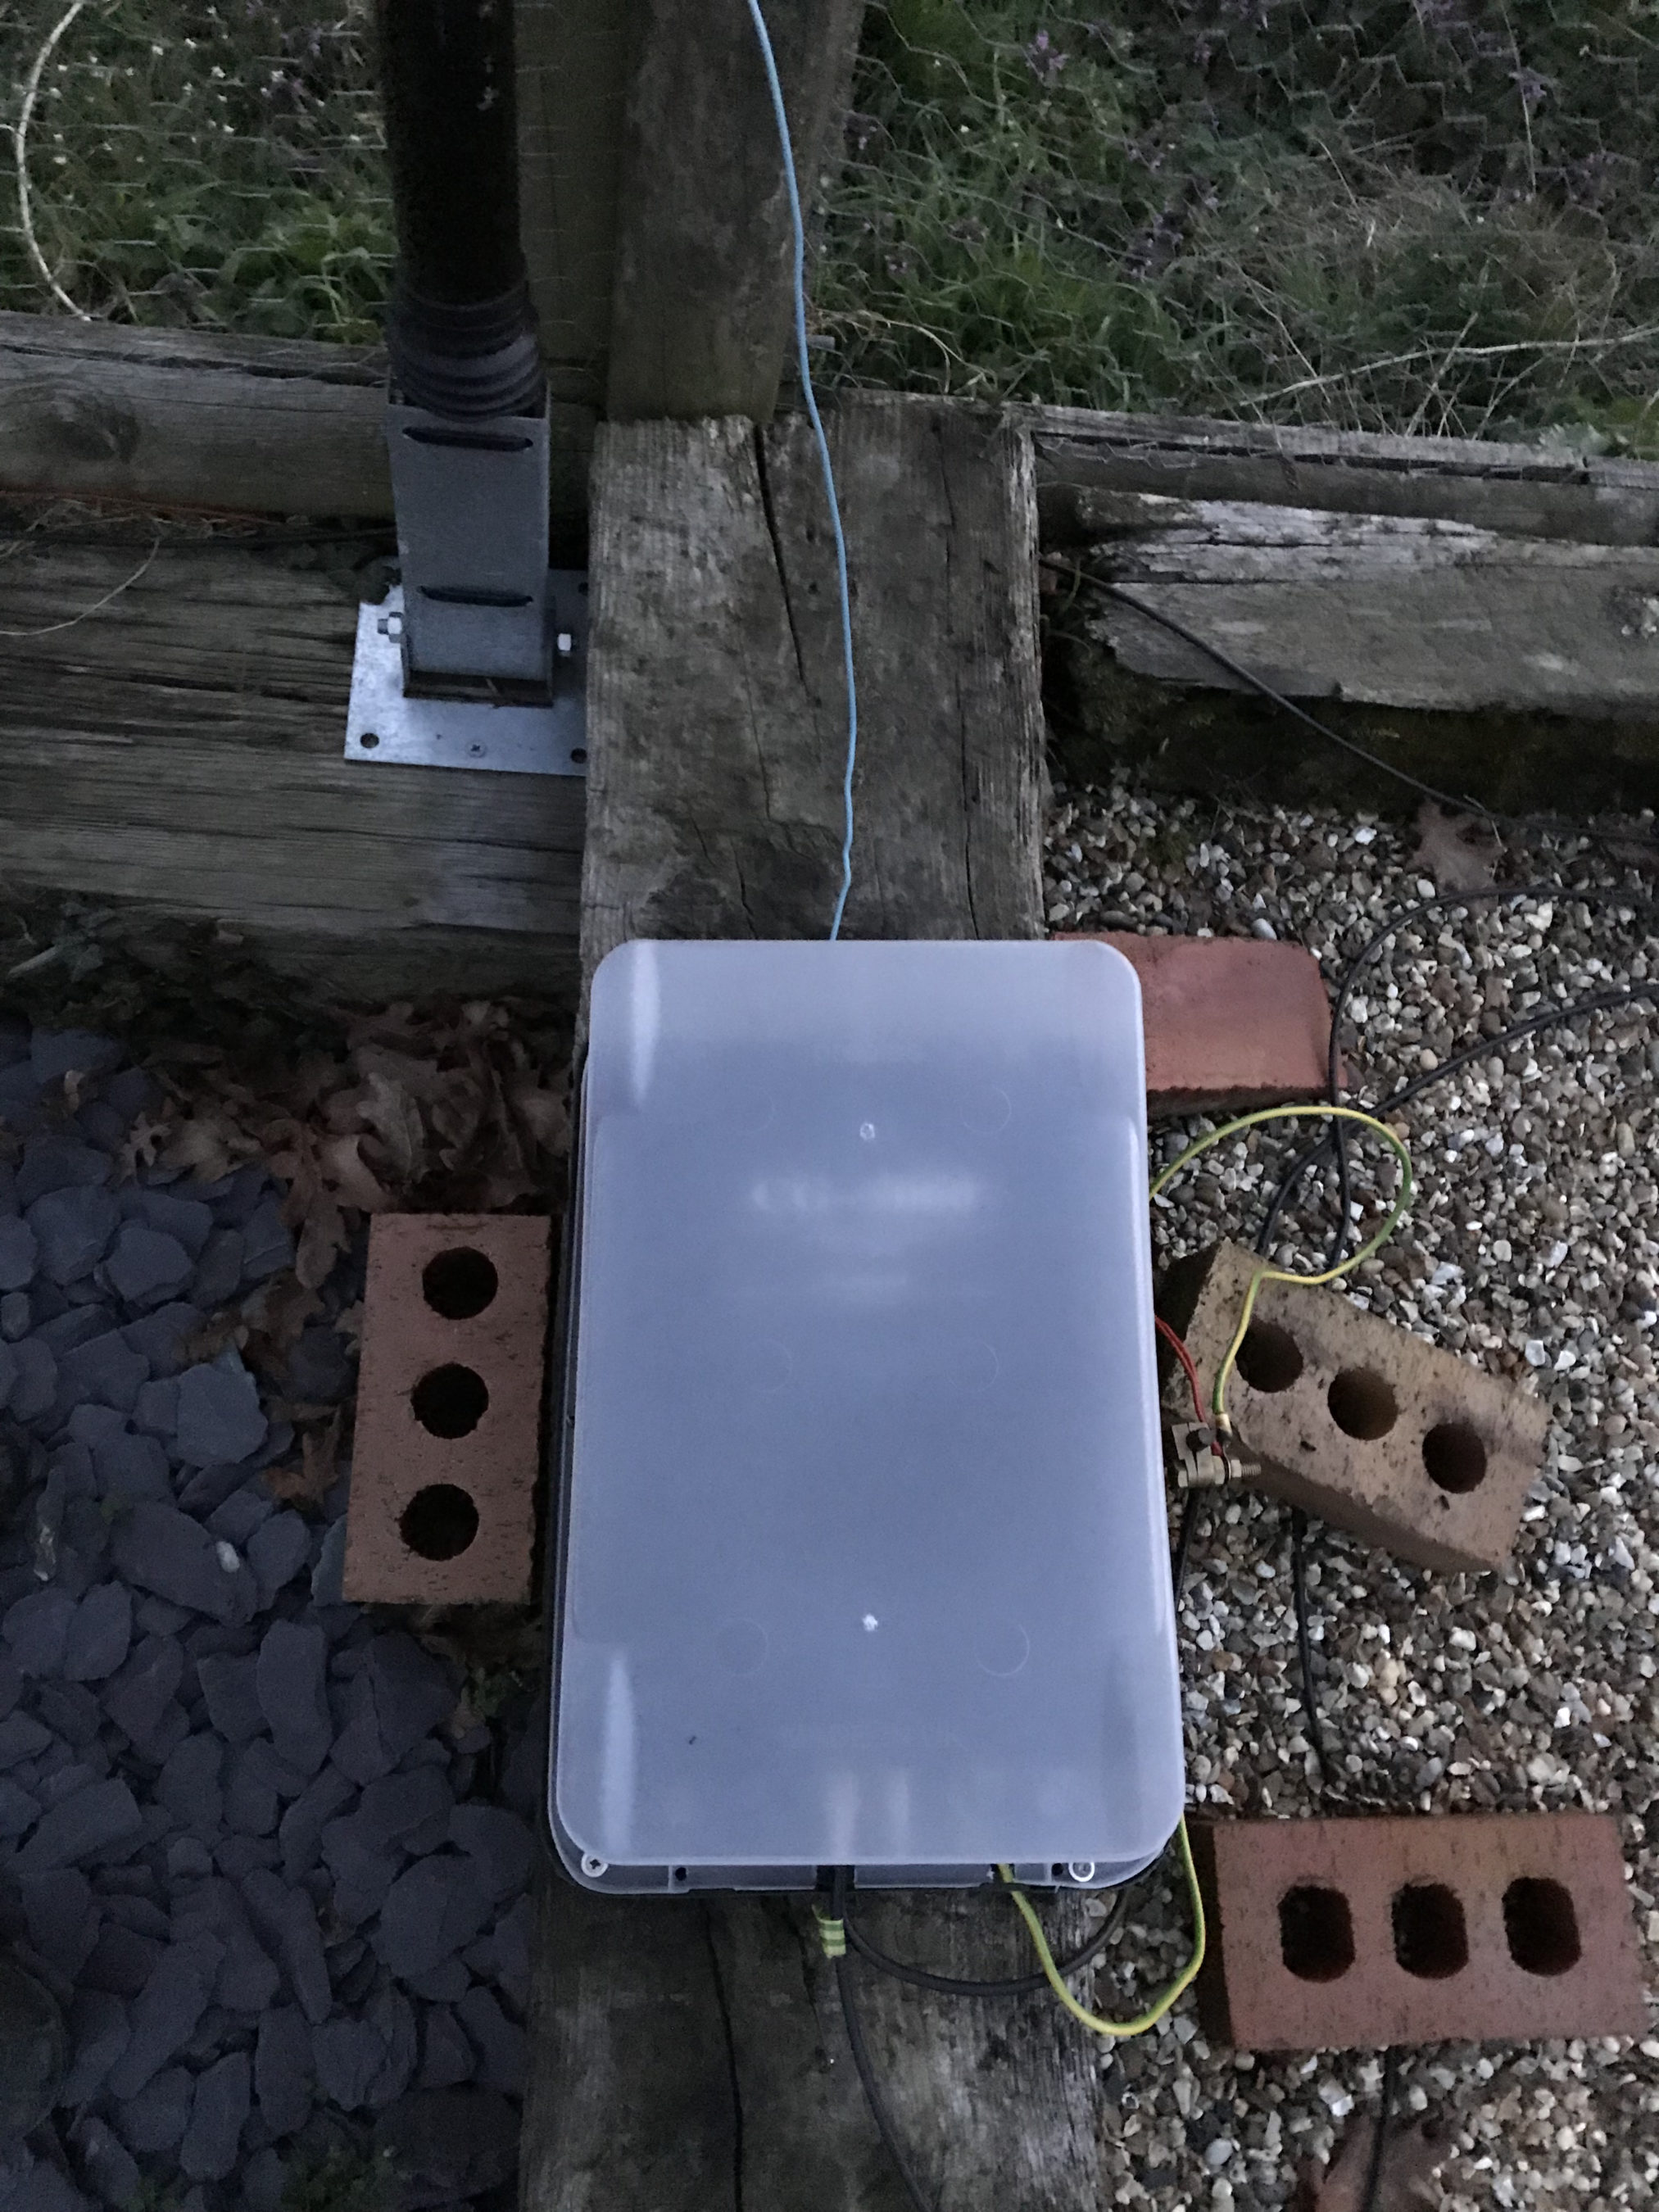
CG3000 Remote Auto ATU housed in a plastic box
With the CG3000 auto ATU in place I no longer have to venture out into the cold, wet garden in the winter months to change band, it’s just a case of sending a continuous 10w signal into it and leaving it to tune in less than 2 seconds. The CG3000 is a Pi Network ATU so it handles both high and low impedance loads with ease. A Pi Network ATU is one of the best you can have, I’ve made my own in the past and had excellent results.
So in summary, 13.4m of wire vertically up a 12.4m pole with 4 x 12m radials, a ground rod and a CG3000 Auto ATU will give any HAM station the ability to work DX on all bands from 80m to 10m without ever having to leave the shack to tune it.
Since I got the CG3000 off of Ebay for a bargain £170 and the 12m heavy duty Spiderpole for under £100 the total cost of the antenna is considerably less than many commercial offerings available and yet performs as well if not better.
If you want to get this antenna onto the 160m band then you just need to add a small coil into the mix at the bottom of the wire to increase the inductance in circuit. The CG3000 will then happily tune the entire 160m band. It’s best to remove this coil though for all the other bands otherwise performance is reduced.
Please be aware that the performance of this antenna will not be anywhere near as good if you use the ATU in your radio at the end of a coax run. This is because the coax becomes part of the antenna and the radiation pattern is all but destroyed. You will be extremely disappointed if you use the antenna in this fashion. The ATU must be at the end of the wire and connected directly to ground and the radials to get the performance that I have experienced.
Finally, if you have an Icom IC-705 and AH-705 remote auto ATU you can use the AH-705 ATU in place of the CG3000, you will get the same results as I have with the CG3000.
I have used my AH-705/IC-705 combo quite a few times with this antenna with excellent results although, the big antenna can sometimes result in the receiver of the IC-705 getting overloaded especially on the lower bands. This is easily resolved by reducing the RF Gain on the radio.
Following on from my other Node Red exploits I’ve put together a flow that creates an interactive map of contacts that is generated from the WSJT-X ADI log file.
The flow is fairly straight forward and self explanatory so I won’t go into detail here but, will make a copy of the flow available for download at the end of this article.
Node Red Flow for processing the WSJT-X ADI Log file
The flow is incredibly quick at generating the map with all the pins on it, one for each station worked. The pins are colour coded, blue for FT8 and green for FT4. If you want to add other modes then just create a new colour entry in the Dynamic Icon Colour function.
The resultant map is fully interactive with each pin being clickable showing the QSO information in a tiny popup.
Node Red map generated from the WSJT-X ADI Log file
You can download the flow and try it yourself using the link below.
We use cookies to ensure that we give you the best experience on our website. If you continue to use this site we will assume that you are happy with it.