Venturing into the world of AllStarLink

We’ve recently added a new room to the Matrix HAM Radio Space for Digital Voice modes as this was an area of interest that didn’t really fit into any of the other rooms.

The new Digital Voice room has attracted a lot of attention from members, with a lot of the focus being on the AllStarLink system. Michael, DK1MI built an AllStarLink node in the cloud for us all to use for Matrix Nets and so I decided I had to get in on the fun.

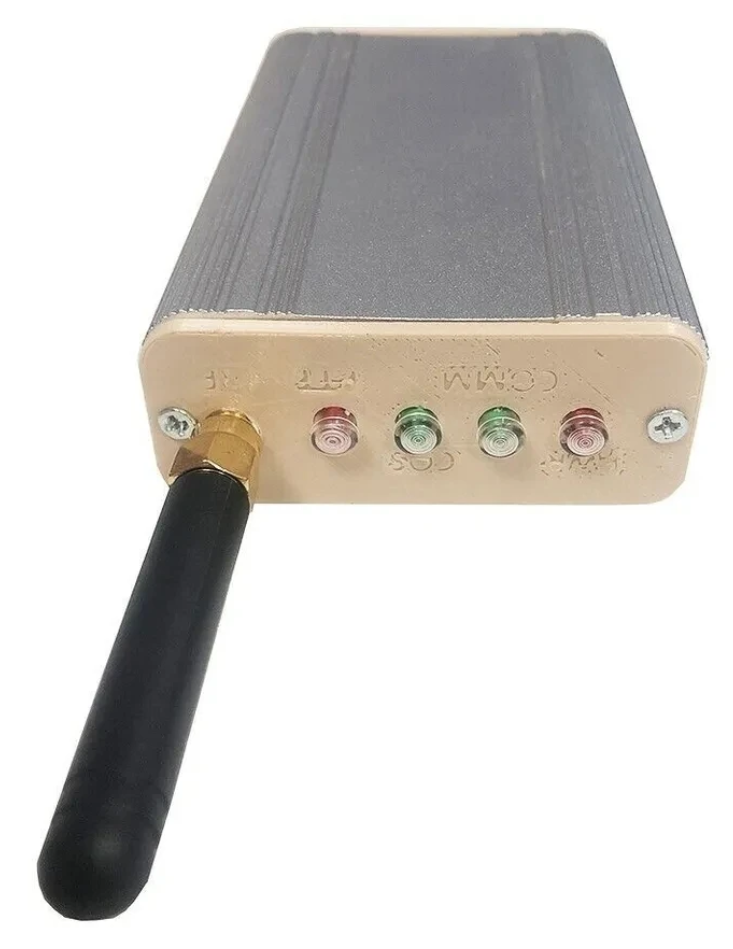
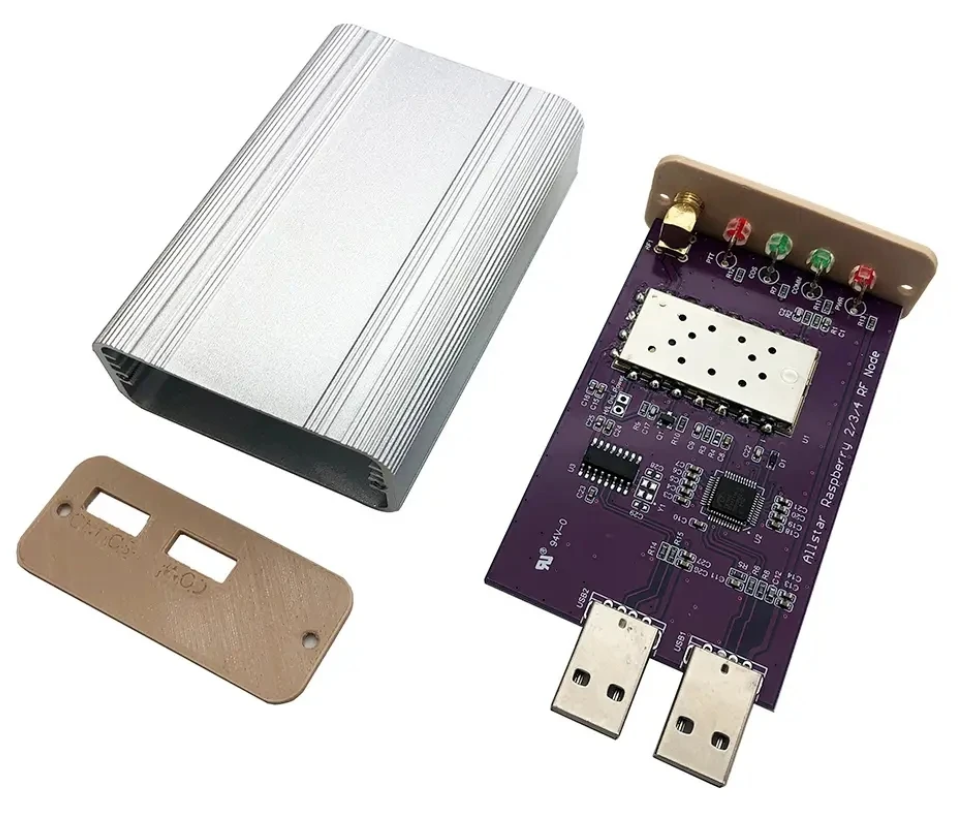
The Jumbospot SHARI SA818 Amateur Radio AllStarLink Radio Interface was originally designed by N8AR and implements a RaspberryPi 2/3/4 hosted AllStarLink node using a NiceRF SA818 embedded VHF/UHF radio module and sound card.

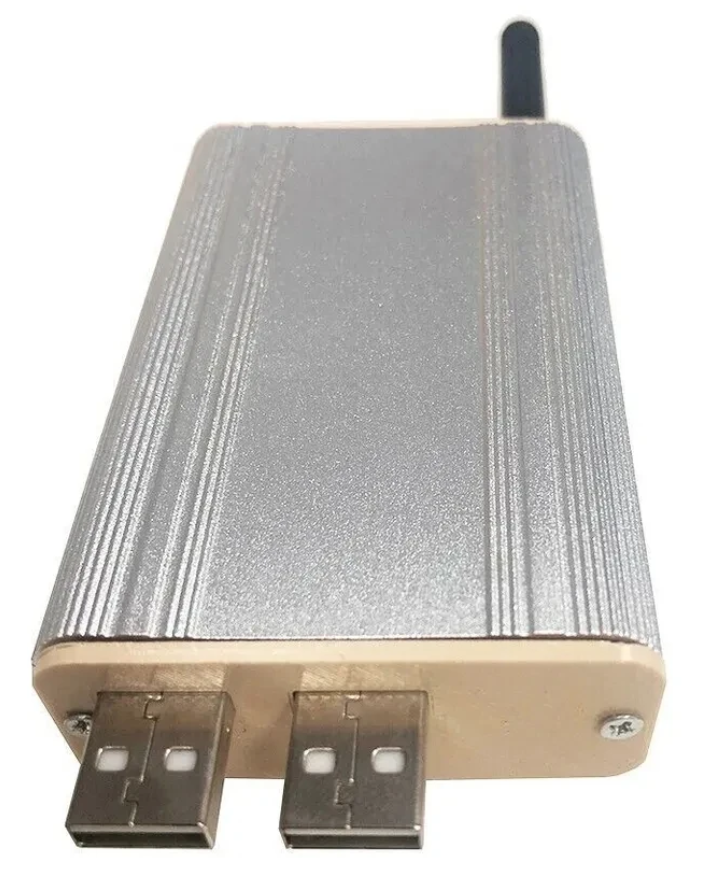
The two USB connectors on the SHARI device are position such that they plug into two of the available 4 USB ports on the RaspberryPi without the need for cables. This keeps the whole solution together in one neat package.

Before you start you will need to obtain a node number and secret (password) from the AllStarLink Portal. To get this you will need to provide proof to the AllStarLink administrators that you are a licensed Amateur Radio (HAM) operator. This is done by uploading a copy of the first page of your HAM licence to the website for the admin team to check. This can take 24hrs to be completed so make sure you get this all done before trying to build your node. You cannot build a node successfully without a node number and secret.

Of course you will also need a transceiver that can operate on the 438.800Mhz frequency or other frequency of your choice on the 2m or 70cm HAM band.

You will also need to open port 4569 on your internet router and setup port forwarding to the IP Address that you will be using on your RaspberryPi node. It’s important to use a static IP Address on your RaspberryPi.

There are quite a few different Linux based operating system (O/S) images that are available for the RaspberryPi devices that have been specifically tailored for the AllStarLink node and include all the necessary software and library packages out the box.

I decided to use the Raspbian GNU/Linux 10 (buster) based distribution as it is based on the very stable and reliable Debian Linux distro. You can download the exact version I am using from the Raspbian link above or directly from my website here.

Once downloaded you need to burn the ISO image onto a suitable SD card for your RaspberryPi. I use BalenaEtcher as it’s extremely quick and reliable at burning ISO images to SD cards.

Of course if you are a hardline Linux command line junkie you can always use dd to create the SD card.

Once you’ve got your O/S onto your SD card, slot it into your RaspberryPi making sure your SHARI device is connected to the two USB ports and then power it up. Make sure you have a good PSU for the RaspberryPi as the two devices together draw around 3A of current during the transmit cycle. (I use a 3.6A PSU from Amazon).

The default login for the Raspbian O/S is shown below. Login via SSH and configure your RaspberryPi for your local network. It’s important to use a static IP Address configured either directly on the RaspberryPi or via DHCP in your router.

Login: repeater
Passsword: allstarlink
SSH port: 22

Once you have your RaspberryPi connected to your LAN you are ready to start configuring it for AllStarLink.

The first thing you need to do is login to the raspi via SSH and then become root user using sudo as shown below:

sudo su -

Once you are root user, you need to add the AllStarLink repo to the sources file and update the operating system using the following command:

curl -s http://apt.allstarlink.org/repos/repo_signing.key | apt-key add
apt update --allow-releaseinfo-change
apt dist-upgrade

Copy and paste each line one at a time into your terminal. Once the last command finishes, the system is up to date and can be rebooted as follows:

reboot

Once the raspi has rebooted, login again via SSH as user repeater and then become root user again.

You now need to install a couple of Python components that are required by the system to function. Use the commands below as user root:

apt-get install python3-dev python3-pip
pip3 install pyserial

Next you need to change directory into the asterisk config file directory using the command shown below:

cd /etc/asterisk

In this directory you will find all the default config files that come as part of the distro. For this build we’re not going to use them and so we need to move them out of the way ready for a set of config files that have already been configured correctly.

Using the following commands create a new directory, move into that new directory and then move all the unwanted configuration files into it:

mkdir ORIGINAL-CONF-FILES
cd ./ORIGINAL-CONF-FILES
mv ../*.conf ./
ls -la
cd ../

You should now be back in the /etc/asterisk directory which will now be empty apart from the custom directory which we left in place.

You now need to copy the correctly configured configuration files into the /etc/asterisk directory. Start by downloading the zip file containing the new configuration files

Once downloaded, copy the .zip file into the repeater users home directory (/home/repeater) using either scp on the Linux command line or if using Windows you can use the FileZilla Client in SFTP mode using the login details above.

Once you have the .zip file in the repeater user’s home directory you need to copy the file into the /etc/asterisk directory as user root:

cp /home/repeater/AllStarLink-Config-v3.zip /etc/asterisk/

Next as user root, change directory into the /etc/asterisk directory and unzip the .zip file:

cd /etc/asterisk
unzip ./AllStarLink-Config-v3.zip

Once the file is unzipped you need to move a couple of files into the repeater users home directory using the following commands:

mv ./SA818-running.py /home/repeater
mv ./gpio /home/repeater

Once the files have been moved you need to set the correct ownership and privileges on the files using the following commands:

chown -R root:root /etc/asterisk/*.conf
chown repeater:repeater /home/repeater/gpio
chown repeater:repeater /home/repeater/SA818-running.py
chmod 755 /home/repeater/gpio
chmod 755 /home/repeater/SA818-running.py

The gpio BASH script and configuration details were supplied by Mark, G1INU in the Digital Voice room on the Matrix. It adds the COS light functionality to the setup. The COS light will now light every time the SA818 hears RF on the input.

The next thing you need to do is configure the SA818 radio device in the SHARI. The script I used was originally from https://wiki.fm-funknetz.de/doku.php?id=fm-funknetz:technik:shari-sa818 all I’ve done is change the entries to switch off CTCSS and changed the frequency to 438.800Mhz. Configuring the SA818 is done by running the SA818-running.py Python programme that you moved into the repeater user home directory. Making sure you are still user root, run the following commands:

cd /home/repeater
./SA818-running.py

At this point your SHARI SA818 device will be configured to operate on 438.800Mhz and CTCSS will be disabled.

If you want to change the frequency or enable and set a CTCSS tone to access the node you will need to edit the Python programme using your favourite text editor and change the entries accordingly. Once changed rerun the program as shown above and your SHARI will be reconfigured to your new settings.

Next you need to move the allmon.ini.php file into the correct directory so that it enables access to the Allstar Monitor web page on the device so that you can manage connecting/disconnecting nodes. Use the following commands as user root to achieve this:

cd /etc/asterisk
mv ./allmon.ini.php /var/www/html/allmon2/
chown root:root /var/www/html/allmon2/allmon.ini.php
chmod 644 /var/www/html/allmon2/allmon.ini.php

The allmon.ini.php file needs to have your node name entered into it for it to work correctly. As user root, change directory and edit the file using your favourite editor.

cd /var/www/html

Using your text editor, search for the line starting [XXXXX] and change the XXXXX to your node number. Save the change and exit the file.

At this point you are almost complete, all that is left to do is add your node number and node secret into the appropriate configuration files in the /etc/asterisk directory.

Since I am a Linux command line junkie I use vi to edit all the configuration files on the command line as user root, but you can use any editor of your choice.

cd /etc/asterisk

Start with the extensions.conf file. Search for the line starting with NODE = and delete the XXXXX entry and insert your node number. Save the file and edit it.

Next you need to edit the iax.conf file. This time search for the line starting with
register= and change the XXXXX for your node number and the YYYYYYYYYYYY for your node secret. Be careful not to accidentally delete any other characters in the lines otherwise it will corrupt the configuration file.

In the same file search for the two lines that start with secret = and change the YYYYYYYYYYYY for your node secret. Once you have changed both of the secret entries, save and exit the file.

The final file to edit is the rpt.conf file. Once again open the file using your favourite editor and search for the line starting with XXXXX = radio@127.0.0.1:4569/XXXXX, change the XXXXX entries for your node number making sure not to delete any other characters next to the XXXXX entries.

Further down in the same file there is a line that starts with [XXXXX], once again change the XXXXX for your node number making sure to keep the square brackets at each end of the node number as you edit it.

Finally move down to the very bottom of the file and find the two lines that start with /home/repeater/gpio, once again change the XXXXX entries for your node number.

Once this is done, save and exit the file. At this point your node should be fully configured and will only require a reboot to get it working.

As user root, reboot your raspi using the reboot command.

reboot

Once your raspi comes back online, login using SSH as user repeater and then become root user using the sudo command detailed above.

You now need to create the admin user password for the Allstar Monitor web page on the device. This is done using the following commands as user root:

cd /var/www/html/
htpasswd -c .htpasswd admin

You will be asked to enter a password twice for the admin user, make sure you make a note of this password as you will need it to login to the web page.

Once this is done your configuration is complete, logout from the terminal session by entering exit twice (once to logout as user root and another to logout as user repeater).

Using your favourite web browser enter the IP Address of your raspi into the URL bar as shown below:

http://<Your-Raspi-IP>/allmon2

Note: remove the <> from the URL once you have entered the required information.

Once this is done you should be presented with your node control panel as shown below.

First visit to the AllStar Monitor Web Page

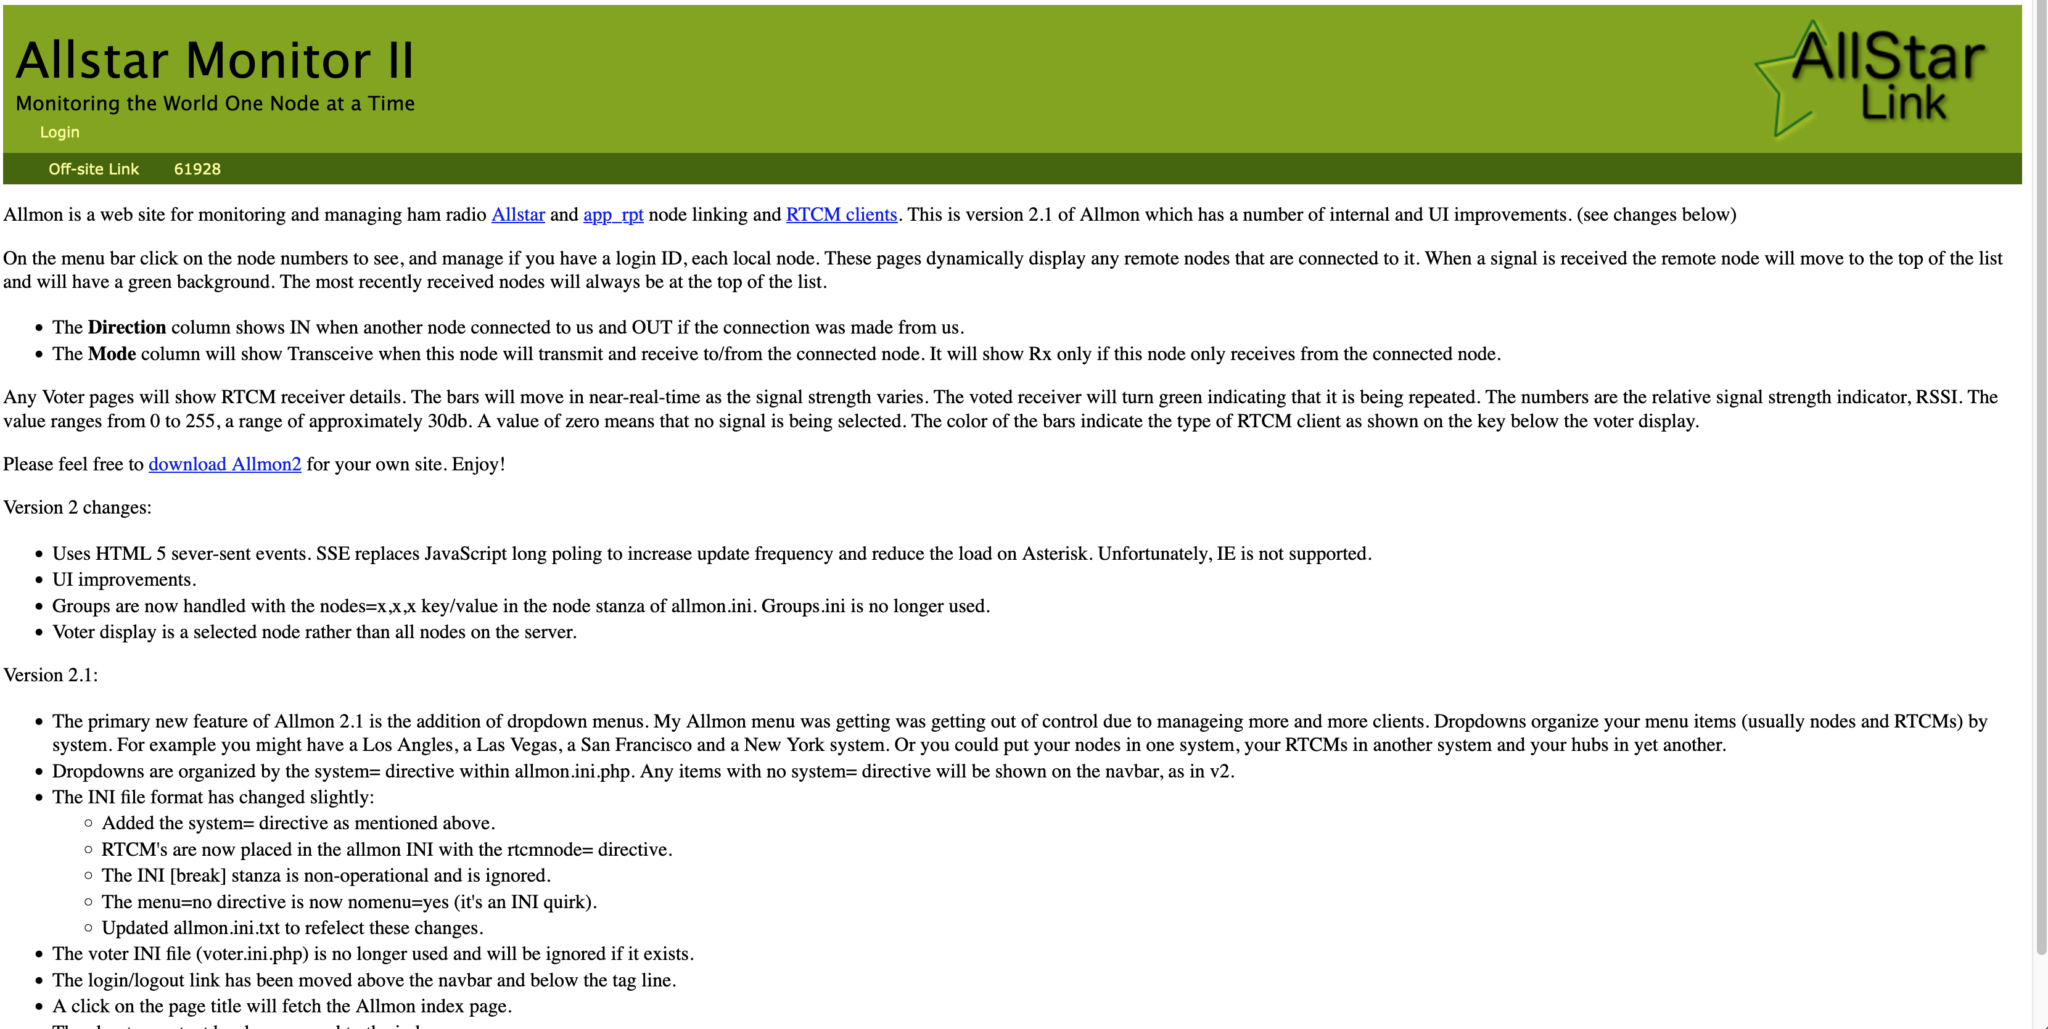
Login using Admin and the password you set above and you are now ready to start using your node.

It’s a good idea to connect to node 55553 which is a parrot test node to check your audio levels. you can do this by entering the node into the field at the top left and pressing the connect button.

M0AWS AllStarLink Node 61928 connected to 55553 Parrot

Once connected, tune your radio to 438.800Mhz FM and transmit a test message using your callsign and test123, or something similar. The parrot will then play your recording back to you so that you can hear how you sound. It will also comment on your audio level as to whether it is OK or not.

You are now connected to AllStarLink network and have the world at your finger tips. Below is a small list of nodes in the UK, Australia and America to get you started chatting with other HAMs via your node.

55553	ASL Parrot for testing
41522	M0HOY HUBNet Manchester, UK
60349	VK6CIA 439.275 Perth, Western Australia
51077	VK6SEG South West Hub B Albany WA
2167	M0JKT FreeSTAR UK HUB 2 freestar.network
53573	NWAG NW AllStar Group Lancashire, UK
27339	East Coast Hub Wilmington NC USA
M0AWS AllStarLink Node 61928 sitting on the equipment rack

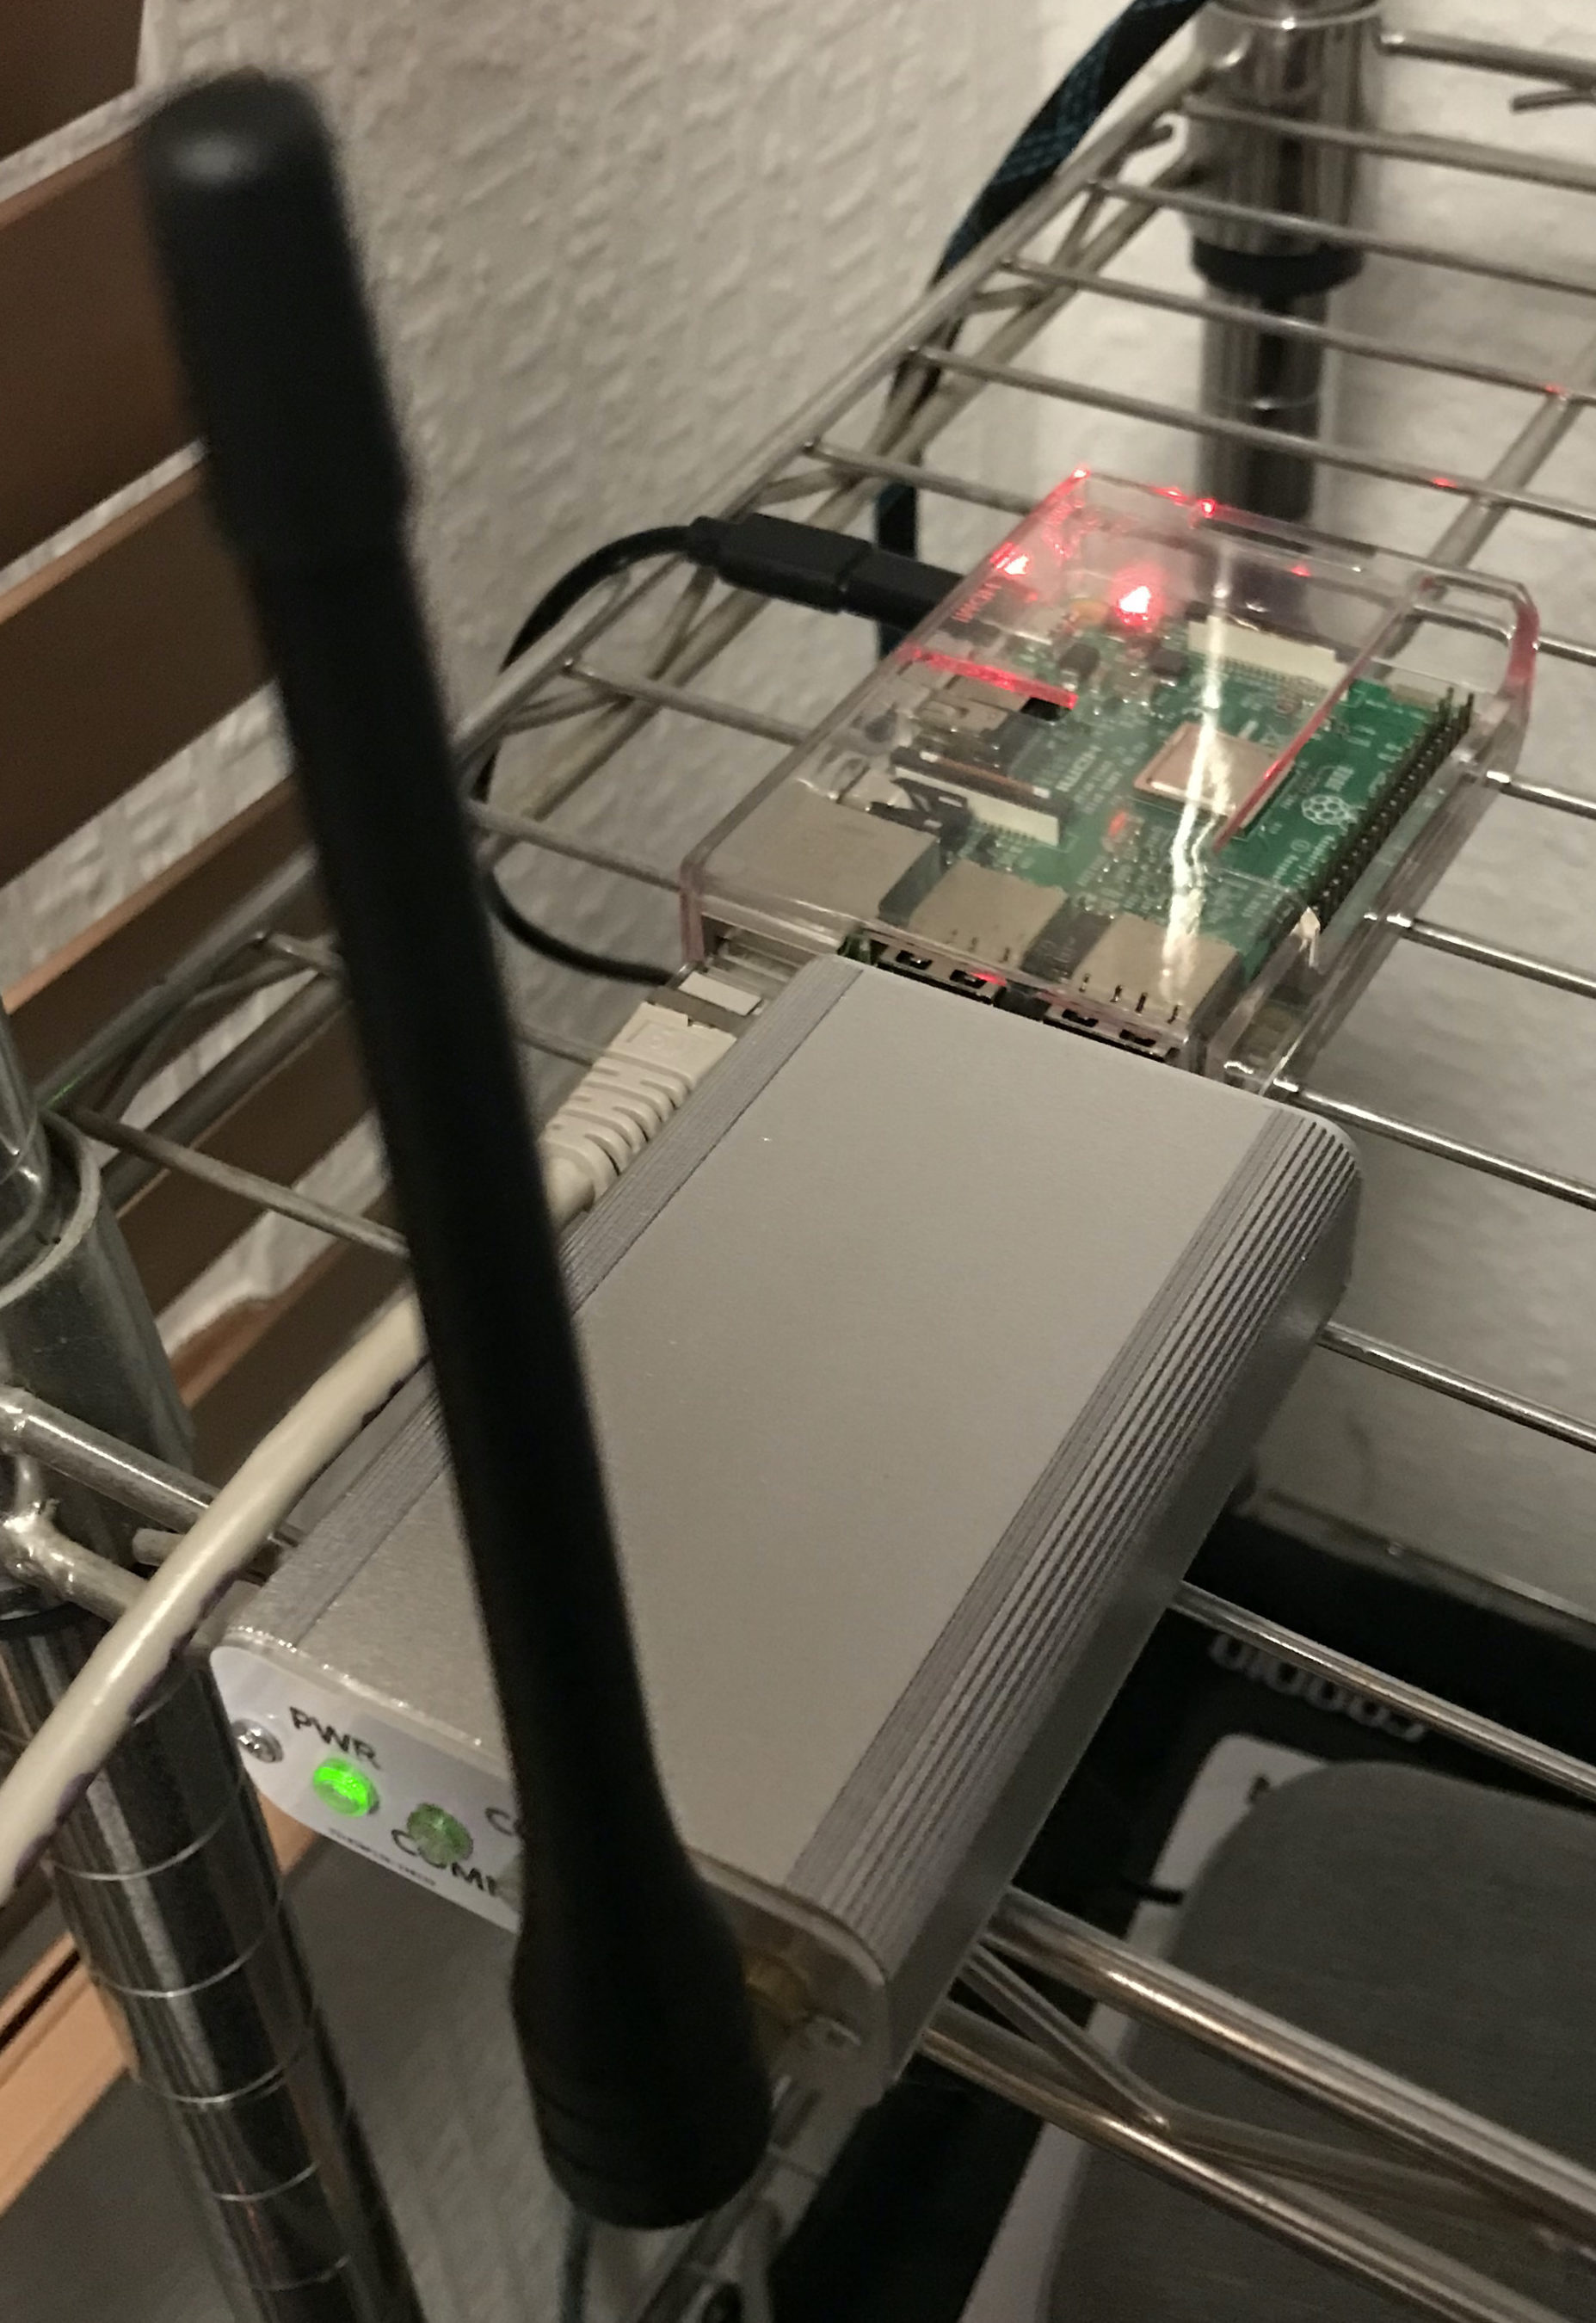
Thanks to Michael, DK1MI for building and hosting the Matrix HAM Radio Space AllStarLink Node (57881) and getting us all kicked off into the world of AllStarLink!

We hope to be having regular Matrix Net’s on the node soon for all Matrix members and visitors. We’ll organise days/times via the Digital Voice room.

More soon …

Deep Dive – Node-RED QO-100 Satellite Ground Station Dashboard

Following on from my article about my QO-100 Satellite Ground Station Complete Build, this article goes into some detail on the Node-RED section of the build and how I put together my QO-100 Satellite Ground Station Dashboard web app.

The Node-RED project has grown organically as I used the QO-100 satellite over time. Initially this started out as a simple project to synchronise the transmit and receive VFO’s so that the SDR receiver always tracked the IC-705 transmitter.

Over time I added more and more functionality until the QO-100 Ground Station Dashboard became the beast it is today.

M0AWS QO-100 ground Station Control Dashboard built using Node-RED.
M0AWS QO-100 Ground Station Control Dashboard built using Node-RED.

Looking at the dashboard web app it looks relatively simple in that it reflects a lot of the functionality that the two radio devices already have in their own rights however, bringing this together is actually more complicated than it first appears.

Starting at the beginning I use FLRig to connect to the IC-705. The connection can be via USB or LAN/Wifi, it makes no difference. Node-RED gains CAT control of the IC-705 via XMLRPC on port 12345 to FLRig.

To control the SDR receiver I use GQRX SDR software and connect to it using RIGCTL on GQRX port 7356 from Node-RED. These two methods of connectivity work well and enables full control of the two radios.

M0AWS Node-RED QO-100 Ground Station Dashboard - 12/06/24
M0AWS Node-RED QO-100 Ground Station Dashboard Flow as of 12/06/24

The complete flow above looks rather daunting initially however, breaking it down into its constituent parts makes it much easier to understand.

There are two sections to the flow, the GQRX control which is the more complex of the two flows and the comparatively simple IC-705 section of the flow. These two flows could be broken down further into smaller flows and spread across multiple projects using inter-flow links however, I found it much easier from a debug point of view to have the entire flow in one Node-RED project.

Breaking down the flow further the GQRX startup section (shown below) establishes communication with the GQRX SDR software via TCP/IP and gets the initial mode and filter settings from the SDR software. This information is then used to populate the dashboard web app.

M0AWS - Node-RED QO-100 Ground Station Dashboard - GQRX Startup
M0AWS Node-RED QO-100 Ground Station Dashboard – GQRX Startup Flow

The startup triggers fire just once at initial startup of Node-RED so it’s important that the SDR device is plugged into the PC at boot time.

All the startup triggers feed information into the RIGCTL section of the GQRX flow. This section of the flow (shown below) passes all the commands onto the GQRX SDR software to control the SDR receiver.

M0AWS - QO-100 Ground Station Dashboard - GQRX RIGCTL flow
M0AWS Node-RED QO-100 Ground Station Dashboard – GQRX RIGCTL Flow

The TCP RIGCTL -> GQRX node is a standard TCP Request node that is configured to talk to the GQRX software on the defined IP Address and Port as configured in the GQRX setup. The output from this node then goes into the Filter RIGCTL Response node that processes the corresponding reply from GQRX for each message sent to it. Errors are trapped in the green Debug node and can be used for debugging.

The receive S Meter is also driven from the the output of the Filter RIGCTL Response node and passed onto the S Meter function for formatting before being passed through to the actual gauge on the dashboard.

Continuing down the left hand side of the flow we move into the section where all the GQRX controls are defined.

M0AWS - QO-100 Ground Station Dashboard - GQRX Controls
M0AWS Node-RED QO-100 Ground Station Dashboard – GQRX Controls Flow

In this section we have the VFO step buttons that move the VFO up/down in steps of 10Hz to 10Khz. Each button press generates a value that is passed onto the Set DeltaFreq change node and then on to the Calc new VFO Freq function. From here the new VFO frequency is stored and passed onto the communications channel to send the new VFO frequency to the GQRX software.

The Mode and Filter nodes are simple drop down menus with predefined values that are used to change the mode and receive filter width of the SDR receiver.

Below are the HAM band selector buttons, each of these will use a similar process as detailed above to change the VFO frequency to a preset value on each of the HAM HF Bands.

The QO-100 button puts the transmit and receive VFO’s into synchro-mode so that the receive VFO follows the transmit VFO. It also sets the correct frequency in the 739Mhz band for the downlink from the LNB in GQRX SDR software and sets the IC-705 to the correct frequency in the 2m VHF HAM band to drive the 2.4Ghz up-converter.

The Split button allows the receive VFO to be moved away from the transmit VFO for split operation when in QO-100 mode. This allows for the receive VFO to be moved away so that you can RIT into slightly off frequency stations or to work split when working DXpedition stations.

The bottom two Memory buttons allow you to store the current receive frequency into a memory for later recall.

At the top right of this section of the flow there is a Display Band Plan Info function, this displays the band plan information for the QO-100 satellite in a small display field on the Dashboard as you tune across the transponder. Currently it only displays information for the satellite, at some point in the future I will add the necessary code to display band plan information for the HF bands too.

The final section of the GQRX flow (shown below) sets the initial button colours and starts the Powermate USB VFO knob flow. I’ve already written a detailed article on how this works here but, for completeness it is triggered a few seconds after startup (to allow the USB device to be found) and then starts the BASH script that is used to communicate with the USB device. The output of this is processed and passed back into the VFO control part of the flow so that the receive VFO can be manually altered when in split mode or in non-QO-100 mode.

M0AWS - QO-100 Ground Station Dashboard - Powermate VFO section
M0AWS Node-RED QO-100 Ground Station Dashboard – Powermate VFO Flow

The bottom flows in the image above set some flow variables that are used throughout the flow and then calculates and sets the RIT value on the dashboard display.

The final section of the flow is the IC-705 control flow. This is a relatively simple flow that is used to both send and receive data to/from the IC-705, process it and pass it on to the other parts of the flow as required.

M0AWS - QO-100 Ground Station Dashboard - IC-705 control flow
M0AWS Node-RED QO-100 Ground Station Dashboard – IC-705 Control Flow

The IC-705 flow is started via the timestamp trigger at the top left. This node is nothing more than a trigger that fires every 0.5 seconds so that the dashboard display is updated in near realtime. The flow is pretty self explanatory, in that it collects the current frequency, transmit power, SWR reading, PTT on/off status and S Meter reading each time it is triggered. This information is then processed and used to keep the dashboard display up to date and to provide VFO tracking information to the GQRX receive flow.

On the left are the buttons to change band on the IC-705 along with a button to tune to the VOLEMT on the 60m band. Once again there two memory buttons to save and recall the IC-705 VFO frequency.

The Startup PTT Colour trigger node sets the PTT button to green on startup. The PTT button changes to red during transmit and is controlled via the Toggle PTT function.

At the very bottom of the flow is the set transverter IF Freq function, this sets the IC-705 to a preselected frequency in the 2m HAM band when the dashboard is switched into QO-100 mode by pressing the QO-100 button.

On the right of the flow there is a standard file write node that writes the 2.4Ghz QO-100 uplink frequency each time it changes into a file that is used by my own logging software to add the uplink frequency into my log entries automatically. (Yes I wrote my own logging software!)

The RX Audio Mute Control filter node is used to reduce the receive volume during transmit when in QO-100 full duplex mode otherwise, the operator can get tongue tied hearing their own voice 250ms after they’ve spoken coming back from the satellite. This uses the pulse audio system found on the Linux platform. The audio is reduced to a level whereby it makes it much easier to talk but, you can still hear enough of your audio to ensure that you have a good, clean signal on the satellite.

As I said at the beginning of this article, this flow has grown organically over the last 12 months and has been a fun project to put together. I’ve had many people ask me how I have created the dashboard and whether they could do the same for their ground station. The simple answer is yes, you can use this flow with any kind of radio as long as it has the ability to be controlled via CAT/USB or TCP/IP using XMLRPC or RIGCTL.

To this end I include below an export of the complete flow that can be imported into your own Node-RED flow editor. You may need to make changes to it for it to work with your radio/SDR but, it shouldn’t take too much to complete. If like me you are using an IC-705 and any kind of SDR controlled by GQRX SDR software then it’s ready to go without any changes at all.


More soon …

Building HAM Clock on an old RaspberryPi

I’ve got a couple of old RaspberryPi computers on the shelf in the shack and so decided it was time for me to put one of them to good use. The first model on the shelf is the oldest and is one of the very first RaspberryPi 1 computers that was released. (It’s the one with the yellow analog video signal output on the board!). This particular model is extremely slow but, I hang onto it just as a reminder of the first SBC in the line.

The second one is a RaspberryPi 2, a quad core machine that is only slightly faster than the first model but, it’s powerful enough to run HAM Clock.

It didn’t take long to install a vanilla Raspbian Desktop O/S and get it configured on the local LAN. I installed a few packages that I like to have available on all my Linux machines and then started on the HAM Clock install.

The first thing I needed to do was install the X11 development library that is required to compile the HAM Clock binary. To do this, open a terminal and enter the command below to install the package.

sudo apt install libx11-dev

You will need to type in your password to obtain root privileges to complete the installation process and then wait for the package to be installed.

The HAM Clock source code is available from the HAM Clock Website under the Download tab in .zip format. Once downloaded unzip the file and change directory into the ESPHamClock folder ready to compile the code.

cd ~/Downloads/ESPHamClock

Once in the ESPHamClock directory you can run a command to get details on how to compile the source code.

make help

This will check your system to see what screen resolutions are available and then list out the options available to you for compiling the code as shown below.

The following targets are available (as appropriate for your system)

    hamclock-800x480          X11 GUI desktop version, AKA hamclock
    hamclock-1600x960         X11 GUI desktop version, larger, AKA hamclock-big
    hamclock-2400x1440        X11 GUI desktop version, larger yet
    hamclock-3200x1920        X11 GUI desktop version, huge

    hamclock-web-800x480      web server only (no display)
    hamclock-web-1600x960     web server only (no display), larger
    hamclock-web-2400x1440    web server only (no display), larger yet
    hamclock-web-3200x1920    web server only (no display), huge

    hamclock-fb0-800x480      RPi stand-alone /dev/fb0, AKA hamclock-fb0-small
    hamclock-fb0-1600x960     RPi stand-alone /dev/fb0, larger, AKA hamclock-fb0
    hamclock-fb0-2400x1440    RPi stand-alone /dev/fb0, larger yet
    hamclock-fb0-3200x1920    RPi stand-alone /dev/fb0, huge

For my system 1600×960 was the best option and so I compiled the code using the command as follows.

make hamclock-1600x960

It’s no surprise that it takes a while to compile the code on such a low powered device. I can’t tell you how long exactly as I went and made a brew and did a few other things whilst it was running but, it took a while!

Once the compilation was complete you then need to install the application to your desktop environment and move the binary to the correct directory.

make install

Once the install is complete there should be an icon on the GUI desktop to start the app. If like mine it didn’t create the icon then you can start the HAM Clock by using the following command in the terminal.

/usr/local/bin/hamclock &

The first time you start the app you’ll need to enter your station information, callsign, location etc and then select the settings you want to use. There are 4 pages of options for configuring the app all of which are described in the user documentation.

M0AWS - HAM Clock running on RaspberryPi Computer
M0AWS – HAM Clock running on RaspberryPi Computer

Once the configuration is complete the map will populate with the default panels and data. I tailored my panels to show the items of interest to me namely, POTA, SOTA, International Beacon Project and the ISS space station track. I was hoping to be able to display more than one satellite at a time on the map however, the interface only allows for one bird to be tracked at a time.

You can access the HAM Clock from another computer using a web browser pointed at your RaspberryPi on your local LAN using either the IP address or the hostname of the device.

http://<hostname>:8081/live.html

or

http://<ip-address>:8081/live.html

You can also control the HAM Clock remotely via web browser using a set of web commands that are detailed on port 8080 of the device.

http://<hostname or ip-address>:8080/

M0AWS - HAM Clock remote command set
M0AWS – HAM Clock remote command set

This is a great addition to any HAM shack especially if, like me you have an old HDTV on the wall of the shack that is crying out to display something useful.

More soon …

UPDATE: QO-100 Node Red Dashboard

I’ve been making a few improvements to my QO-100 Node Red Dashboard whilst waiting for the 2.4Ghz hardware to arrive. I’ve added the ability to split the RX and TX VFOs so that I can tune away from the TX frequency for working split stations or for tuning to slightly off frequency stations. I also added a series of tuning buttons to the top of the GQRX side of the dashboard to enable easy tuning using the trackball connected to my Kubuntu PC. This worked well but, I really missed having a real VFO knob like a conventional radio.

As I had a Griffin Powewrmate USB VFO from a previous SDR radio I added it to the flow as well so that I had a physical VFO knob for the SDR receiver. Details on how I got it working using evtest and a simple BASH script are in the Griffin Powermate article.

M0AWS QO-100 Node Red Dashboard Flow

The Node Red flow is looking a little busier with the addition of split mode and the Griffin Powermate USB VFO which has really enhanced the useability of the solution. It’s very impressive what can be achieved with Node Red with a little imagination. You really don’t need to be a heavy weight programmer to make things work.

M0AWS QO-100 Node Red Dashboard as of 07/06/23

I also put together some code to calculate the S Meter reading from the dBFS data the GQRX SDR software generates. It’s not 100% accurate but, it’s close enough to be useful.

On the IC-705 side of the Dashboard I also now display the 2.4Ghz uplink frequency so that it’s available for logging.

So with the QO-100 Dashboard ready to go live I have now started putting together the 2.4Ghz transmit path of the ground station. I have the 2.4Ghz transverter and matching 12w amplifier from DXPatrol, the IceCone Helix 2.4Ghz antenna from Nolle Engineering, some LMR-400-UF and connectors from Barenco and an appropriate water proof enclosure from Screwfix to fit all the kit into however, I’m now being held up by one simple little SMA male to SMA male connector that I need to connect the transverter and amp together.

The SMA connector has been ordered but, is taking a month of Sundays to arrive! Hopefully it’ll arrive soon and I’ll finally get on the QO-100 satellite and start enjoying the fun.

More soon …

Use a Griffin Powermate with SDR via Node Red

I’ve been gradually building my QO-100 ground station over the last few months and have had the receive path working for some time now. One of the things I really miss with the Funcube Dongle Pro+ (FCD) SDR is a real VFO knob for changing frequency.

My QO-100 Node Red dashboard is configured so that I can have the FCD track the uplink frequency from the IC-705 but, sometimes I use the FCD without the IC-705 in the shack and so a physical VFO would be handy.

Many years ago when I lived in France (F5VKM) I had a Flexradio Flex-3000 SDR, a great radio in it’s time and one that gave me many hours of enjoyment. One addition I bought for that station was a Griffin Technology Powermate VFO knob. It worked extremely well with the PowerSDR software for the Flex-3000 and I used it for many years.

Many years later I’m back in the UK and much of my equipment is packed away in the attic, including the Griffin Technology Powermate VFO.

I decided to dig it out and see if I could get it working with GQRX SDR software. Sadly I couldn’t get it working with GQRX however, I did find a way of getting it working with Node Red and thus could add it to my QO-100 Node Red Dashboard and then control GQRX with it via a simple Node Red flow.

Griffin Technology Powermate VFO

Plugging the Powermate VFO into my Kubuntu PC it wasn’t immediately recognised by the Linux O/S. After a little searching I found the driver on Github. I added the PPA to my aptitude sources and installed the driver using apt.

https://launchpad.net/~stefansundin/+archive/ubuntu/powermate

Once installed the default config for the Powermate device is to control the default audio device volume. To make the device available for use as a VFO knob you need to change the configuration so that the default setting is disabled. To do this is relatively easy, just edit the config file using your favourite command line editor (Vi/Vim in my case) and add the following entry.

vi /etc/powermate.toml

# Entry to control HDMI volume with Powermate
#sink_name = "alsa_output.pci-0000_01_00.1.hdmi-stereo"

# Set powermate not to work with volume control
sink_name = ""

As shown above, comment out the default “sink_name” entry (Yours may be different depending on audio device in your PC) and add in the Powermate “sink_name” entry that effectively assigns it to nothing.

Once this is done, save the file and exit your editor and then reboot the PC.

Next you’ll need to install a small program called evtest.

sudo apt install evtest

To check the evtest program has installed correctly, plugin your Powermate VFO to any available USB port and run the following command in a terminal.

evtest /dev/input/powermate

Turning the Powermate knob you should see output on the screen showing the input from the device. You should also see BTN events for each press of the Powermate device.

Input driver version is 1.0.1
Input device ID: bus 0x3 vendor 0x77d product 0x410 version 0x400
Input device name: "Griffin PowerMate"
Supported events:
  Event type 0 (EV_SYN)
  Event type 1 (EV_KEY)
    Event code 256 (BTN_0)
  Event type 2 (EV_REL)
    Event code 7 (REL_DIAL)
  Event type 4 (EV_MSC)
    Event code 1 (MSC_PULSELED)
Properties:
Testing ... (interrupt to exit)
Event: time 1685816662.086666, type 2 (EV_REL), code 7 (REL_DIAL), value -1
Event: time 1685816662.086666, -------------- SYN_REPORT ------------
Event: time 1685816662.318638, type 2 (EV_REL), code 7 (REL_DIAL), value -1
Event: time 1685816662.318638, -------------- SYN_REPORT ------------
Event: time 1685816662.574615, type 2 (EV_REL), code 7 (REL_DIAL), value -1
Event: time 1685816662.574615, -------------- SYN_REPORT ------------
Event: time 1685816663.670461, type 2 (EV_REL), code 7 (REL_DIAL), value 1
Event: time 1685816663.670461, -------------- SYN_REPORT ------------
Event: time 1685816664.030421, type 2 (EV_REL), code 7 (REL_DIAL), value 1
Event: time 1685816664.030421, -------------- SYN_REPORT ------------
Event: time 1685816664.334389, type 2 (EV_REL), code 7 (REL_DIAL), value 1
Event: time 1685816664.334389, -------------- SYN_REPORT ------------
Event: time 1685816665.334255, type 1 (EV_KEY), code 256 (BTN_0), value 1
Event: time 1685816665.334255, -------------- SYN_REPORT ------------
Event: time 1685816665.558230, type 1 (EV_KEY), code 256 (BTN_0), value 0
Event: time 1685816665.558230, -------------- SYN_REPORT ------------
Event: time 1685816666.030161, type 1 (EV_KEY), code 256 (BTN_0), value 1
Event: time 1685816666.030161, -------------- SYN_REPORT ------------
Event: time 1685816666.182151, type 1 (EV_KEY), code 256 (BTN_0), value 0
Event: time 1685816666.182151, -------------- SYN_REPORT ------------

At this point you’re ready to stop evtest (CTRL-C) and then create the following little BASH shell script that Node Red will run to collect the O/P from the Powermate USB device.

#!/bin/bash

###############################################
# Griffin Technology Powermate control script #
# for Node Red.                               #
#                                             #
# 04/06/23 - M0AWS - v0.1                     #
#                                             #
###############################################

VAL="1"
echo "STEP-1Hz"

/usr/bin/evtest /dev/input/powermate | while read LINE 
do
   case $LINE in

      *"(REL_DIAL), value 1") echo "$VAL"
           ;;

      *"(REL_DIAL), value -1") echo "-$VAL"
           ;;

      *"(BTN_0), value 1") case $VAL in

                              "1") VAL="10"
                                   echo "STEP-10Hz"
                                      ;;

                             "10") VAL="100"
                                   echo "STEP-100Hz"
                                      ;;

                             "100") VAL="1000"
                                    echo "STEP-1Khz"
                                       ;;

                             "1000") VAL="10000"
                                     echo "STEP-10Khz"
                                         ;;

                             "10000") VAL="1"
                                       echo "STEP-1Hz"
                                          ;;
                              esac
                                 ;;
        esac
done

Once the BASH script is copied and pasted into a file called powermate.sh you need to make it executable by using the following command.

chmod 700 ./powermate.sh

If you now run the shell script in a terminal you’ll see a similar output to that shown below from the device when used.

./powermate.sh 
STEP-1Hz
-1
-1
-1
1
1
1
STEP-10Hz
10
10
10
-10
-10
-10
STEP-100Hz
100
-100
-100
STEP-1Khz
1000
STEP-10Khz
STEP-1Hz
1
1
STEP-10Hz

As you can see above the shell script outputs a positive or negative number for VFO tuning and changes the VFO step size each time the Powermate is depressed.

Getting this output from the BASH shell script into Node Red is really simple to achieve using just 3 or 4 nodes.

In the Node Red development UI create the following nodes.

Griffin Powermate Node Red Nodes

The first node in the flow is a simple inject node, here I called it trigger. This sends a timestamp into the next node in the flow at startup to set the flow running.

The Griffin Powermate node is a simple exec node that runs the script we created above.

M0AWS Powermate exec node

Configure the node as shown above and connect it to the inject node that’s used as a trigger. Note: Change “user” in the Command field shown above to that of your username on your Linux PC)

Once done create the third node in the flow, a simple switch node and configure as shown below.

Switch Node for Powermate

The switch node has two outputs, the top one is a text output that is fed into a text field to show the current step size of the Powermate device and the lower output is the numeric output that must be fed into your VFO control flow so that the VFO value is incremented/decremented by the amount output by the Powermate device.

I’ve found the Griffin Technology Powermate USB device works extremely well with Node Red and GQRX that I use for controlling the FCD SDR radio and it’s now part of my QO-100 ground station build.

M0AWS QO-100 Dashboard with Powermate Step Display at bottom

As shown above you can see the Powermate Step size at the bottom of the dashboard, this text changes each time the Powermate device is depressed and will set a step size of 1Hz, 10Hz, 100Hz, 1Khz, 10Khz in a round-robin fashion.

The next stage of the build is the 2.4Ghz transmit path. I now have all the necessary hardware and so this part of the build can finally commence.

More soon …

How to make a webpage from your WSJT-X log file

Map showing all M0AWS FT4/8 contacts

I’ve had a few messages of late asking how I generate my WSJT-X log web pages for my website. The answer is pretty simple, I use a little BASH script that I started writing some time back and have gradually improved over the last few months.

If you have a PC running Linux or a RaspberryPi running any of the normal Debian/Ubuntu/Redhat/Fedora based Linux distro’s that are available today then, this script should work just fine.

I originally wrote this program using Python but, a friend of mine bet me that I couldn’t write it in BASH and so, I took up the challenge and this is the result. It’s pretty simple and uses all the normal UNIX command line goodies like grep, sed and awk.

The script also uses WWL to calculate the distance between two Maidenhead locator grid squares and so it’s important to have it installed before running the script. (The script checks for it at runtime and will exit if it is not installed!). You can install WWL using your package manager on your Linux distro or from the command line directly. Details are in the READ-ME.txt file.

Screen grab from my M0AWS WSJT-X Log web page

It’s important that you READ the READ-ME.txt included in the zip file before trying to run any of the scripts included as it details the variables that you need to enter values for to make the script run on your PC/Server. (Example entries are in place as supplied).

The variables are mainly just paths to files on your system and whether you want distances calculated in miles or kilometres. Other than that there’s nothing else required for it to run.

I’ve also included details on how to run the script automatically from a crontab so that your webpage can be updated automatically every few minutes/hours etc.

The script also includes code to add a PNG map file into the generated webpage so that there is a graphical representation of all your QSOs. The map isn’t generated by the script (something I need to add in the coming few months) so you’ll need to generate it yourself and then add it to the website either via the crontab script included in the zip file or manually.

I use the QSOMap website to generate my map image files and then have them uploaded to my web server via the crontab script.

The script processes 100 entries per second on my web server (Headless virtual machine running Ubuntu Server 64bit Edition) and so should be pretty fast on most PCs. It will run somewhat slower on a RaspberryPi so be patient!

You can download the script and associated information using the button below.


If you do use my script please send me a link to your website so that I can take a look at your log file.

More soon …

Searching the WSJT-X log whilst on air

searchwsjtxlog v0.4 showing search for partial callsign

Being a UNIX/Linux command line guy I’m not a fan of a lot of these GUI based logging programs that are full of functionality I’ll never use. I currently have RumLogNG for the MacBook Pro but, I really don’t like it. It does many things I don’t need and not the things I really need when on air.

So I decided to write a bunch of command line based programs that do exactly what I want with minimal fuss. The first of these programs was adi2html, a simple program that converts the WSJT-X ADI log file into HTML so I can easily put it on my website.

I’ve now written a new program using the same BASH shell technique to allow me to search the WSJT-X log file quickly and easily whilst on air.

searchwsjtxlog is a simple little shell script that searches for either a full or partial callsign and presents the results instantly. I use this script a lot when working FT4/8 as I can see if I’ve worked a station before and on what bands easily and quickly.

The script works on Linux and MacOS Big Sur (Not got Monterey to test but, should work fine). If you find a bug please let me know and I’ll fix it as soon as possible.

Note: Since MacOS uses such an old version of the BASH it cannot handle spaces in the path to the wsjtx_log.adi file. On MacOS you’ll need to create a softlink to the file and then put the path to the soft link into the script for it to work properly. CD into the directory where you have saved the searchwsjtxlog.sh file and then run the following command:

ln -s /Users/YOURUSERNAME/Library/Application\ Support/WSJT-X/wsjtx_log.adi ./wsjtx_log.adi

Make sure you replace YOURUSERNAME with your MacOS username. The command is all on one line and not on two lines as shown above.

You can download v0.4 of searchwsjtxlog using the link below.


More soon …

adi2html v0.6 release

Following on from the adi2html v0.5 release I’ve now added a little more code to include a map of the contacts detailed in the wsjtx_log.adi file so that there is a visual representation of the data included in the webpage. (Map must be generated externally and JPEG/GIF/PNG uploaded to website to be included in the webpage).

See my WSJT-X log here

Just to recap, adi2html generates a HTML webpage from the wsjtx_log.adi file so that the log can be presented in a palatable format on a website.

As before the code can be downloaded using the link below.

If you use my code please consider leaving the footer in place so I get some credit, thanks!

Convert your RUMLogng radio logs to HTML

I’ve started using RUMLogng for logging on my MacBook Pro as it seems to be the most common logbook to use on the Apple Mac platform. I must admit that I’m not sure if I’ll carry on using it going forward as I’m not overly enamoured by it but, for the time being it’s all I have.

To get my logs on the blog I’ve written a small BASH shell script that reads the exported ADIF file from RUMLogng and creates a log in HTML format for each different mode.

You can see the output of the BASH script by selecting a log from the Logs menu at the top of this page.

If you want to be able to add your log to your own website then I’ve made the script available for download below.

Currently I’ve only tested the script with the few different modes that I have log entries for but, it should work for all modes. If you find any issues please contact me with all the details and I’ll look into resolving any problems.

As always, if you use my code to generate webpages on your website please consider leaving the footer in place so I get some credit, thanks!

adi2html v0.5 release

Following on from my original article where I detailed the adi2html Bash script that reads in the WSJT-X log and creates an HTML version of the data so that it can be presented in a palatable format on websites (See my WSJT-X log here), I’ve now released v0.5 for public consumption.

In adi2html v0.5 I’ve added colour to the webpage that is generated to make it easier on the eyes and rewritten the function process_log() so that it uses the column name to identify each field instead of the row position.

By making this change it should cope just fine if the order of the fields is ever altered in the WSJT-X log during its development.

As before the code can be downloaded using the link below.

If you use my code please consider leaving the footer in place so I get some credit, thanks!