A couple of years ago I built a Matrix Synapse server and connected it to the decentralised global Matrix chat network that is federated world wide by enthusiasts who host their own Matrix servers. Due to the enthusiasm for a decentralised network the Matrix has grown exponentially and is now an established force in the world of Opensource global communication services.
When I built my server and configured it online my aim was to bring together an enthusiastic group of Radio Amateurs (Radio HAMs) who could build a friendly, welcoming community where people could share, learn and have fun with other liked minded individuals without all the nonsense you see on commercial social media platforms.
Overtime we’ve increased the number of rooms available in the HAM Radio space and the number of subjects covered. This has grown organically as our community has grown and we’ve ventured together into new areas of the hobby.
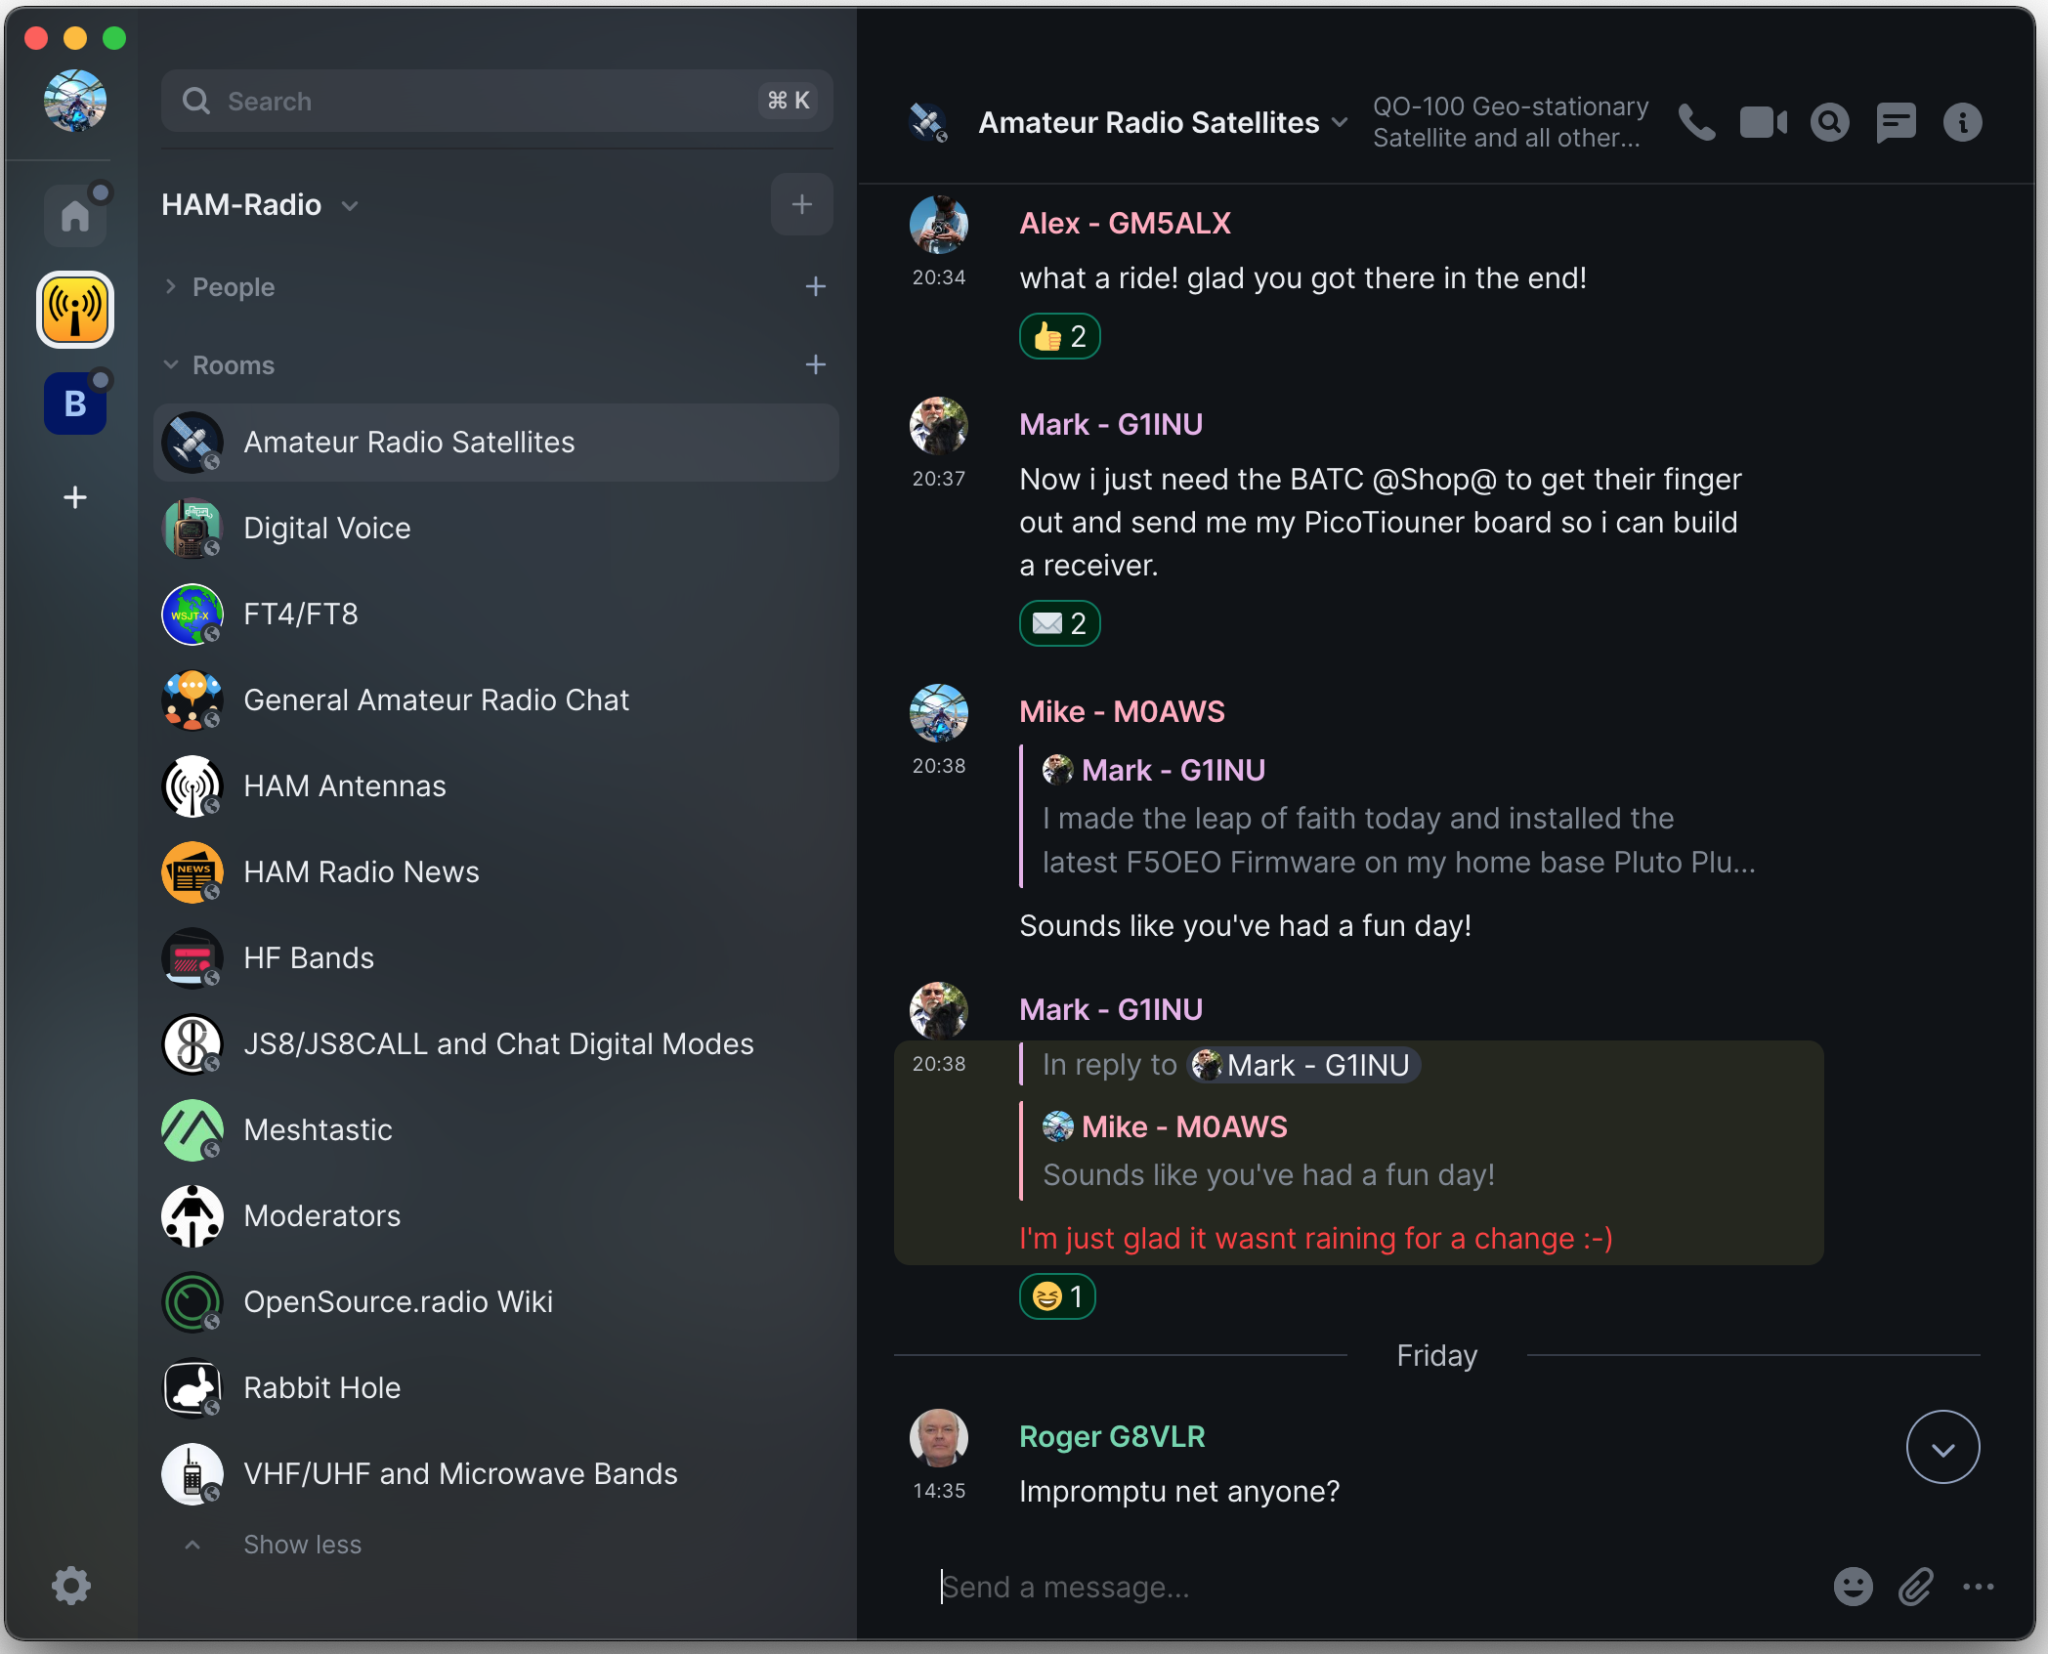
Global Matrix Ham Radio Space hosted on the M0AWS Matrix Server
From the community a number of projects have spawned including the Opensource.radio Wiki that Mike, DK1MI is sponsoring that aims to detail all the Opensource HAM Radio software, Hardware and projects in one centralised site on the internet. This is a great project and one I am very happy to contribute to.
Thanks to Mike, DK1MI we now also have our own Matrix AllStarLink node available. This is a great resource for the community as it is often not possible for all of us to communicate via the radio waves due to geo-location, time zones, local planning regulations etc. Having this 24/7 internet based resource makes it a lot easier for the community to chat at any time even when propagation on the HF bands isn’t in our favour.
We also have a very active satellite room with regular nets on the QO-100 satellite. With such a great range of rooms and subjects there’s plenty to read and talk about with the community.
If you fancy being part of this growing, enthusiastic group of Radio Amateurs and Short Wave Listeners (SWLs) then click on the link below and come and say hello, a warm welcome awaits!
I get quite a few emails from readers of my blog asking how my QO-100 satellite station is put together and so, I thought perhaps now is a good time to put together an article detailing the complete build.
My QO-100 satellite ground station is built around my little Icom IC-705 QRP transceiver, it’s a great little rig and is ideal for the purpose of driving a 2.4Ghz transverter/up-converter.
Of course all the software used for the project is Opensource and freely available on the internet.
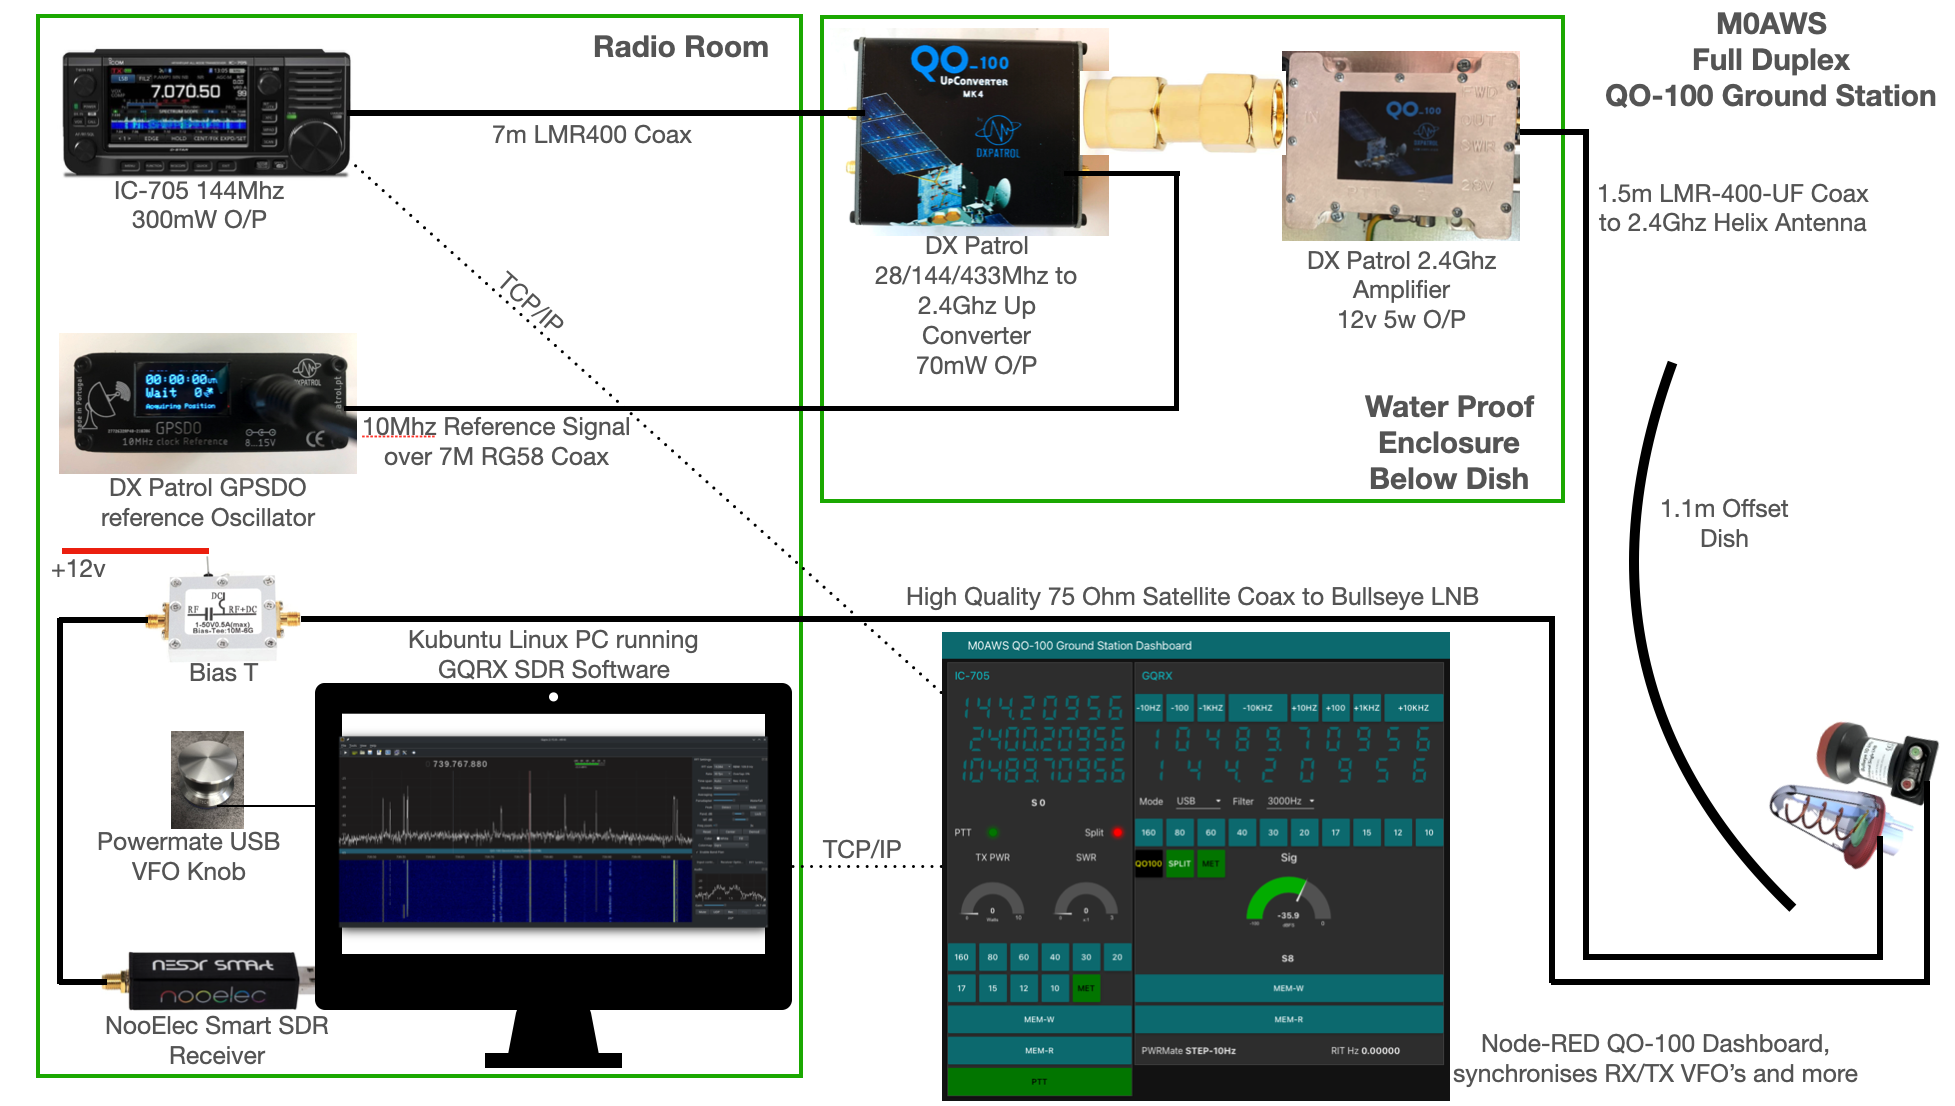
M0AWS QO-100 Ground Station Build Visual (Click to Enlarge)
The station comprises of the following building blocks:
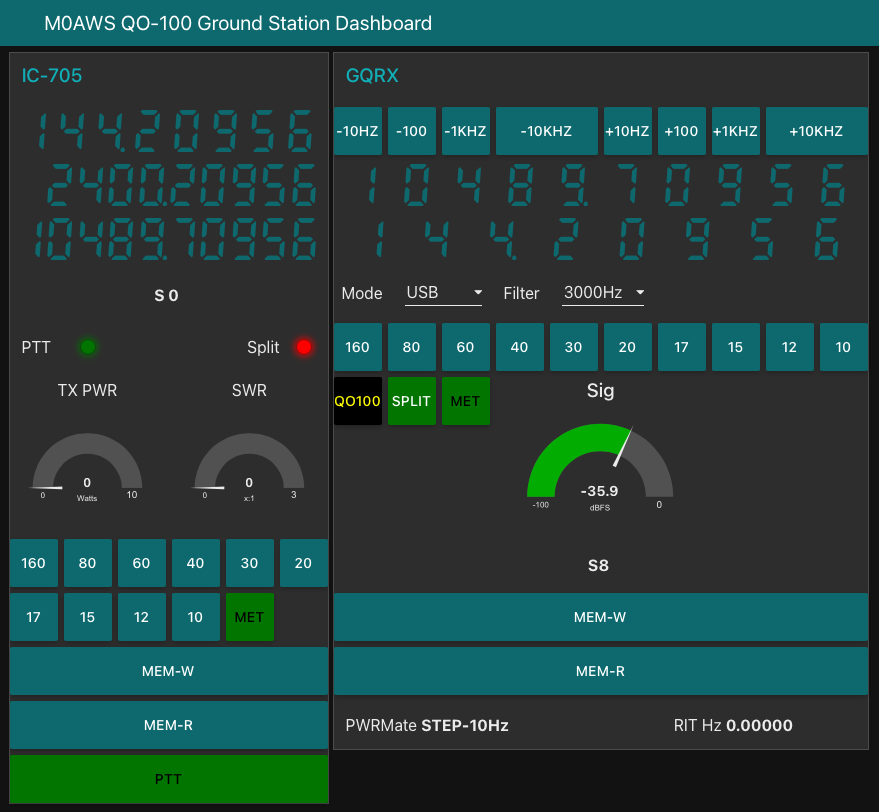
QO-100 Ground Station Dashboard developed using Node-RED
LMR400-UF/RG58 Coax Cable
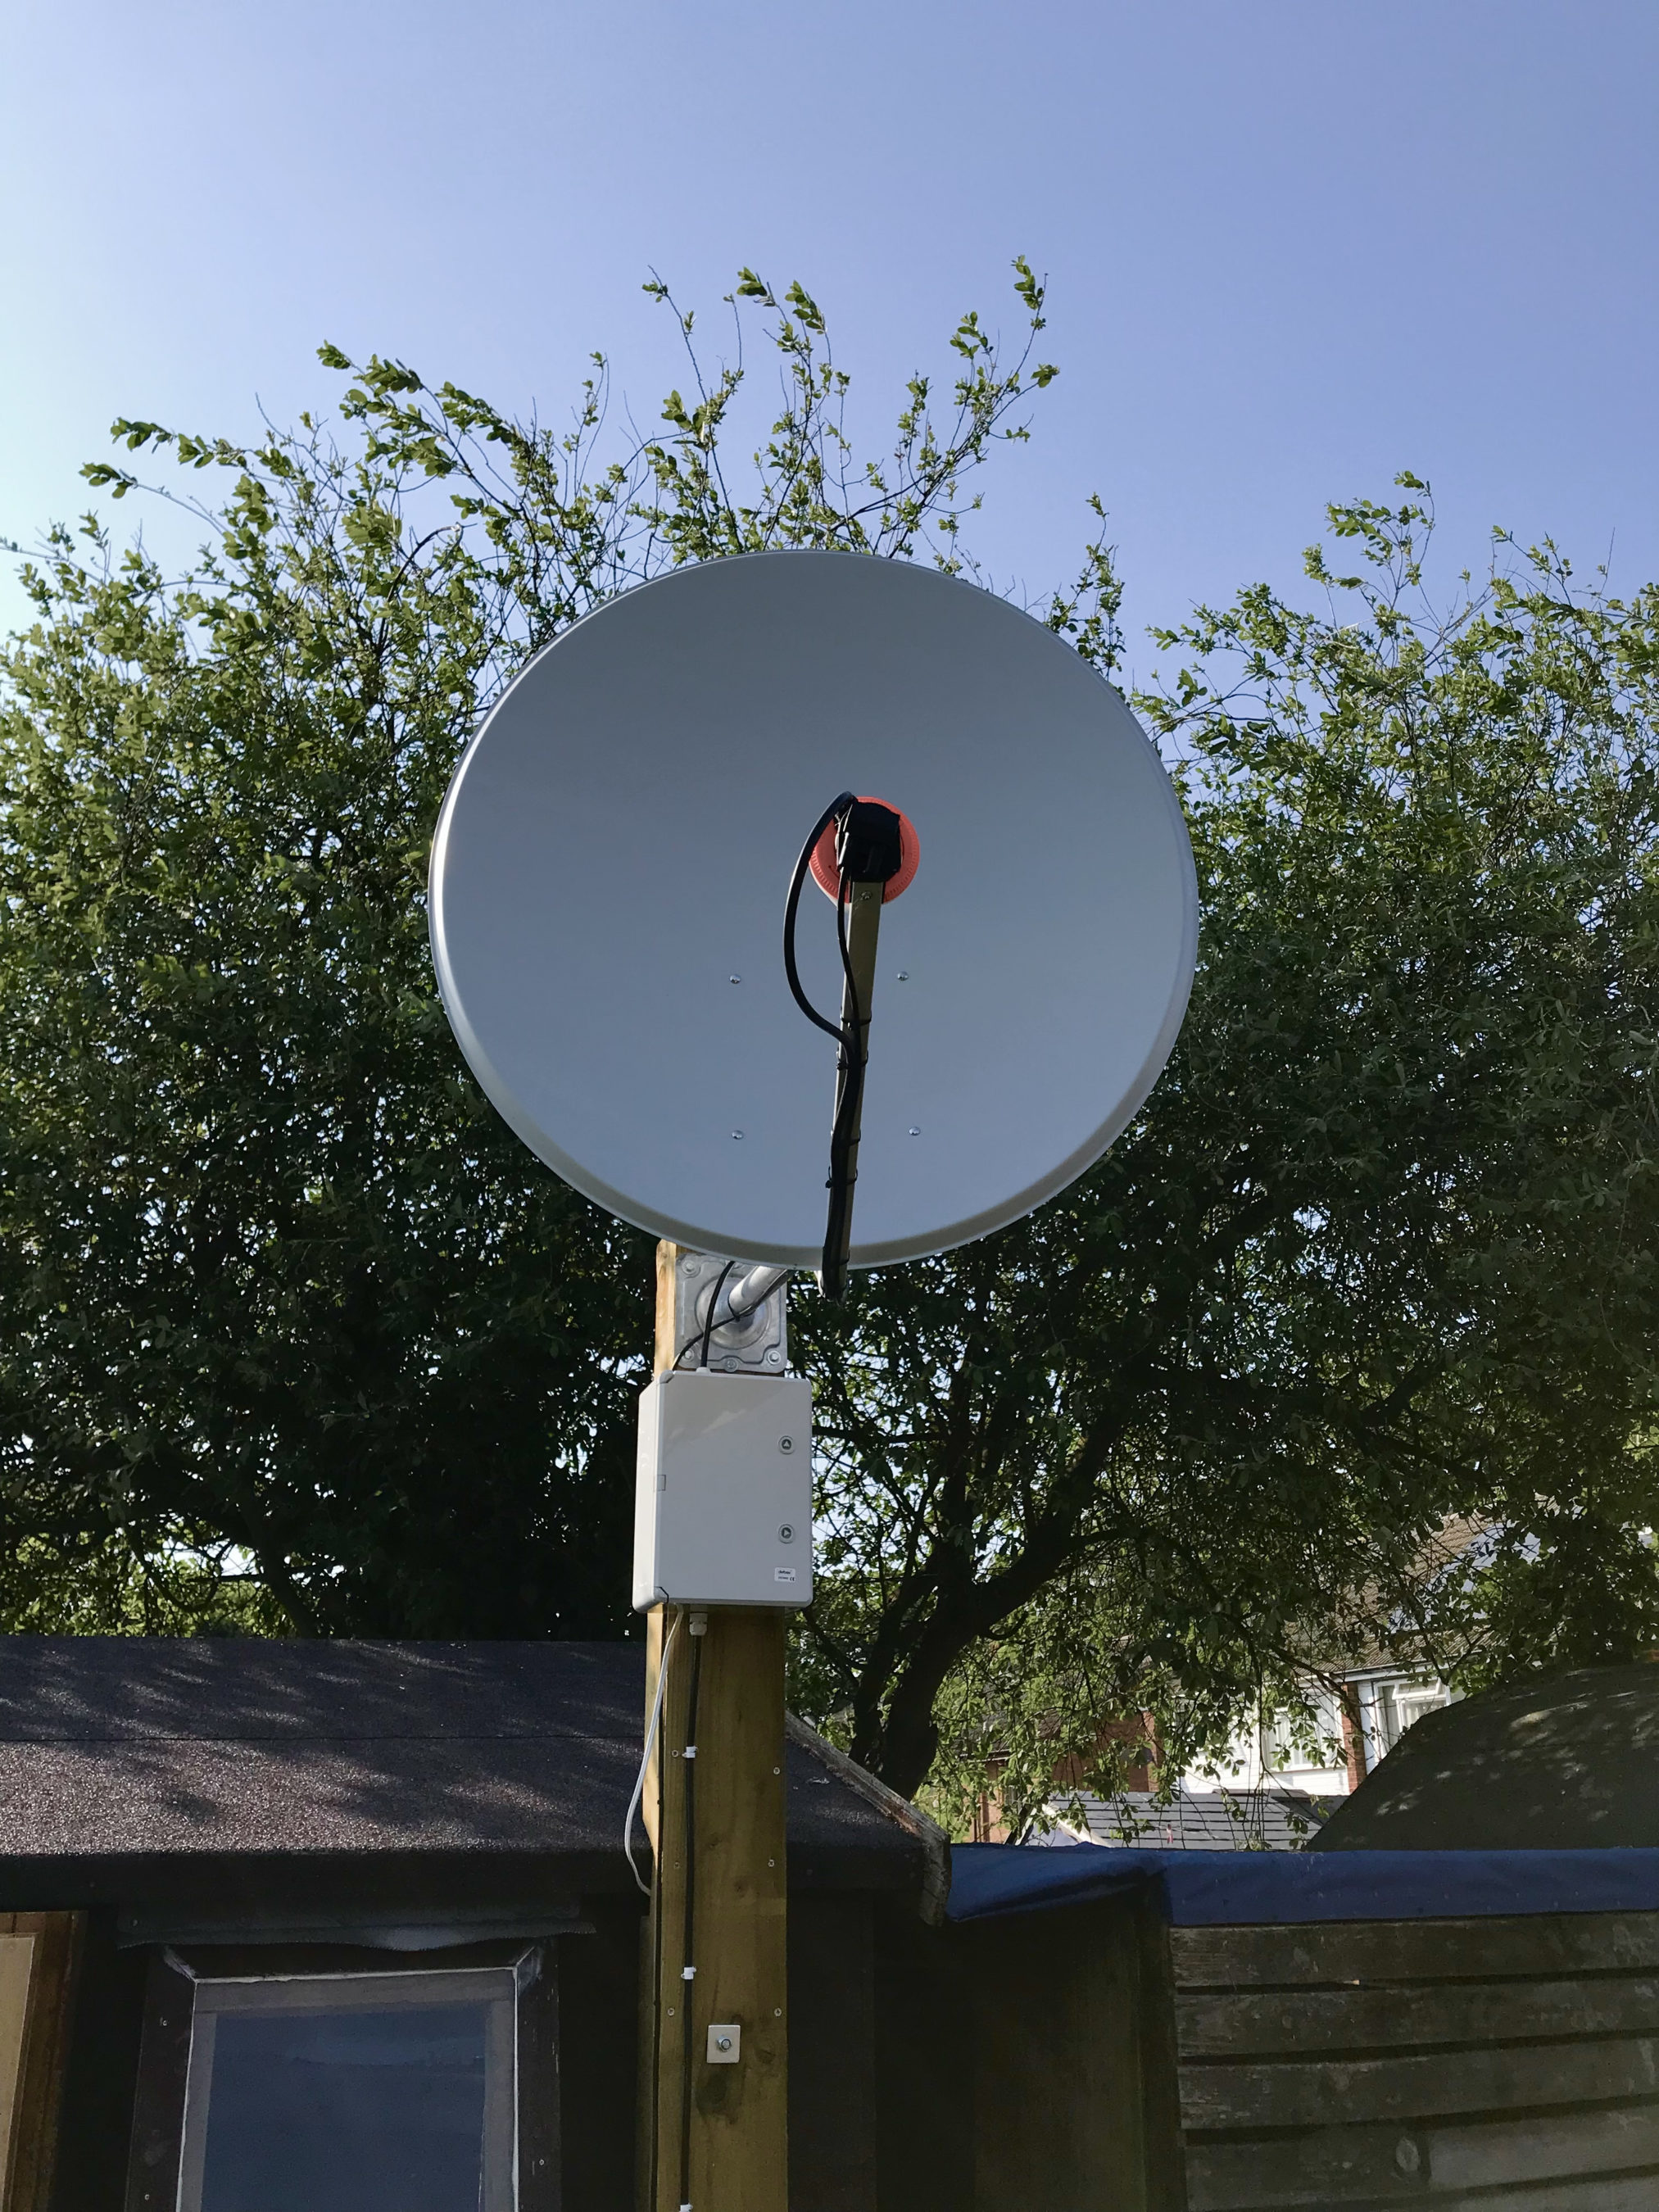
M0AWS QO-100 1.1m (110cm) off-set Dish with IceCone Helix antenna and Bullseye LNB.
To get a good clear view of the QO-100 satellite I have the dish mount 3.2m above the ground. This keeps it well clear of anyone walking past in the garden and beams the signal up at an angle of 26.2 degrees keeping well clear of neighbouring gardens.
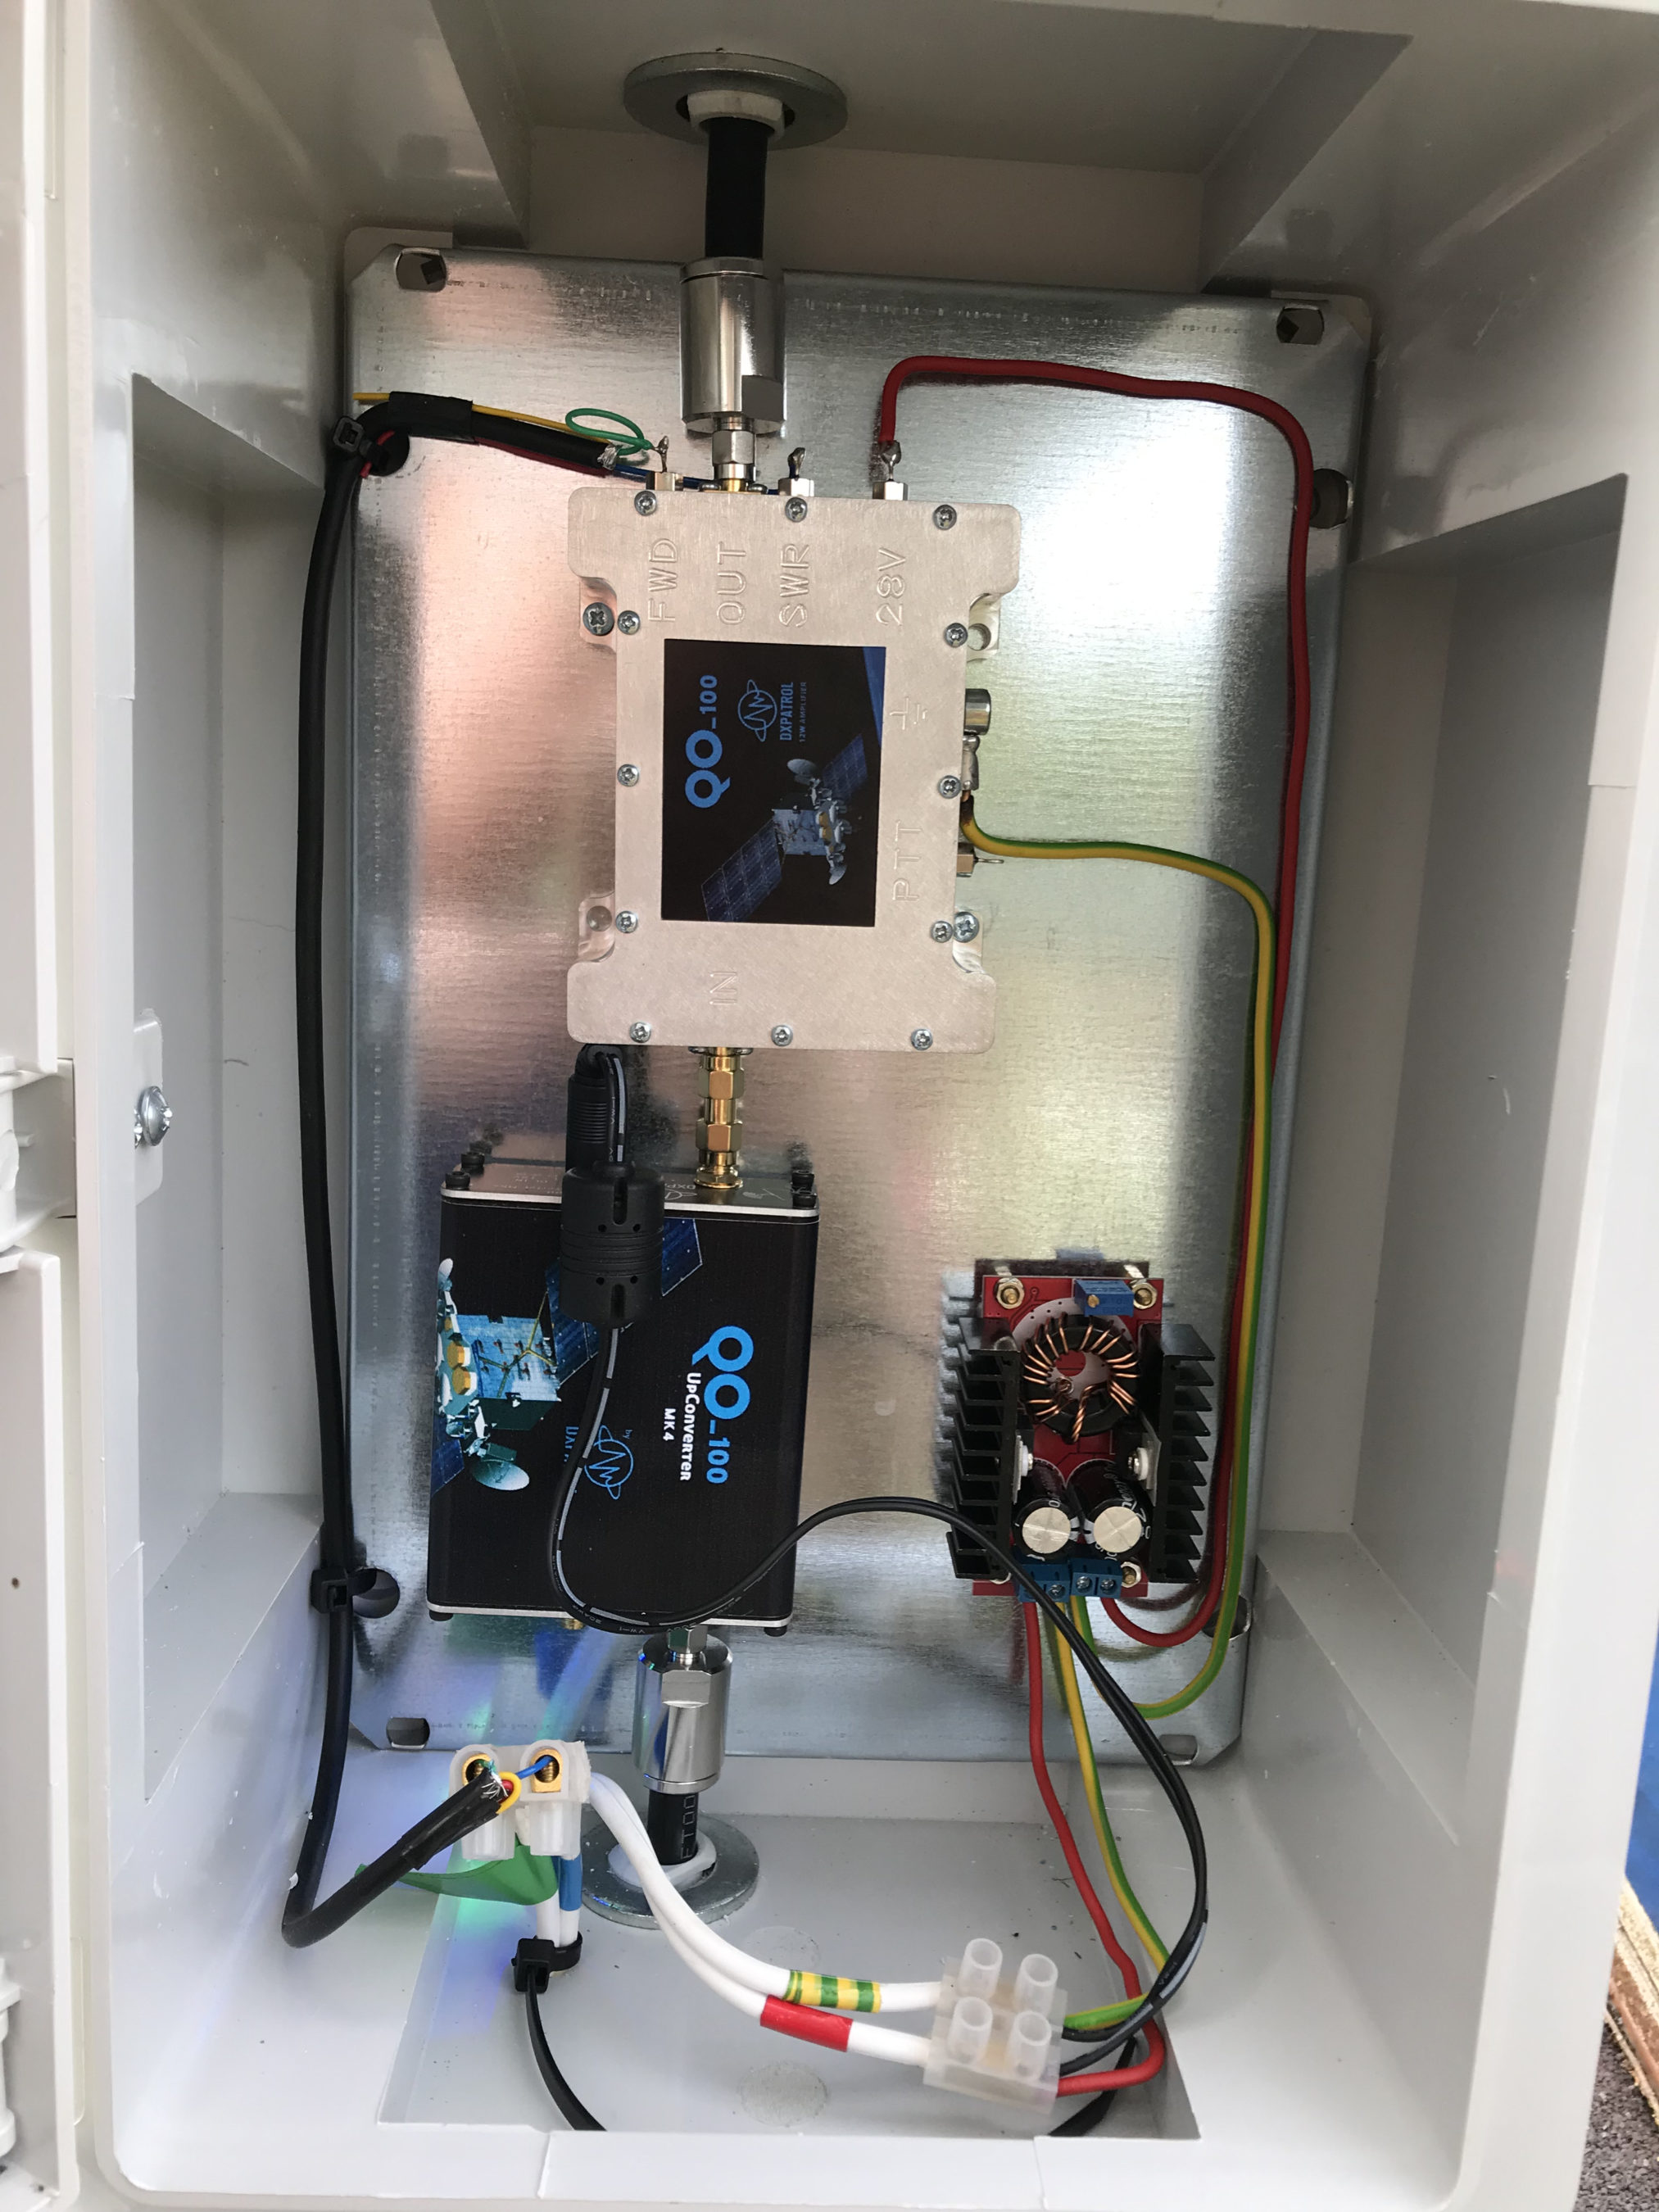
The waterproof enclosure below the dish houses all the 2.4Ghz equipment so that the distance between the feed point and the amplifier are kept to a minimum.
The DXPatrol amplifier is spec’d to run at 28v/12w or 12v/5w, I found that running it at 28v produced too much output for the satellite and would cause the LEILA alarm on the satellite to trip constantly. Running the amp at 12v with a maximum of 5w output (average 2.5-3.5w) is more than enough for me to have a 5/9+10 signal on the transponder.
The large 1.1m dish gives me quite an advantage on receive enabling me to hear the very weak stations with ease compared to other stations.
2.4Ghz ground station enclosure ready for testing
The photo above shows the 2.4Ghz equipment mounted in the waterproof enclosure below the dish. This photo was taken during the initial build phase before I rewired it so, the amplifier is shown connected to the 28v feed. To rewire the amp to 12v was just a matter of removing the 28v converter and connecting the amp directly to the 12v feed instead. This reduced the output from a maximum of 12w down to a maximum of 5w giving a much better (considerate) level on the satellite.
It’s important to keep all interconnects as short as possible as at 2.4Ghz it is very easy to build up a lot of loss between devices.
For the connection from the IC-705 to the 2.4Ghz Up-Converter I used a 7m run of LMR-400 coax cable. The IC-705 is set to put out just 300mW on 144Mhz up to the 2.4Ghz converter and so it’s important to use a good quality coax cable.
Once again the output from the 2.4Ghz amplifier uses 1.5m of LMR-400-UF coax cable to feed up to the 2.2 turn Icecone Helix Antenna mounted on the dish. This keeps loss to a minimum and is well worth the investment.
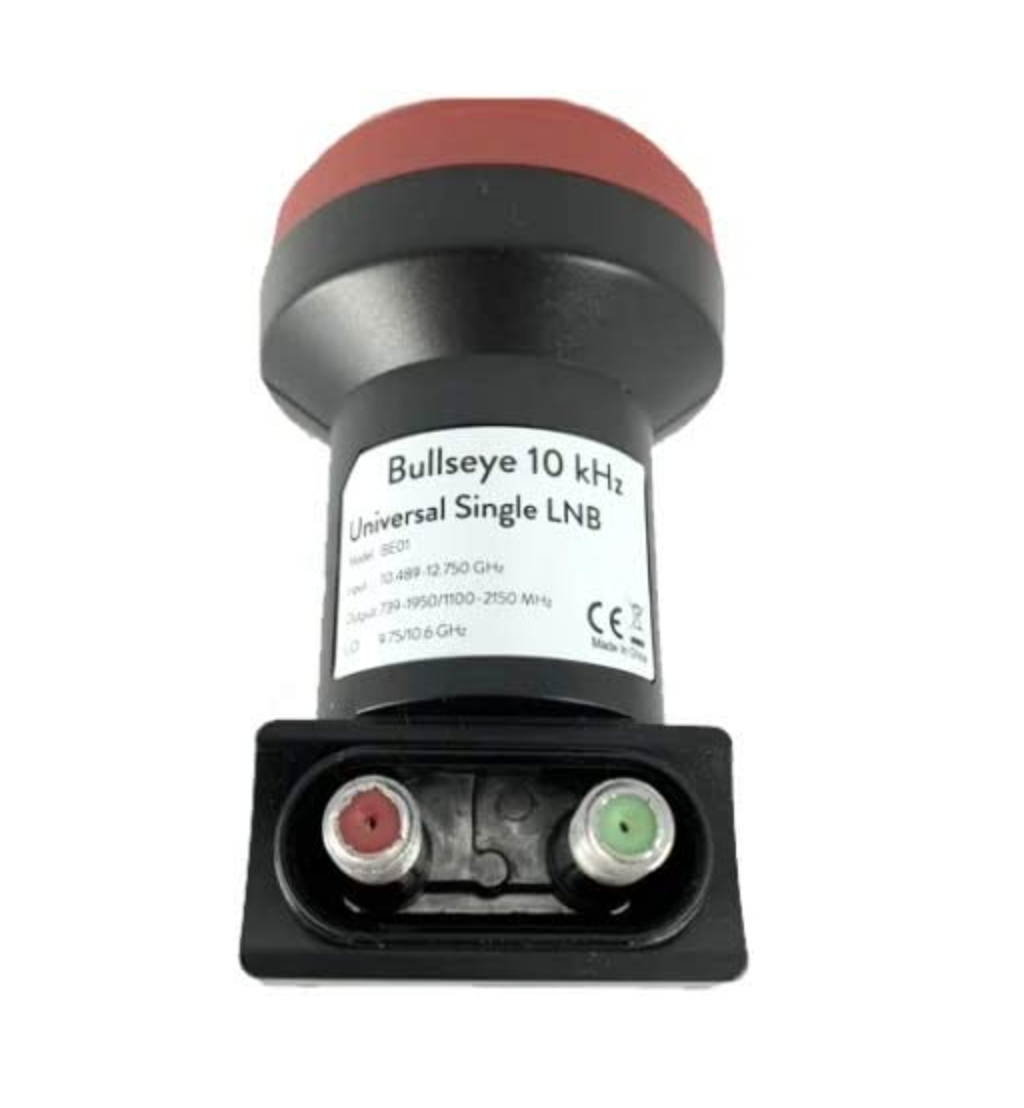
Bullseye 10Khz High Stability Unversal Single LNB for 10.489-12.750Ghz
The receive path starts with a Bullseye LNB, this is a high gain LNB that is probably one of the best you could use for QO-100 operations. It’s fairly stable frequency wise but, does drift a little in the summer months with the high temperature changes but, overall it really is a very good LNB.
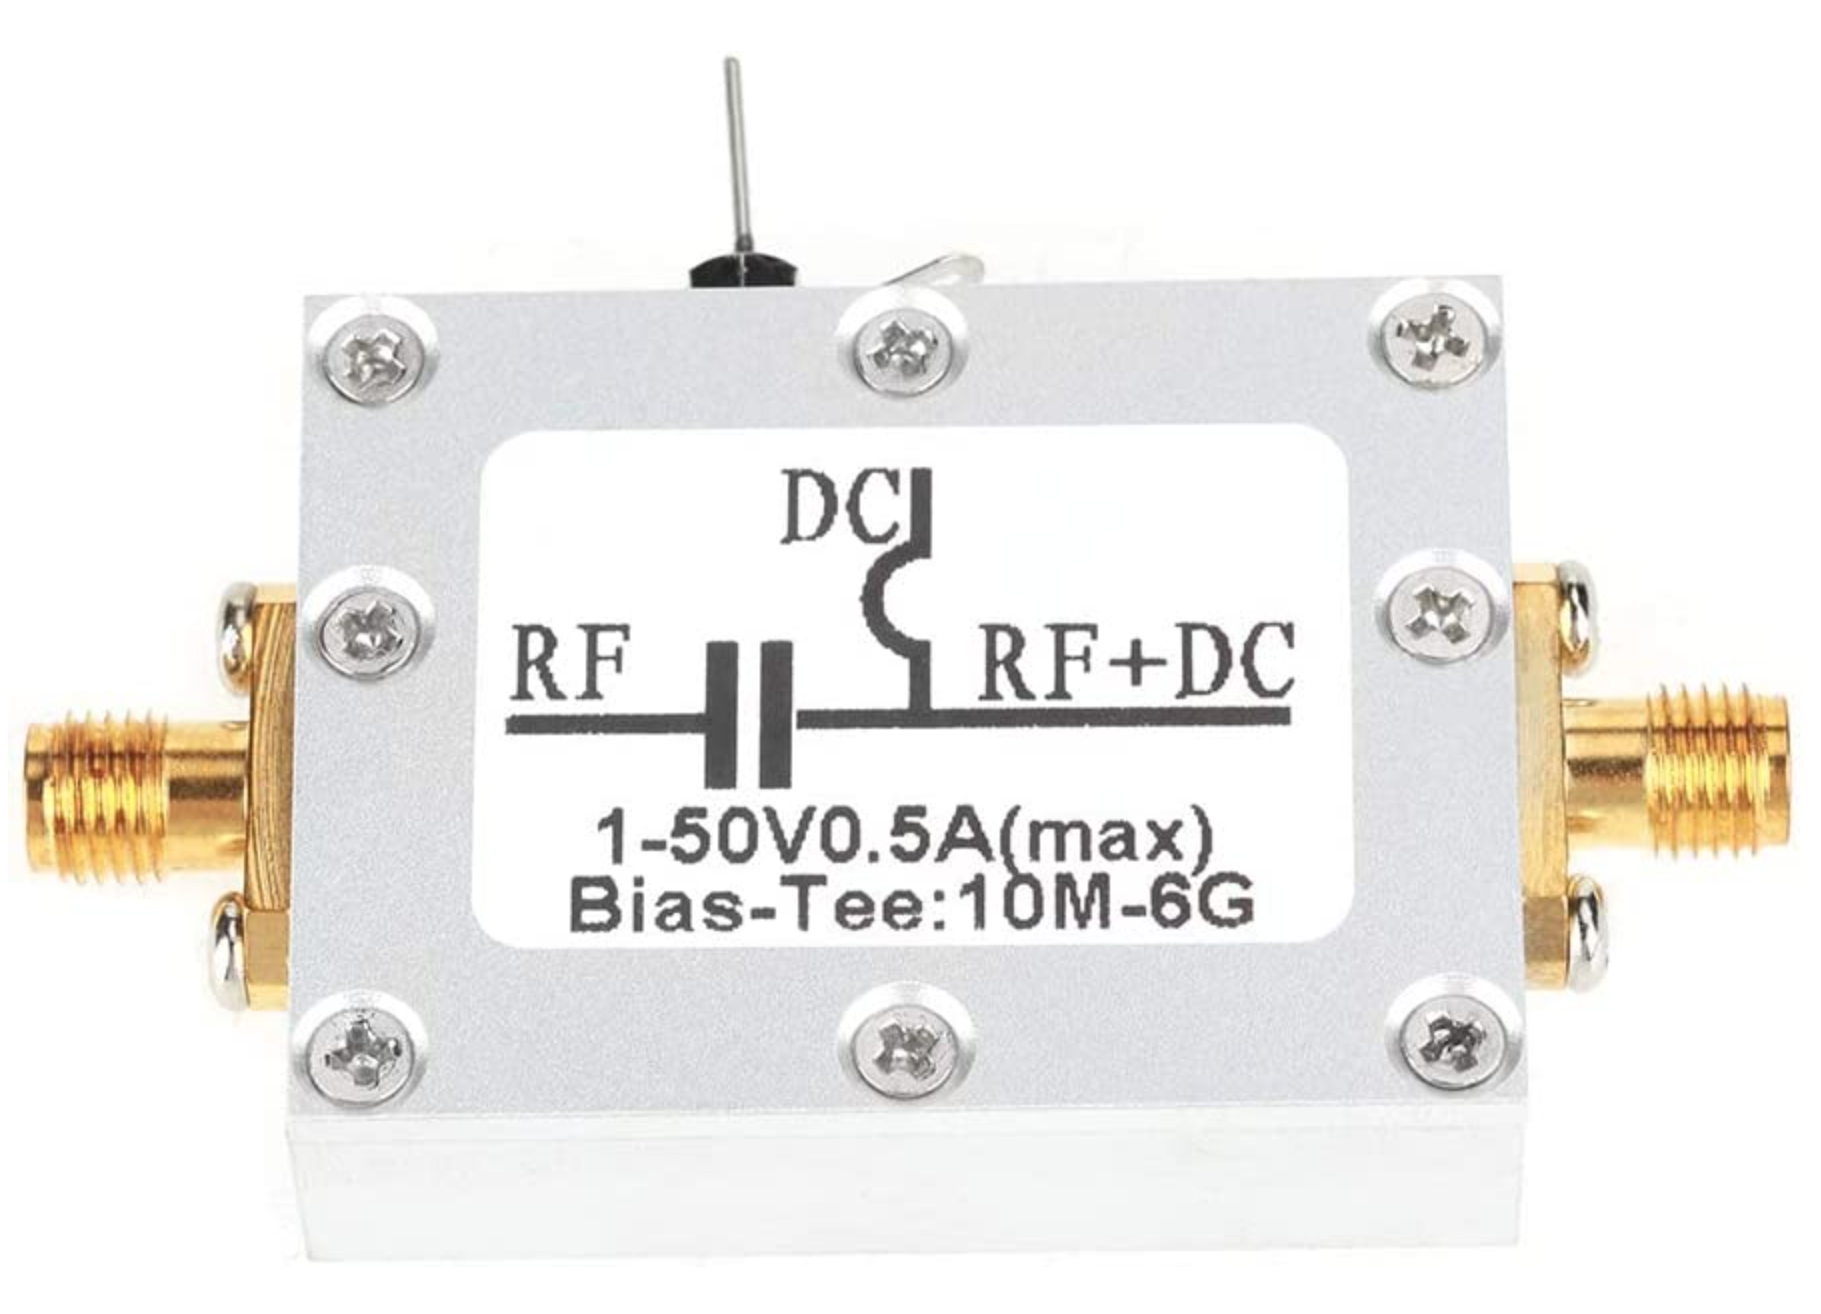
The 12v feed to the LNB is via the coax and is injected by the Bias-T device that is in the radio shack. This 12v feed powers the LNA and associated electronics in the LNB to provide a gain of 50-60dB.
Bias-T to inject 12v feed into the coax for the Bullseye LNB
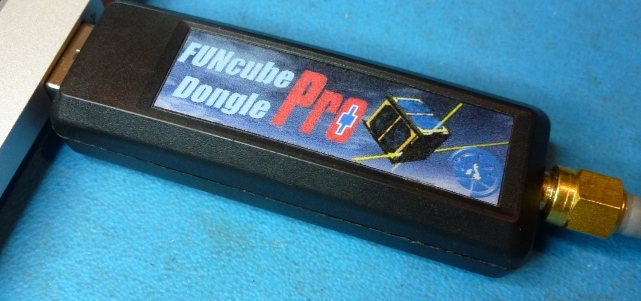
From the Bias-T the coax comes down to the NooElec SmartSDR receiver. This is a really cheap SDR device (<£35 on Amazon) based on the RTL-SDR device but, it works incredibly well. I originally used a Funcube Dongle Pro+ for the receive side however, it really didn’t handle large signals very well and there was a lot of signal ghosting so, I swapped it out for the NooElec SDR and haven’t looked back since.
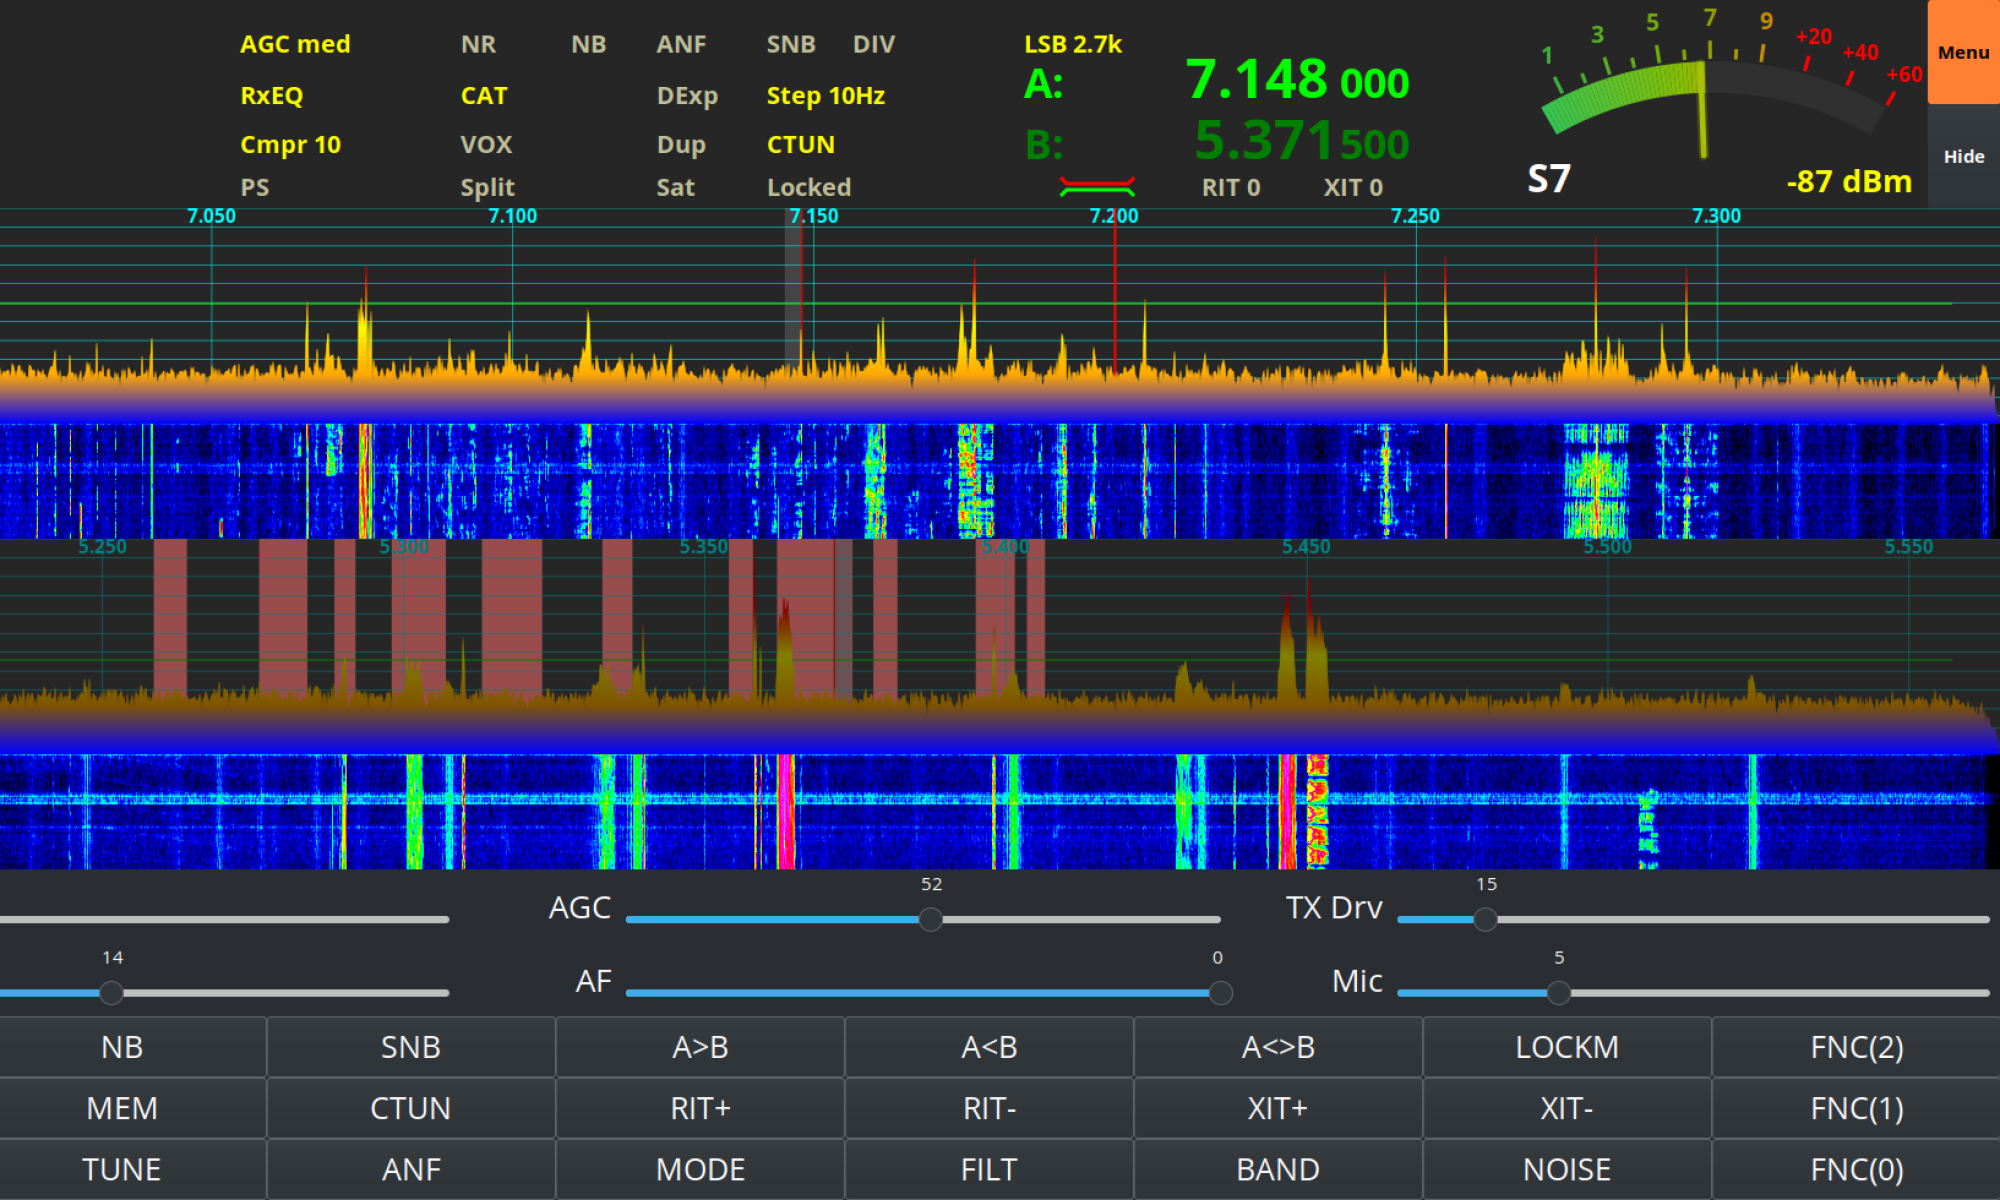
The NooElec SmartSDR is controlled via the excellent Opensource software GQRX SDR. I’ve been using GQRX SDR for some years now and it’s proven itself to be extremely stable and reliable with support for a good number of SDR devices.
To enhance the operation of the SDR device I have added a Griffin Powermate VFO knob to the build. This is an old USB device that I originally purchased to control my Flex3000 transceiver but, since I sold that many moons ago I decided to use it as a VFO knob in my QO-100 ground station. Details on how I got it working with the station are detailed in this blog article.
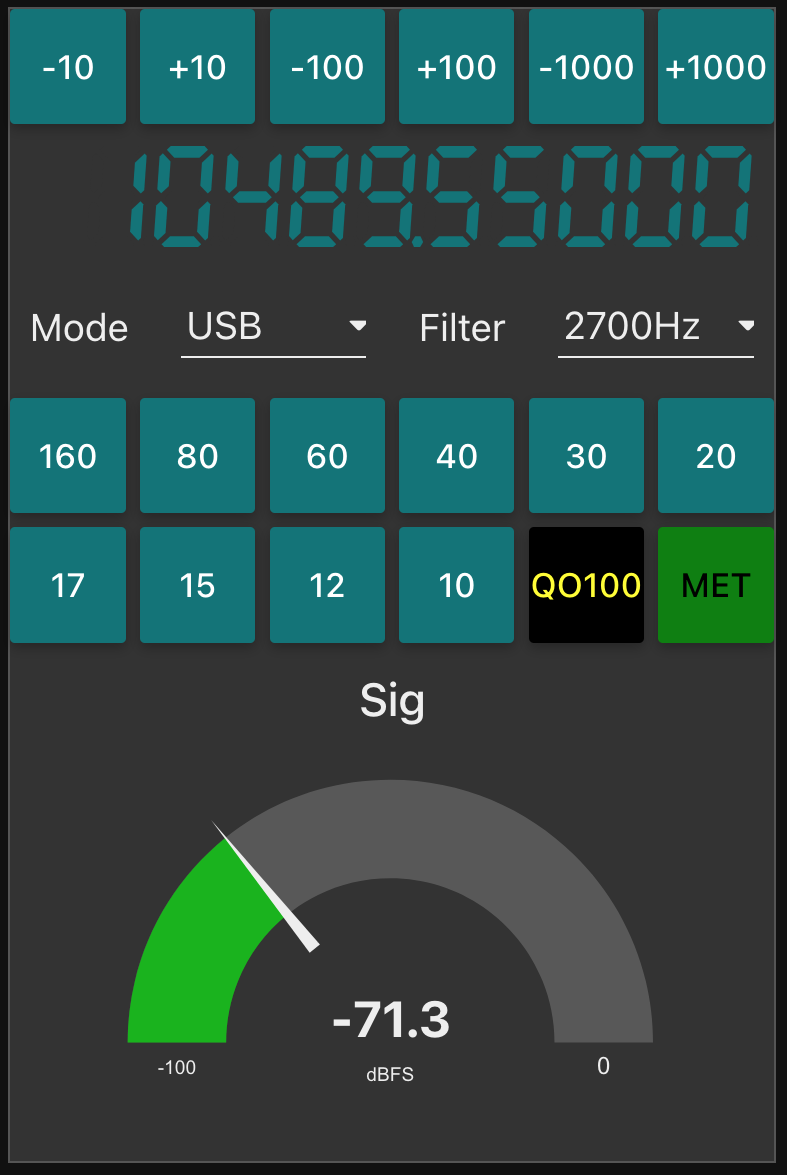
Having the need for full duplex operation on the satellite this complicates things when it comes to VFO tracking and general control of the two radios involved in the solution and so I set about creating a QO-100 Dashboard using the great Node-RED graphical programming environment to create a web app that simplifies the management of the entire setup.
M0AWS QO-100 ground Station Control Dashboard built using Node-RED.
The QO-100 Dashboard synchronises the transmit and receive VFO’s, enables split operation so that you can transmit and receive on different frequencies at the same time and a whole host of other things using very little code. Most of the functionality is created using standard Node-RED nodes. More info on Node-RED can be found on the Opensource.radio Wiki or from the menu’s above.
I’ll be publishing an article all about the QO-100 Dashboard in the very near future along with a downloadable flow file.
I’m extremely pleased with how well the ground station works and have had well in excess of 500 QSO’s on the QO-100 satellite over the last last year.
With the recent explosion of artificial intelligence (AI) art generators that are making the news of late for all the wrong reasons, I decided to see if I could put it to good use and design some futuristic QSL cards.
Having recently been contacted by the Special Callsigns QSL Manager and being advised that there were 18 QSL cards waiting for me, I decided it was time to create some QSL cards of my own for future use.
Having never used any form of online AI and not having any artistic abilities I was amazed how easy it was to create images using nothing more than a paragraph or so of text to describe what it was I wanted to create.
Since all the QSL cards I received were for contacts on the QO-100 satellite, I set out to create a visually futuristic QSL card that was based around a radio HAM operator and satellite communications.
M0AWS – 1st attempt at creating a futuristic QSL card image using AI Art
To my surprise the results of my first image generation were surprisingly good. The AI generated an image that resembled the simple text that I entered, although I never requested a one legged HAM operator!
Pleased with my very first attempt I gradually improved the description of what I was looking for, adding more and more detail to the text and including things that I wanted to see in the image. Over a fairly short period of time this approach started to generate some very interesting images.
M0AWS – AI Art QSL Image attempt 2M0AWS – AI Art QSL Image attempt 3M0AWS – AI Art QSL Image attempt 4
With each iteration I gradually got closer to what I was trying to achieve but, never quite got exactly what I wanted so, I decided to rewrite the descriptive text adding even more information than before. The text was now a full blown paragraph with quite specific things described including the angle at which the scene was being viewed from.
The other option I wanted to try out was the theme functionality that the AI offered. This allows you to set a theme for the image from things like steampunk, cartoon, manga, real world and many more. The results were quite impressive and added yet another angle to the image generation.
M0AWS – AI Art QSL Theme 1M0AWS – AI Art QSL Theme 3M0AWS – AI Art QSL Theme 2
I disappeared down the theme AI Art generation rabbit hole for quite some time and generated some very interesting and fun results. The best by far though was the Thunderbirds themed image, this did put a smile on my face!
M0AWS – AI Art QSL Thunderbirds Themed
At the other end of the spectrum I tried the Salvador Dalli theme, it produced an image that was very like the work of the famous artist but, wasn’t quite what I was looking for.
M0AWS – AI Art QSL Salvador Dalli Themed
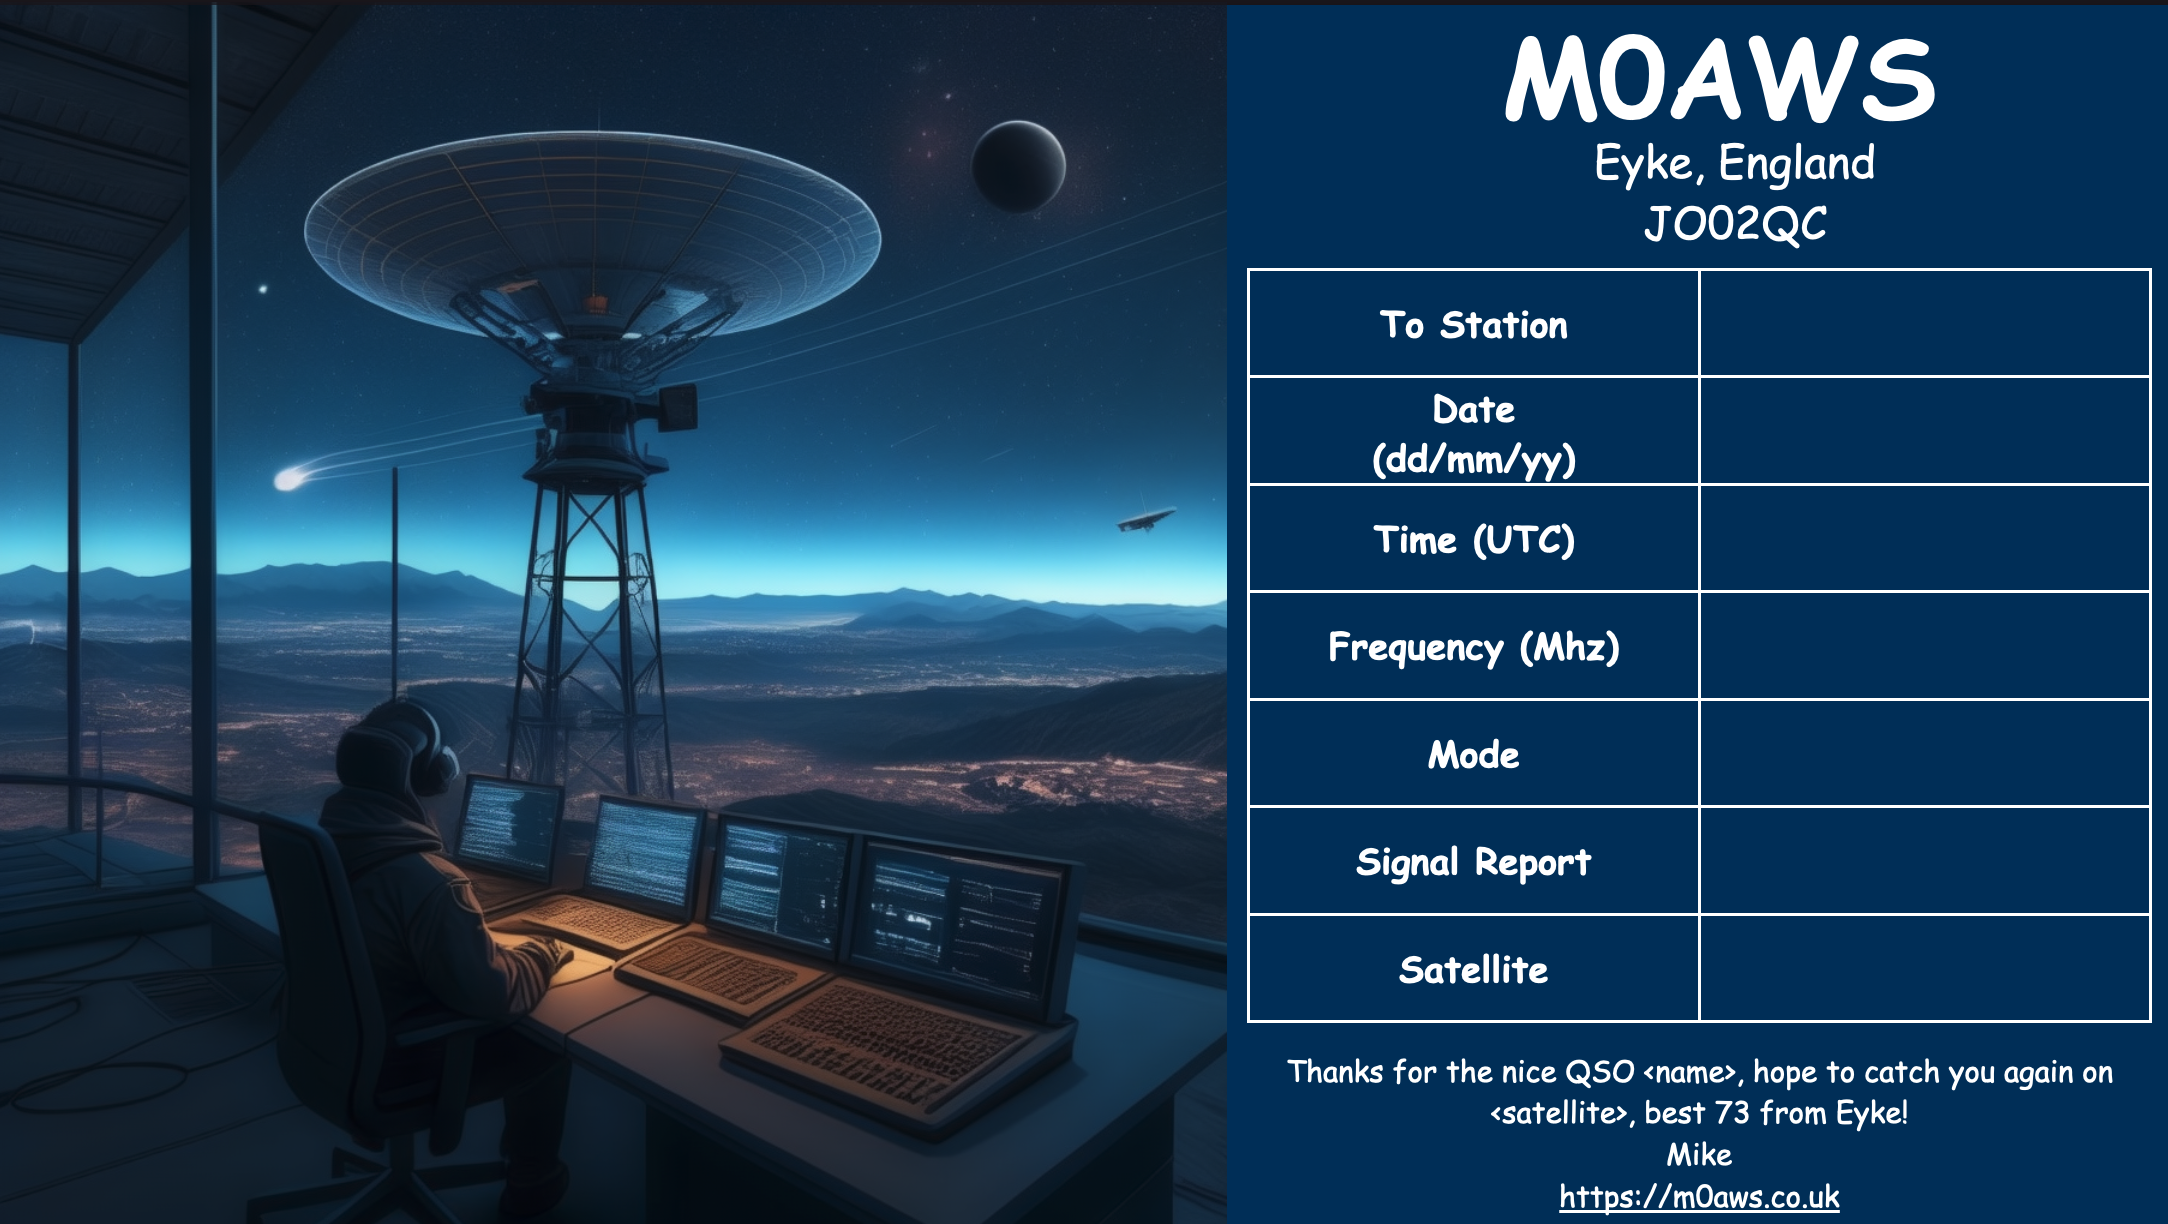
After much fun I eventually settled on the image I was after, a futuristic scene of a radio HAM with a satellite ground station over looking a mountain range and city below.
M0AWS Satellite QSL Card generated using online AI
I’m really pleased with the results from my ventures into AI generated art. The next challenge is to create a QSL card for HF bands Contacts.
This solution has worked incredibly well from the outset and over time I’ve added extra functionality that I’ve found to be useful to enhance the overall setup.
The latest addition to the ground station solution is a Sennheiser Headset that I picked up for just £56 on Amazon (Much cheaper than the Heil equivalents at the HAM stores!) and have found it to be excellent. The audio quality from both the mic and the headphones is extremely good whilst being light and comfortable to wear for extended periods.
M0AWS – Sennheiser SC 165 Headset
To incorporate this into the ground station the headset is connected to my Kubuntu PC and the audio chain to the IC-705 is sent wirelessly using the latest version of WFView. This works extremely well. The receive audio comes directly from the GQRX SDR software to the headphones so that I have a full duplex headset combination.
Audio routing is done via pulse audio on the Kubuntu PC and is very easy to setup.
Since I no longer have a mic connected to the IC-705 directly I found that I needed a way to operate the PTT wirelessly and this is where the latest addition to my NodeRed QO-100 Dashboard comes in.
Adding a little functionality to the NodeRed flow I was able to create a button that toggles the IC-705 PTT state on and off giving me the ability to easily switch between receive and transmit using a simple XMLRPC node without the need for a physical PTT button.
M0AWS – Additional NodeRed PTT Flow
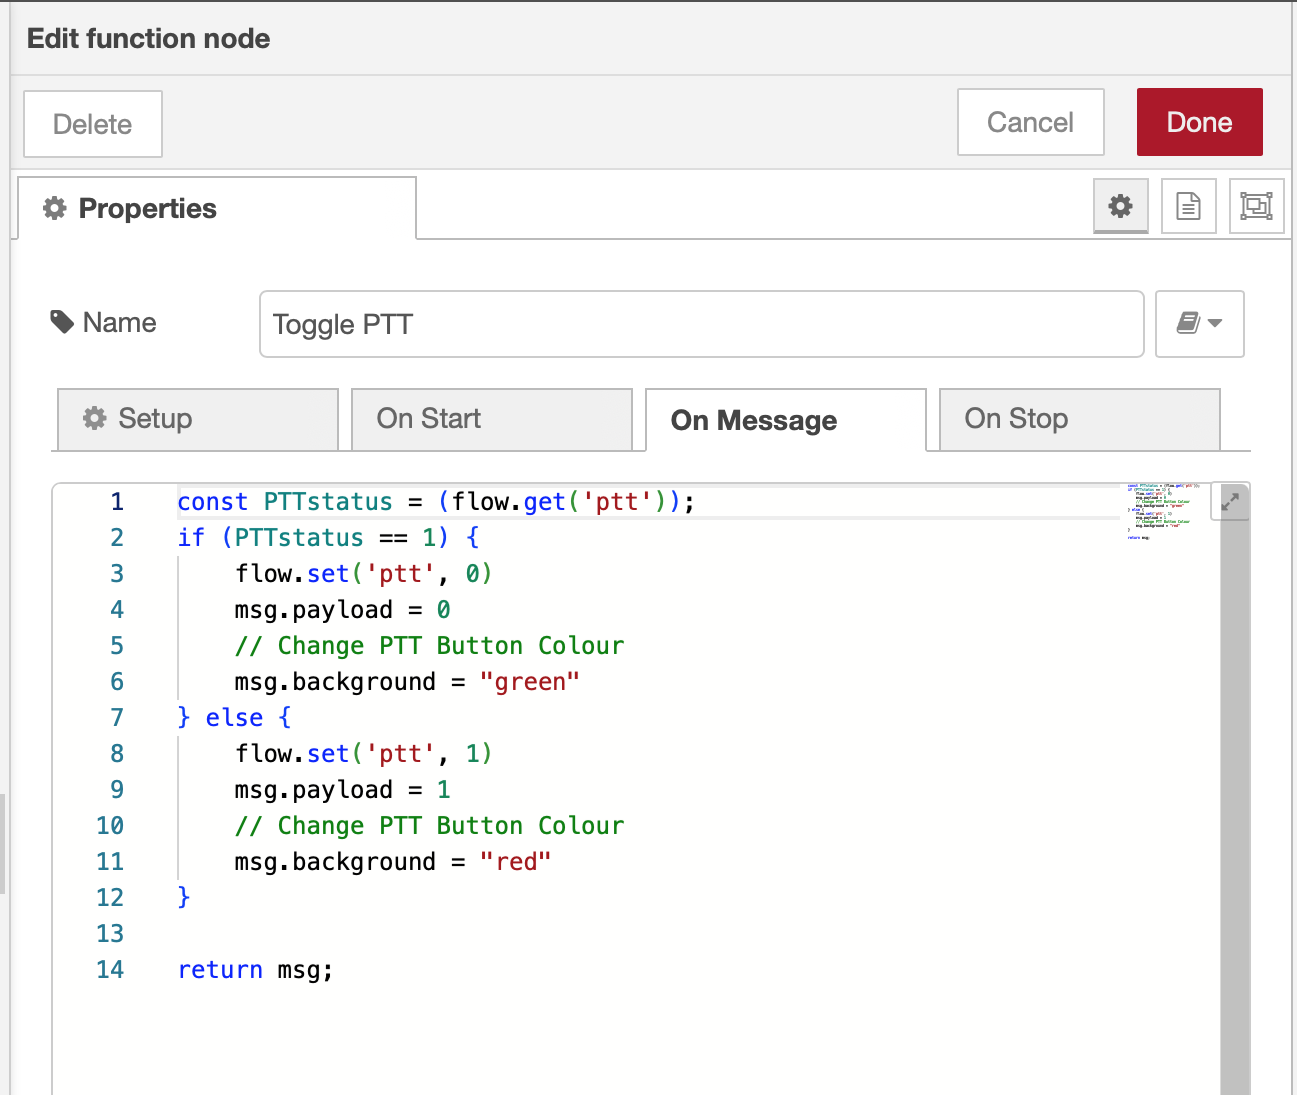
The PTT state and PTT button colour change is handled by the Toggle PTT function node shown in the above flow. The code to do this is relatively simple as shown below.
M0AWS – NodeRed Toggle PTT Function to change button colour
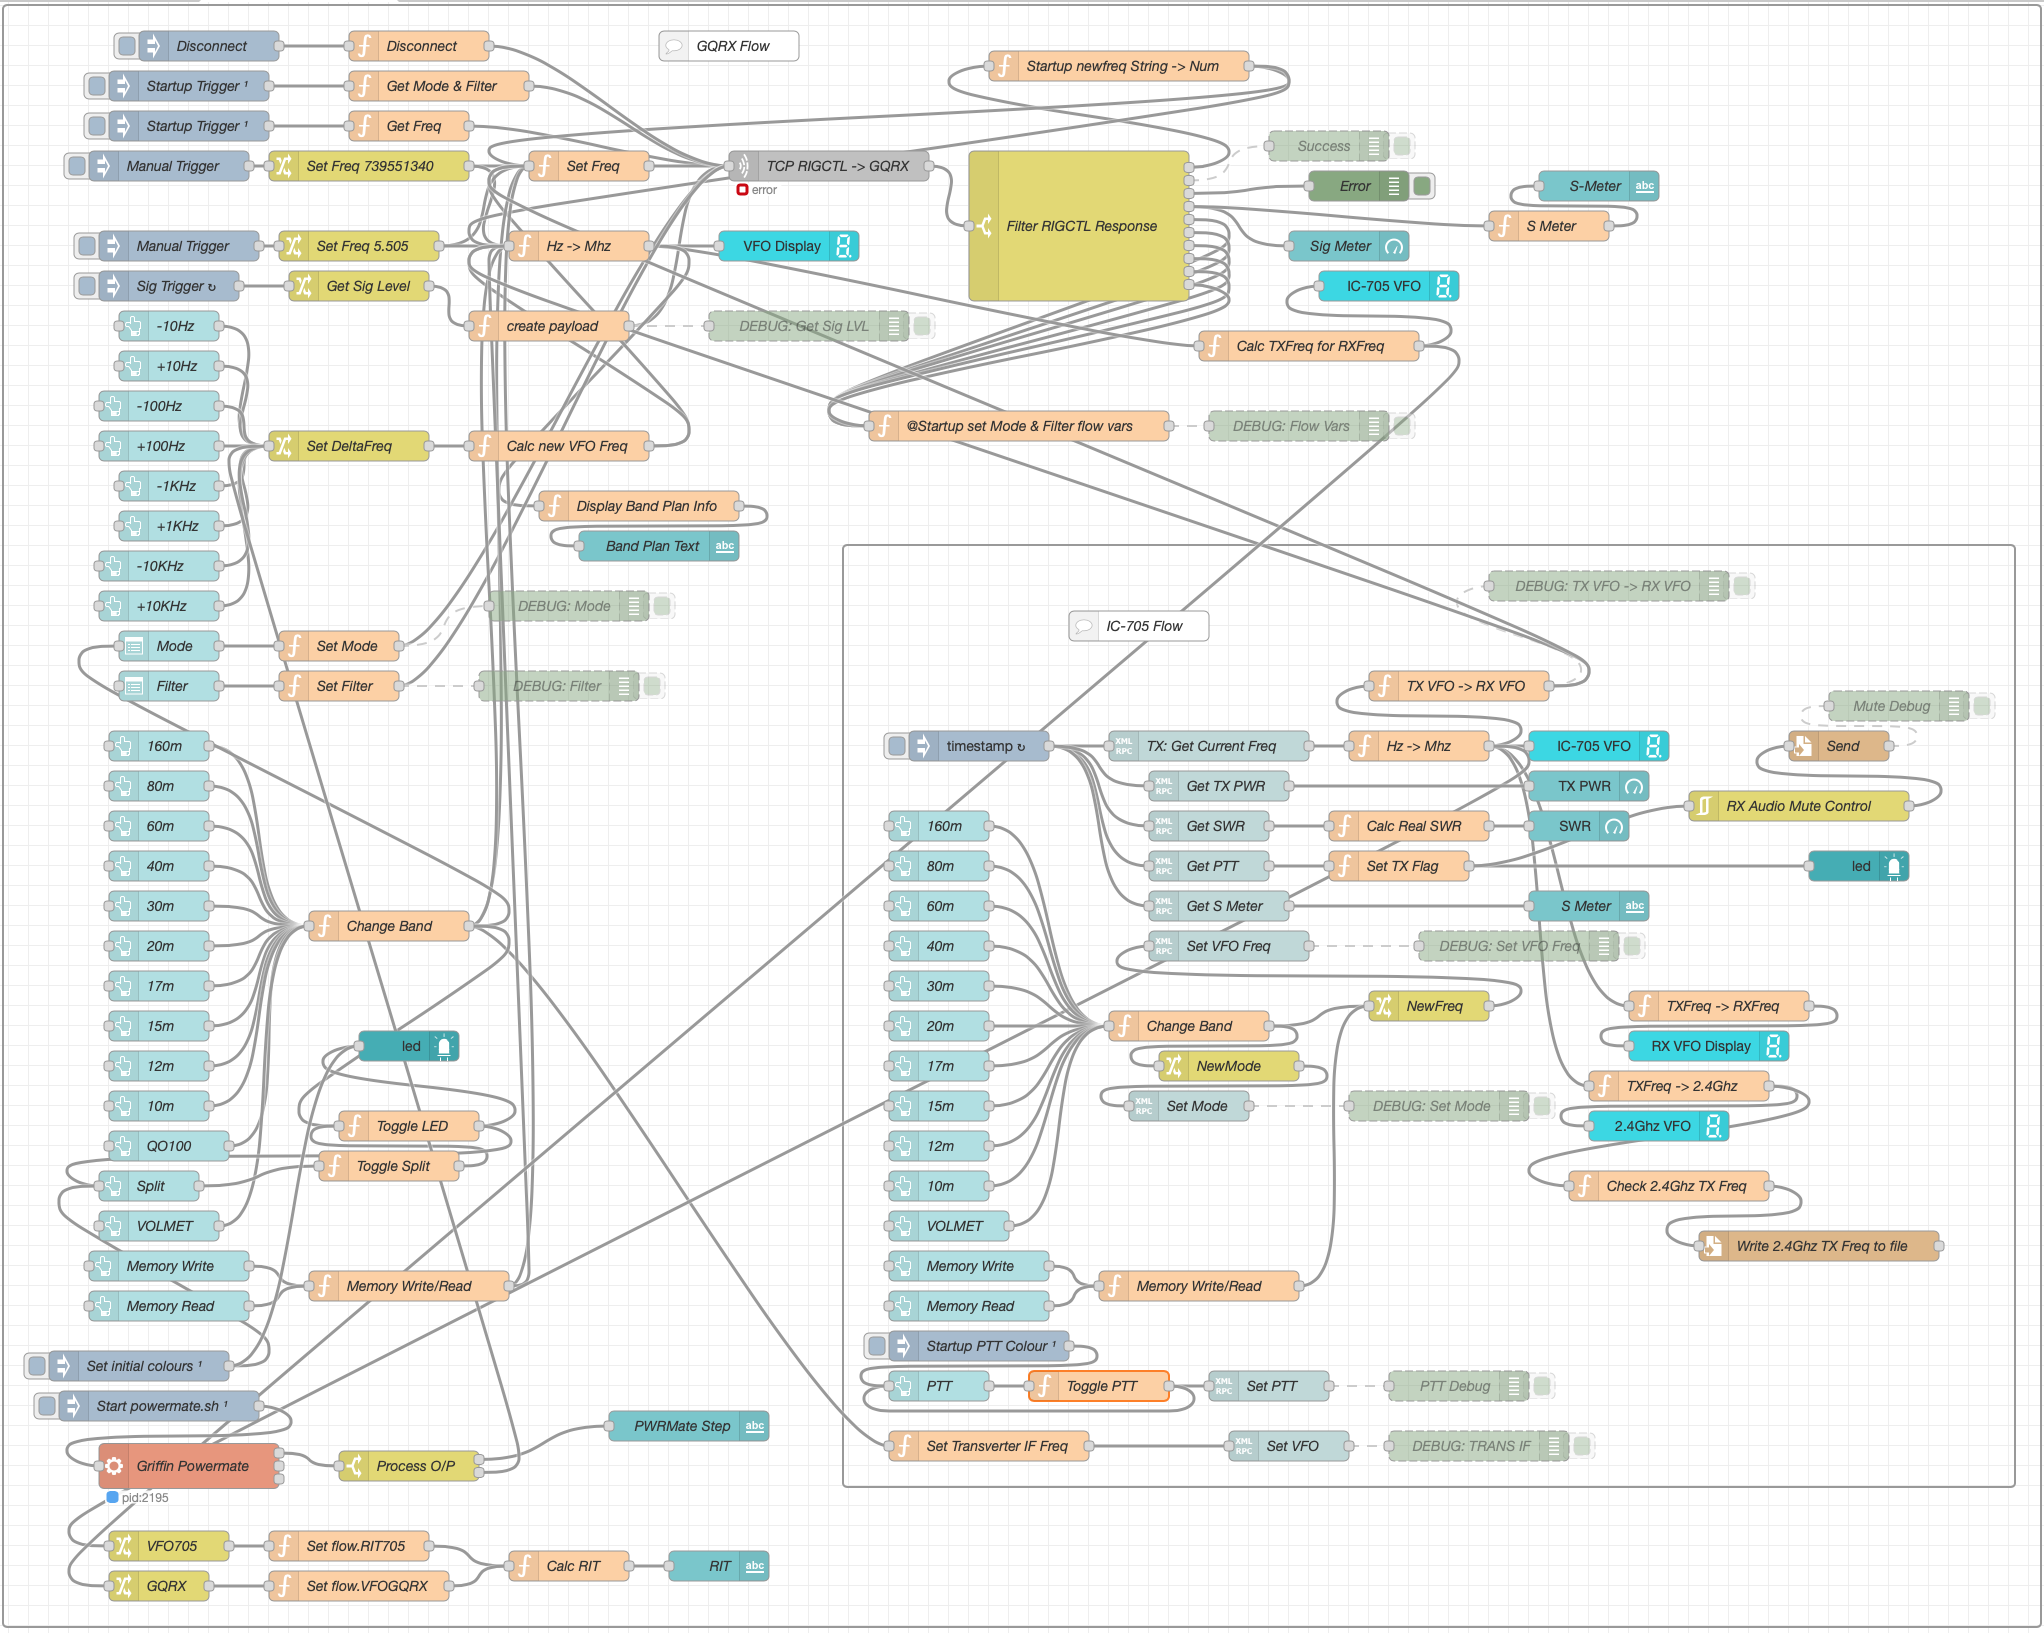
The entire QO-100 Dashboard flow has grown somewhat from it’s initial conception but, it provides all the functionality that I require to operate a full duplex station on the QO-100 satellite.
M0AWS – NodeRed QO-100 Dashboard complete flow
This simple but, effective PTT solution works great and leaves me hands free whilst talking on the satellite or the HF bands when using the IC-705. This also means that when using my IC-705 it only requires the coax to be connected, everything else is done via Wifi keeping things nice and tidy in the radio shack.
M0AWS – Updated NodeRed QO-100 Dashboard with PTT button
The image above shows the QO-100 ground station in receive cycle with the RX/TX VFO’s in split mode as the DX station was slightly off frequency to me. The PTT button goes red when in TX mode just like the split button shown above for visual reference.
As you can probably tell, I’m a huge fan of NodeRed and have put together quite a few projects using it, including my HF Bands Live Monitoring web page.
In my quest to improve my Meshtastic signal range using home-brew antennas I’ve finally put together a neat little ground plane vertical antenna for the 868Mhz ISM band.
The design follows the normal ground plane simplicity using 4 radials and a vertical radiating element albeit on a tiny scale. The radiating element is 82mm long and the radials are each 92mm long.
M0AWS 868Mhz Ground Plane Vertical Antenna
Initially I modelled the antenna at a height of 3m above the ground with the radials tilted downwards at 45 degrees. I took this approach as this is how I have built ground plane verticals for the 70cm band in the past and so I thought I’d try the same approach on the 868Mhz ISM band. (I later found this to be detrimental to tuning!)
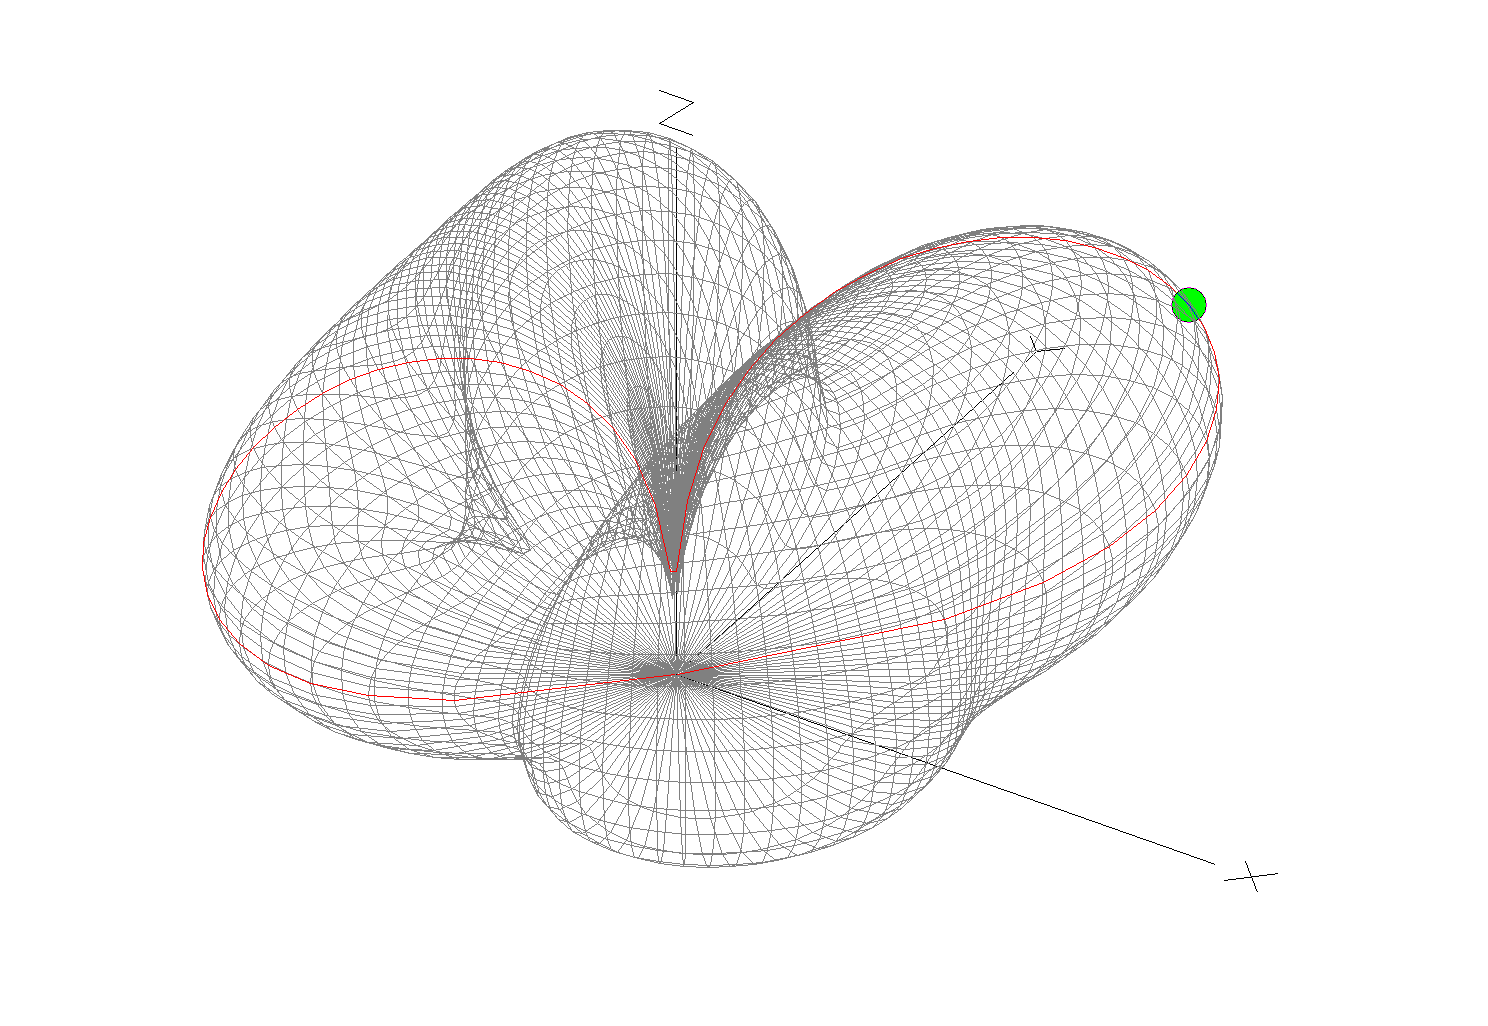
The 3D far field plot for the antenna shows it has a very nice, relatively high gain lobe at just 2 degrees elevation with a number of lower gain lobes higher up.
M0AWS 868Mhz Ground Plane Vertical Antenna 3D Far Field Plot
Looking at the 2D far field plot you can get a better understanding of the radiation pattern and gain figures at various angles. At 2 degrees there is 6.7dBi gain with the next major lobe being at 8 degrees with 4.36dBi gain, far more than I imagined I’d see for such a simple antenna.
M0AWS 868Mhz Ground Plane Vertical Antenna 2D Far Field Plot
Putting the antenna together was easy enough with particular attention being paid to the measurements of both the radials and radiating element. I soldered some lugs to the ends of the 2.5mm diameter solid core wire radials to enable easy attachment to the N Type chassis socket that I decided to use as the base for the antenna. This worked out well and provided a good solid mechanical and electrical connection for the 4 radials.
For the radiating element I used an N Type plug with the vertical 2.5mm solid core wire element soldered to the inner centre pin of the male connector. I also slid a small piece of insulation down the wire to stop it from shorting against the metal outer of the plug and then pushed in a tight rubber plug to stop water ingress.
M0AWS 868Mhz Ground Plane Antenna Close Up
Connecting my VNA I found the antenna was mostly resonant at 790Mhz with an SWR of 2.5:1. I knew this would be the case and that the wires would need a little trimming.
Trimming the wires a couple of times in 1mm nibbles I got the point of resonance up to 868Mhz but, the antenna was still exhibiting a lot of reactance that was keeping the SWR above 2:1. Trimming the radials reduced this slightly but, I could not get an SWR much lower than 1.95:1.
Scratching my head I decided to try moving the radials back up so that they were horizontal rather than at 45 degrees downwards, this had the immediate effect of the SWR dropping to 1.1:1.
M0AWS A rather fuzzy photo of the 868Mhz SWR curve for the GP Antenna
The SWR stays below 1.2:1 from 868Mhz to 871Mhz which is plenty wide enough for the Meshtastic devices. Why there is so much reactance when the radials are bent down at 45 degrees I am not sure, but it was easy enough to resolve.
M0AWS 868Mhz Ground Plane Antenna
The finished antenna is tiny but, seems to work well. Signals from my other nodes are up by 6-9dB according to the SNR reports in the Meshtastic app. I now need to make a couple more of these for my other nodes and then hope to hear some other nodes locally once they appear on air.
Remodelling the antenna in EzNEC with the radials as shown above the gain at 2 degrees is now 5.5dBi, down 1.2dBi but, the overall radiation pattern is identical to the original.
Total cost of the build is about £1 and an hour of my time tinkering with it, bargain!
I’ve been wanting to tidy up the cabling to the 12v DC PSU for some time in the radio shack as like many HAMs I have a number of radios/devices that all need a 12v feed but, only two connectors on the front of the PSU. The net result was a birds nest of wires all connected to the PSU making it impossible to disconnect one device without others getting disconnected at the same time.
Looking online I found that many of the HAM outlets stores sell nice little 12v DC distribution boxes that would be ideal however, they’re all priced somewhat high for what they are so, I decided to purchase the parts and make one myself.
Searching on Amazon I found all the necessary parts for less than a quarter of the cost of commercially made units. A couple of days later the parts arrived and sat on my desk in the shack for a few weeks. Yesterday I finally found the time to make a start on the project.
M0AWS home-brew 12v DC Distribution Box
After much drilling and filing I had the necessary holes/slots cut in the plastic box for the 4mm connectors and fuse holders and started wiring them up. Part way through my 30 year old soldering iron decided to die and so I had to stop and wait for a replacement to arrive.
M0AWS completed 12v DC Distribution Box
With the new soldering iron in hand it only took 30mins or so to complete all the joints and I soon had the box together ready to test with my multimeter to ensure I didn’t have any shorts or crossed wires.
With testing complete and fuses in place I connected it up to the PSU and then connected all the devices one by one checking for voltage drops as I went.
M0AWS 12v DC Distribution Box
I now have my CG3000 remote auto ATU, GPSDO, QO-100 ground station and IC-705 all nicely connected in a much tidier fashion than before, all for considerably less than the commercially available alternatives.
Since I put together my Inverted-L antenna and Pi-Network ATU I’ve been having a lot of fun on the low bands.
Getting back onto 160m has been most enjoyable and I’ve now had over 100 ‘Top Band’ contacts with distances covered as far as 3453 Miles into Sosnovoborsk Asiatic Russia.
I must admit I am amazed at the distances achieved on the 160m band as the antenna isn’t very high above ground level when compared to a single wave length on 160m.
M0AWS Inverted-L Antenna View
The Inverted-L antenna at the M0AWS QTH was designed purely around the size of the back garden. Using a couple of 10m Spiderpoles the vertical section of the antenna is 10m tall and the horizontal section is 28m long. Naturally the antenna resonates around 2.53Mhz but, can be tuned to resonate anywhere on any band using the Pi-Network ATU I built that is situated at the base of the vertical section of the antenna.
Looking at the far field plots for the antenna on each band we see that as we move higher in frequency the radiation pattern becomes more complex and the radiation angle gets lower, exactly what we would expect from such an antenna. The antenna runs pretty much North/South in the garden ( X axis on the diagram above) and so we would expect the antenna to radiate East/West (Y axis on the diagram above) however, this isn’t always the case.
M0AWS Inverted-L Antenna 160m 3D Far Field PlotM0AWS Inverted-L Antenna 160m 2D Far Field Plot
(Click Far Field Plots for full screen view)
On 160m the antenna favours the South (-X Axis) and presents some usable high angle gain although, from using the antenna you would never know this to be the case as it seems to have pretty good all round coverage. With the best distance of 3453 Miles being covered to the East into Asiatic Russia the antenna performs well even though the far field plot is slightly biased to the South.
M0AWS Inverted-L Antenna 80m 3D Far Field PlotM0AWS Inverted-L Antenna 80m 2D Far Field Plot
On the 80m band the Inverted-L antenna becomes a cloud warmer and exhibits very high angle radiation. On 80m the antenna is ideal for NVIS Inter-G propagation and is great for rag chewing with other UK/Near EU stations.
M0AWS Inverted-L Antenna 60m 3D Far Field PlotM0AWS Inverted-L Antenna 60m 2D Far Field Plot
Looking at the far field plots for the 60m band once again the antenna provides lots of high angle gain however, there is also some very useable lower angle gain that has proven to be excellent for working long hauls into North America and east into Central Asia. On the 60m band during the day the antenna is excellent for Inter-G chatting, using just 20w-40w I can very easily chat with other UK HAMs even when the band is noisy.
M0AWS Inverted-L Antenna 40m 3D Far Field PlotM0AWS Inverted-L Antenna 40m 2D Far Field Plot
Moving on up to the 40m band we find the far field plot starts to get a little more complex. Looking at the 3D plot you’d think that the antenna favoured the South (-X Axis) however, in reality it favours the NorthWest with both some high and low angle gain. This antenna has proven to be excellent for DXing into North America on 40m but, has also been great for DXing into South America getting great signal reports from stations in Panama at a distance of 5415 Miles. During the day NVIS propagation is excellent and I find I can chat with other UK and near EU stations with ease using just 25w.
M0AWS Inverted-L Antenna 60m/40m Global Coverage
Above is a screen shot from PSKReporter showing stations that have heard me on the 40m and 60m bands. As you can see, global coverage is excellent with stations as far as Australia and New Zealand hearing me on the 40m band and stations on the West Coast USA hearing me on the 60m band. I was also pleased to see I was heard in Africa on both bands, a region of the world I would like to get more contacts from.
M0AWS Inverted-L Antenna 30m 3D Far Field PlotM0AWS Inverted-L Antenna 30m 2D Far Field Plot
On the 30m band the Inverted-L antenna starts to exhibit two lobes with gain to the NorthEast and NorthWest. This makes the antenna ideal for working into the USA and Australia/New Zealand over the North Pole. Working US stations is a breeze with relatively low power and I almost got a contact with New Zealand during the evening greyline but, unfortunately the DX station dropped out before I managed to get my signal report back to him. As time goes on I’m sure the antenna will more than prove itself on the 30m band.
So far I’ve not ventured above the 30m band with the Inverted-L antenna as I’ve really been enjoying access to Inter-G chats on 80m, 40m and 60m and chasing DX on 160m, 60m, 40m and 30m. I need to venture up onto the higher bands before the long winter nights settle in and the higher HF bands close for the winter season.
Looking at the far field plots on the higher HF bands the antenna has huge potential as it provides some nice low angle radiation in useful directions.
M0AWS Inverted-L Antenna 20m 3D Far Field PlotM0AWS Inverted-L Antenna 20m 2D Far Field Plot
On the 20m band the far field plot starts to get much more complex with lobes at many different angles. The main gain lobe is to the NorthEast towards the USA and is at a fairly low angle and so this antenna should be great for working stateside on the 20m band. There are also lobes to the NorthEast and so hopefully working VK/ZL over the pole should also be possible. As I said above I’ve not yet used the antenna above the 30m band and so at this time cannot confirm performance but, it looks promising.
M0AWS Inverted-L Antenna 17m 3D Far Field PlotM0AWS Inverted-L Antenna 17m 2D Far Field Plot
The 17m band also looks promising with a similar far field plot as the 20m band but, with lower angle of maximum radiation and more gain. It will be very interesting to test this antenna on 17m especially since the noise level is below S0 and I can very easily hear the weakest of stations on this band.
M0AWS Inverted-L Antenna 15m 3D Far Field PlotM0AWS Inverted-L Antenna 15m 2D Far Field Plot
Once again the 15m band looks very similar to the 17m band, low angle radiation but, with a slightly more complex far field plot.
M0AWS Inverted-L Antenna 12m 3D Far Field PlotM0AWS Inverted-L Antenna 12m 2D Far Field Plot
The 12m band far field plots continue the theme with the angle of maximum radiation slightly lower than on the 15m band and slightly more gain. This antenna should be great for chasing the DX on the very quiet 12m band.
M0AWS Inverted-L Antenna 10m 3D Far Field PlotM0AWS Inverted-L Antenna 10m 2D Far Field Plot
Finally the 10m band is very similar to the 12m band in that the far field plots show low angle gain albeit with an even more complex radiation pattern.
I originally put this antenna up so that I could work Inter-G on the low bands but, it has proven to be a much more worthy antenna than I originally thought it would be. I need to spend more time with this antenna on the bands above 30m to really see how it performs on the higher HF bands but, so far I’m really pleased with it’s overall performance on all the bands tested to date.
I can highly recommend using FT8 to test new antennas. With PSKReporter and my own NodeRed World Map WSJT-X interface I can see realtime the antenna performance on each band. FT8 is an extremely useful tool when it comes to testing antennas to see if they perform as per the modelling and can often provide some performance surprises!
For some time now I’ve been using my Funcube Dongle Pro+ (FCD) as my QO-100 downlink receiver. It’s worked fairly well and has given me the ability to listen to stations on the satellite over the last few months.
During this time I have noticed a couple of things about the FCD that has lead me to the final decision to change to a new SDR device.
The first of these ‘things’ is the fact that the FCD gets seriously overloaded when there are multiple large SSB signals within the receive pass band. The only way to manage this is to constantly keep changing the software based AGC, mix and LNA settings to reduce the levels of the incoming signals so that the overloading stops. This is great except when you tune to a quiet part of the satellite transponder you have to turn all the settings back up again to be able to hear the weaker signals. After a while this becomes tiresome.
The fact that there isn’t a hardware AGC in the FCD is a major drawback when being used for satellite reception especially when it’s on the end of a very high gain LNB and dish antenna.
The second of these ‘things’ is the fact that I can’t see the whole transponder bandwidth at one time with the FCD as it has a very small receive bandwidth capability. This means that I am constantly tuning up and down the transponder to see if there are any stations further up or down in frequency.
Funcube Dongle Pro+
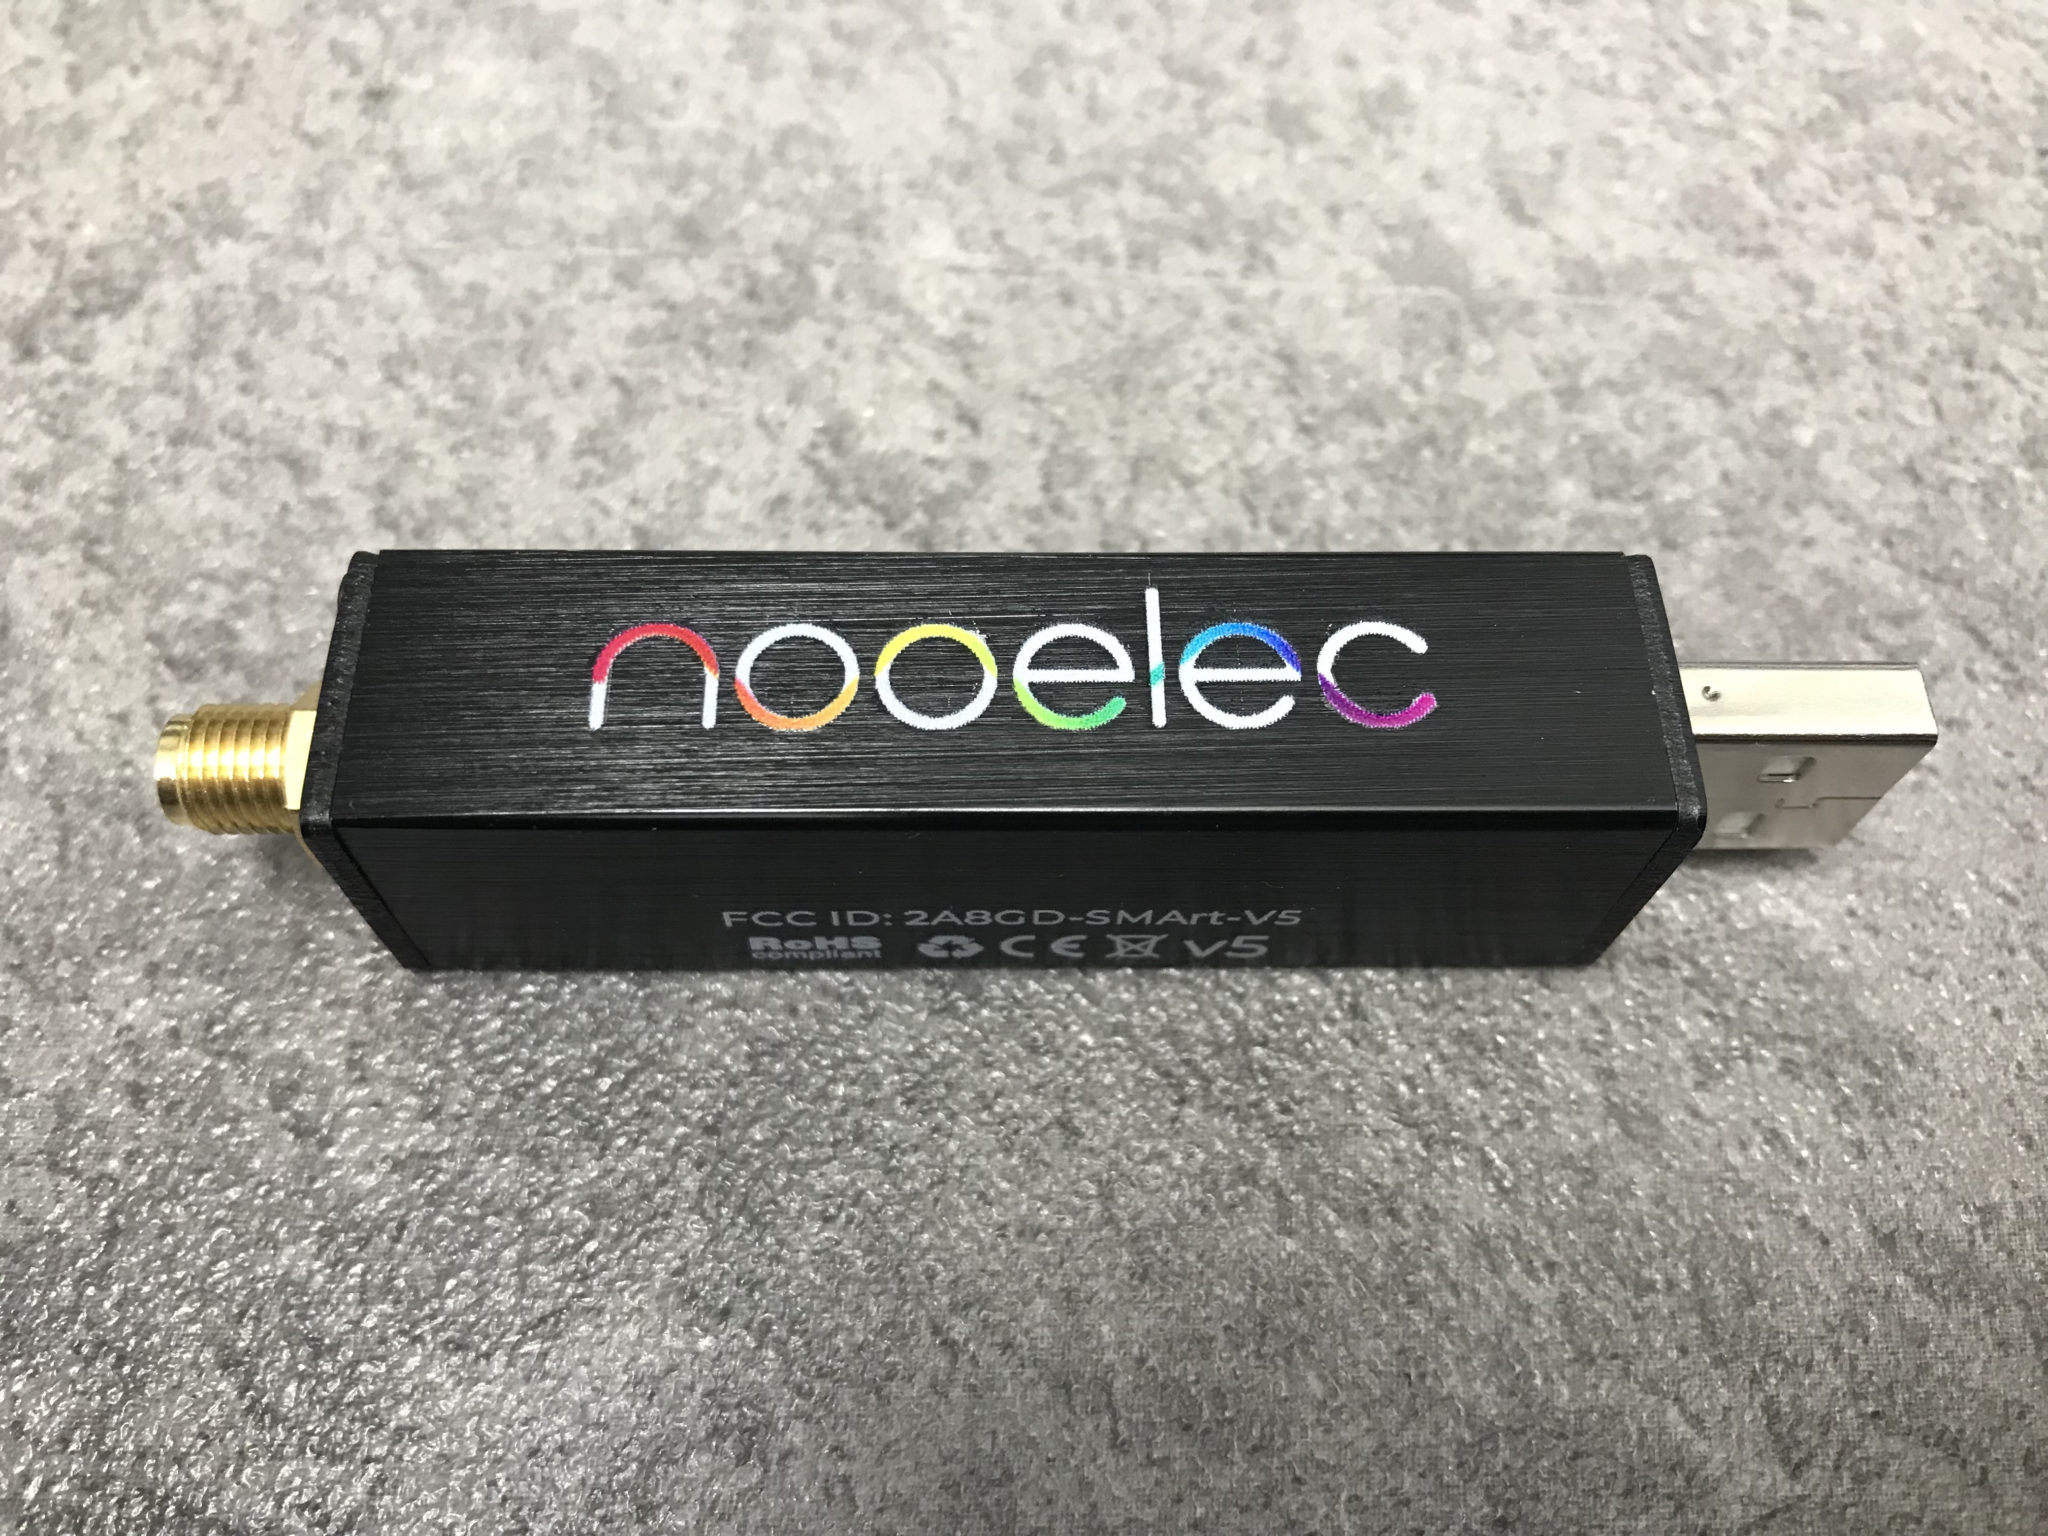
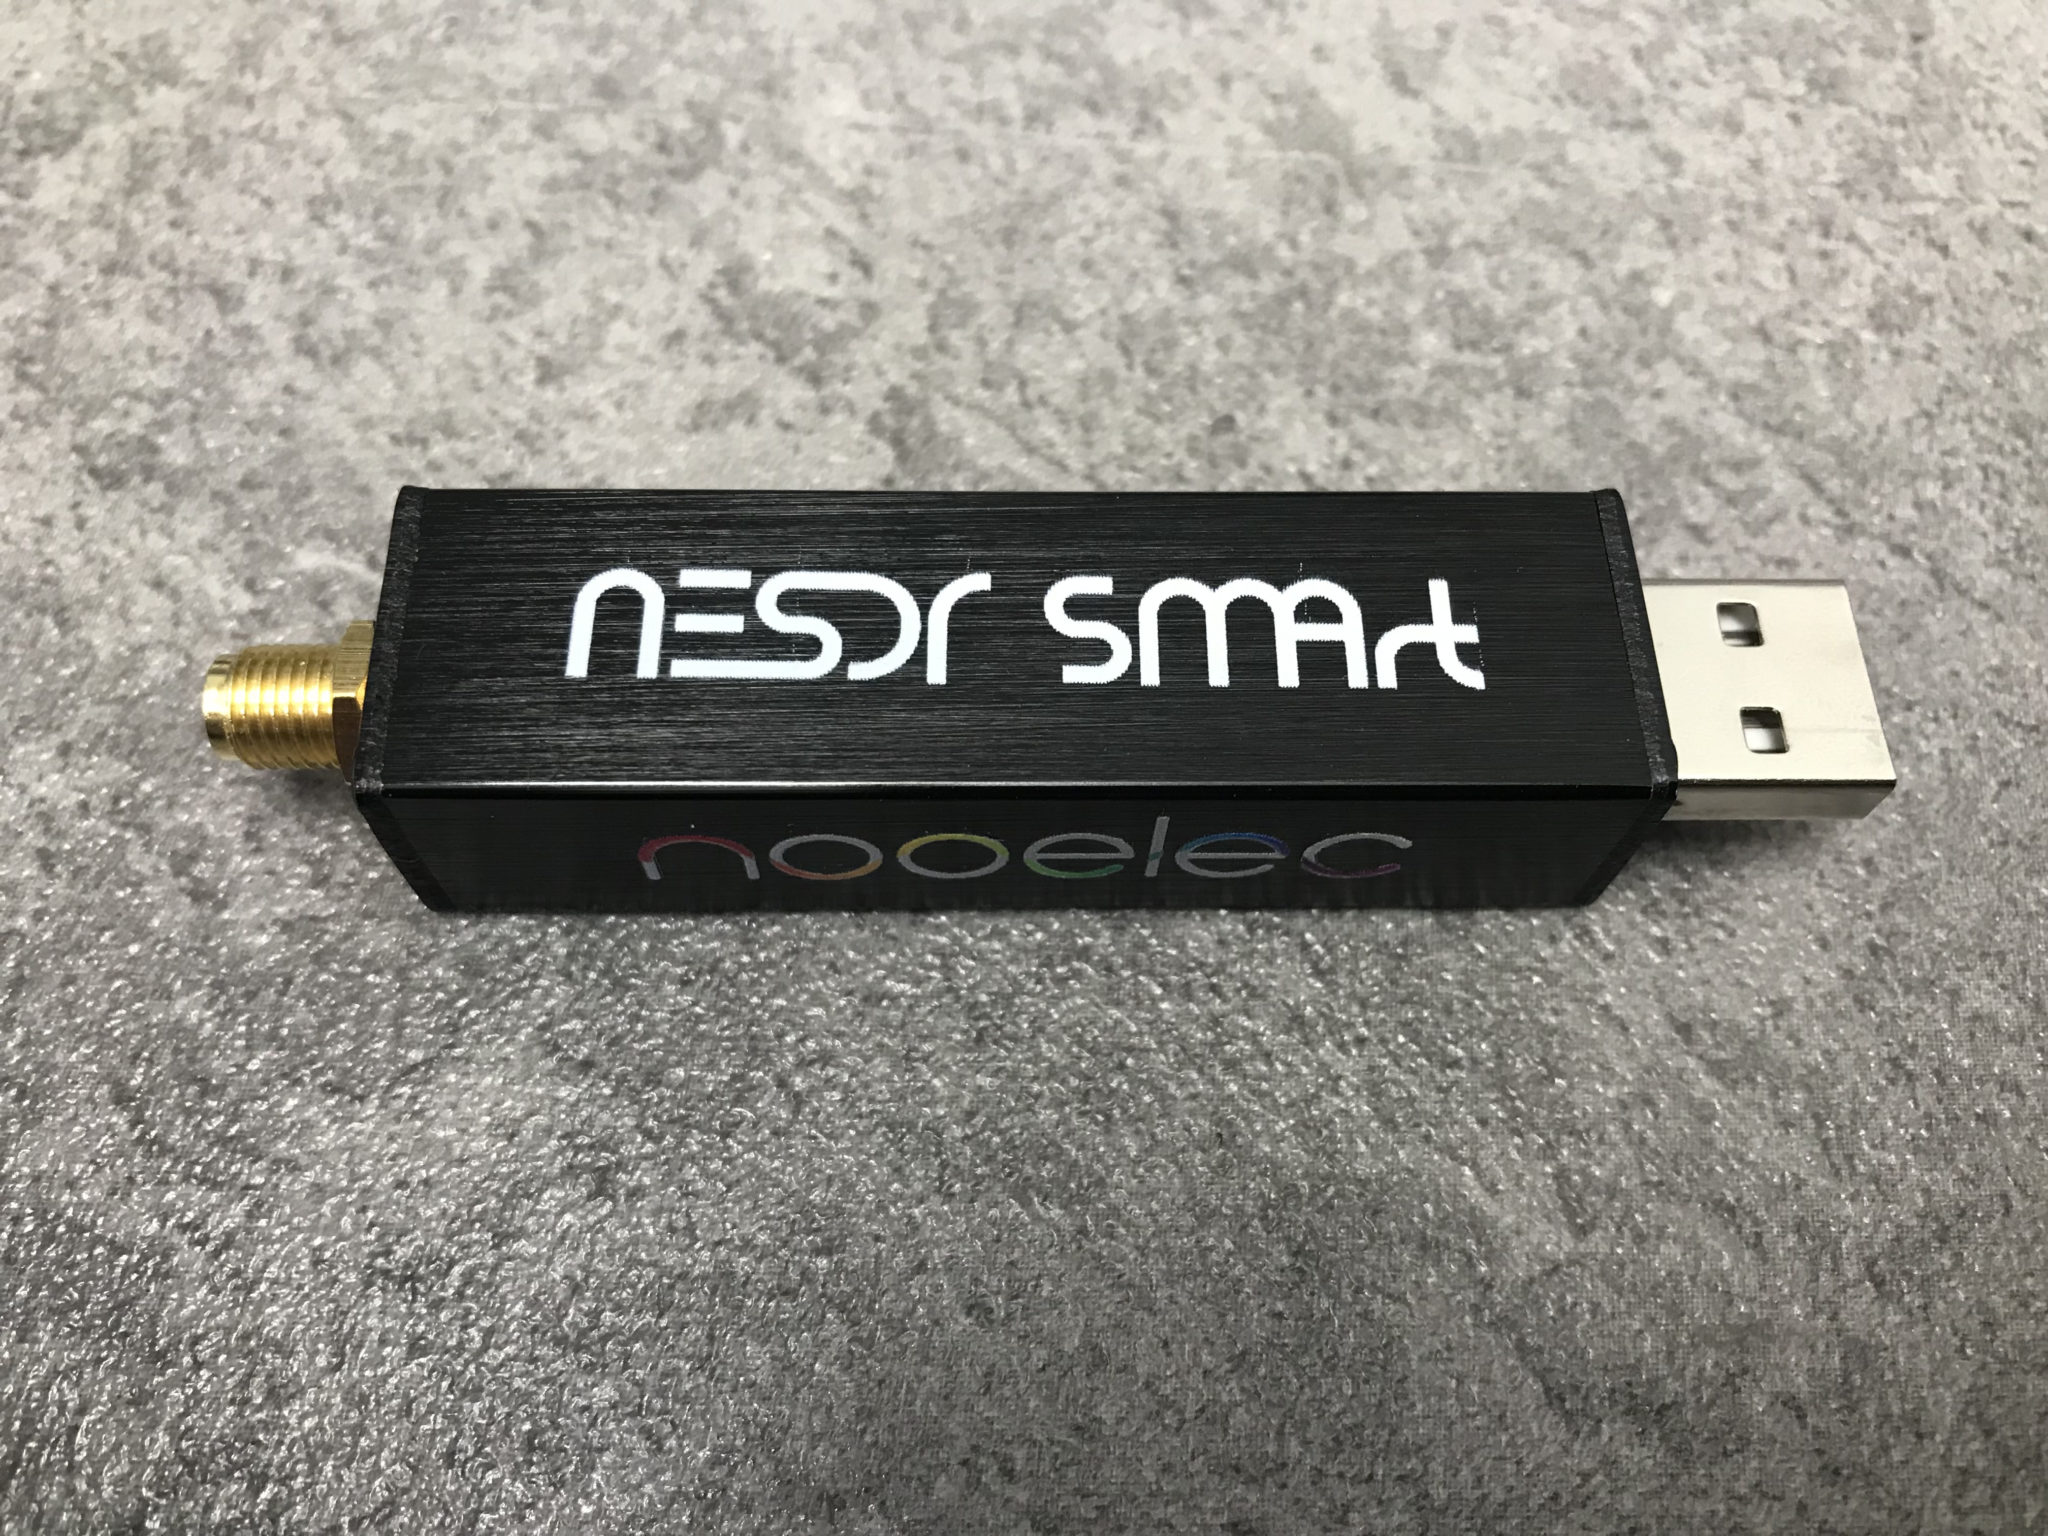
Talking to more experienced satellite operators in the Matrix Amateur Radio Satellites room they recommended replacing the FCD with a NooElec NESDR SMArt v5 that has hardware AGC and is capable of receiving and displaying a much wider bandwidth.
Looking on Amazon the NooElec NESDR SMArt v5 is only £33 so I decided to place an order for one and give it try.
In typical Amazon style the SDR receiver arrived the next day and I wasted no time getting it plugged in and connected to the QO-100 ground station.
The NESDR SMArt v5 is based on the well known RTL-SDR that came onto the market some time back but, has a number of improvements in it that take it to the next level.
The first thing that I was happy with was the fact that the GQRX SDR software I use recognised it immediately on startup, no configuration or drivers were required it just worked, straight out of the box. Since I use Kubuntu Linux on my radio room PC I did wonder if I would need to get into installing extra libraries etc but, thankfully none of that was required.
Looking at the signals from the QO-100 satellite initially they appeared to be nowhere near as strong as they were on with the FCD. Looking at the settings in GQRX I noticed that the hardware AGC was off and the LNA setting was back to it’s default very low level.
I switched on the AGC and then increased the LNA setting to 38.4dB and found that the signals were now plenty strong enough on the display but, not overloading the receiver.
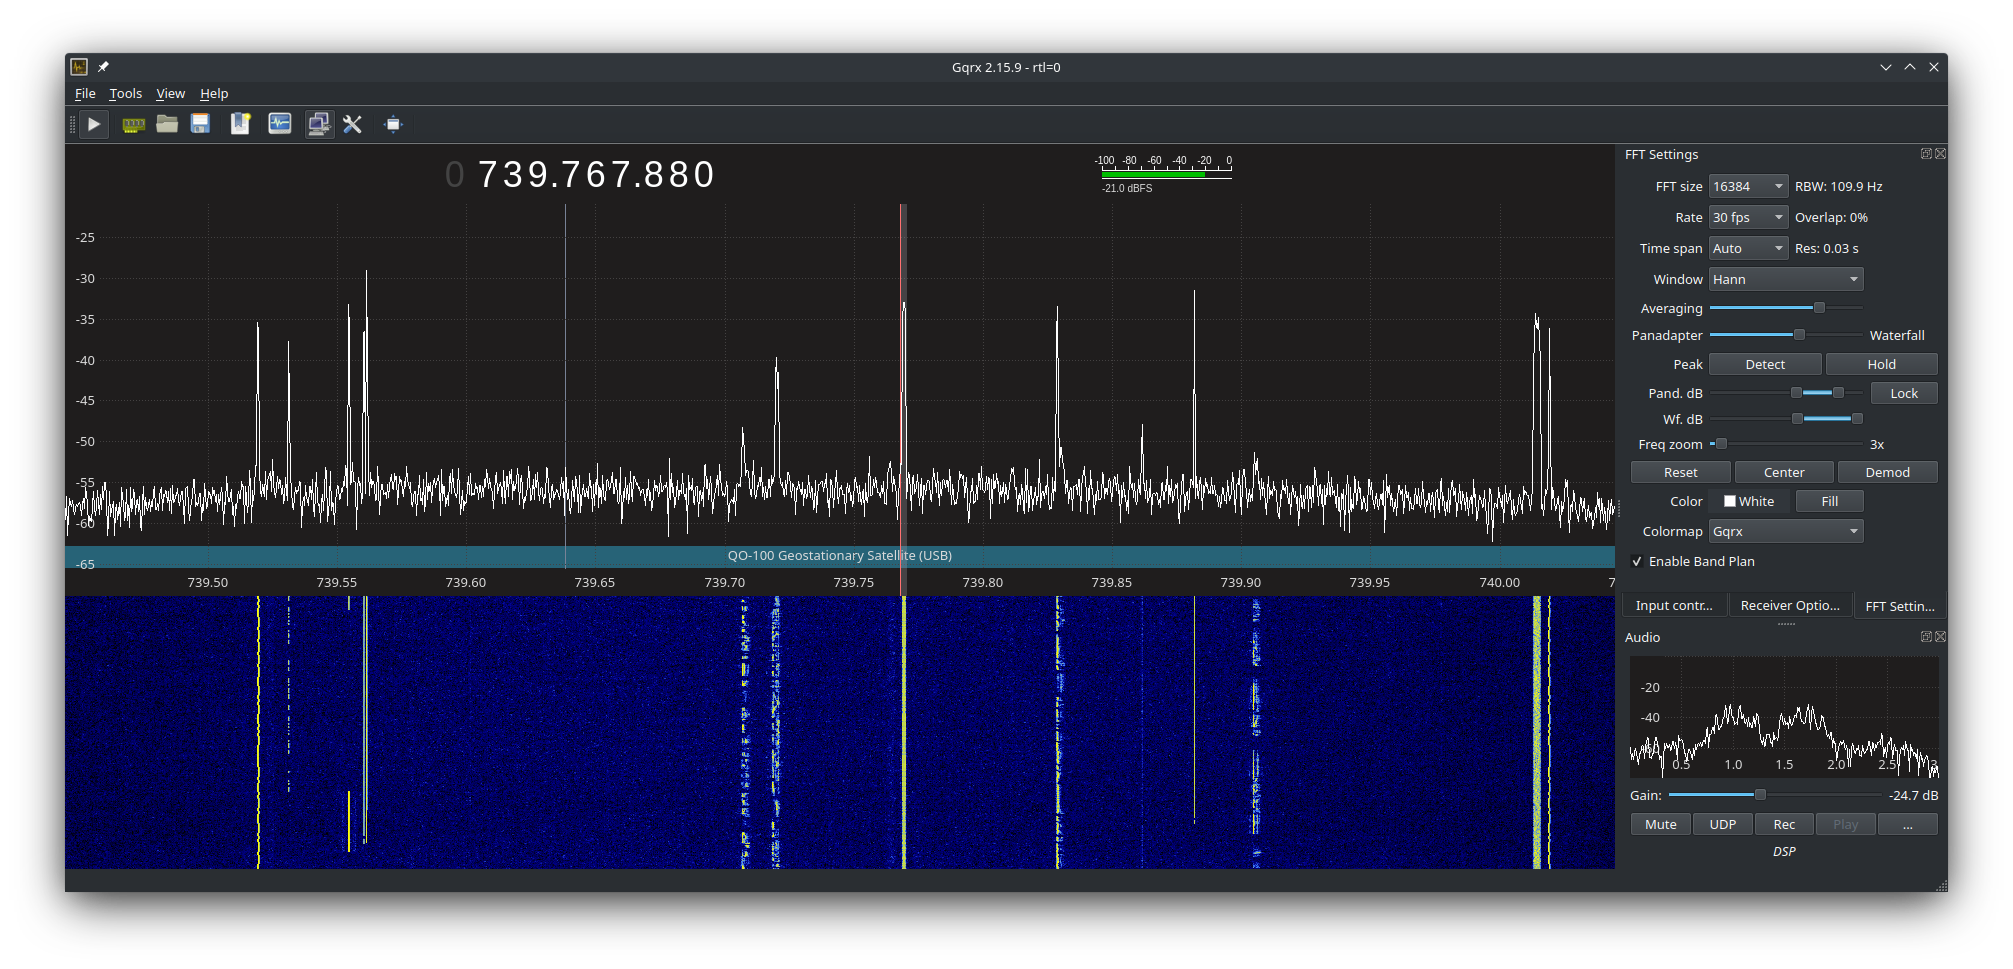
I then went on to adjust the display so that I could see the whole satellite transponder bandwidth on the screen. This is great as it enables me to see the low, middle and high beacons that mark out the narrow band section of the transponder and at a glance see all the stations using the satellite. This was a massive improvement in itself and one that I am very pleased with.
NooElec v5 SDRNooElec v5 SDR
Using the NooElec NESDR SMArt v5 SDR it very soon became clear that it copes with multiple large signals in the pass band so much better than the FCD did. There’s no more overloading of the receiver, no more ghost signals appearing on the waterfall due to the front end not being able to cope and no more having to constantly keep playing with the settings to get things under control. The hardware AGC built into the SDR device does a great job at keeping it all under control whilst receiving a much wider bandwidth than the FCD ever could.
The satellite beacons are now received at S9+15dB without the receiver being overloaded, the first time I have seen this since starting out on my QO-100 venture.
The other thing that became obvious very quickly is that frequency stability is much better than it was with the FCD, it doesn’t drift up and down the transponder now and stays tuned exactly where I put it. It’s also on frequency whereas, the FCD was always 1.7Khz off frequency.
GQRX showing QO-100 Transponder signals
The NooElec NESDR SMArt v5 is very well put together, it has an aluminium case that acts as a heatsink (it does get warm!) and overall the build quality is much better than the plastic cased FCD. When I think that I paid close to £100 for the FCD and the NooElec NESDR SMArt v5 only cost £33, I am amazed at the build quality.
Overall I’m extremely pleased with the purchase of the new SDR, it slotted in perfectly as a replacement for the FCD, works great with GQRX, my QO-100 Node Red Dashboard and performs considerably better than the FCD. Overall money well spent!
You can find the NooElec NESDR SMArt v5 spec sheet here.
Whilst I’ve been waiting for the weather to improve so that I can get my QO-100 dish antenna up I’ve been working on my QO-100 Node Red dashboard.
The idea of the dash board is to bring together the operating of the receiver and transmitter into one control centre so that the two separate devices are able to communicate and behave as if they were actually one device, like a transceiver rather than being individual components.
Ideally I would like to have the transmitter and receiver talking to each other such that when the VFO on the transmitter is incremented/decremented the receiver VFO also moves by the same amount.
By doing this the receiver VFO should always be in the right place on the 10Ghz band to hear my 2.4Ghz uplink signal and of course, any station coming back to my CQ calls.
So far I’ve only been working on the receive part of the Node Red flow, it’s certainly been a lot of fun getting it put together.
I control my Funcube Dongle Pro+ (FCD) using GQRX SDR on my Kubuntu PC. This software is working extremely well with the FCD and I’m happy with the level of functionality it offers.
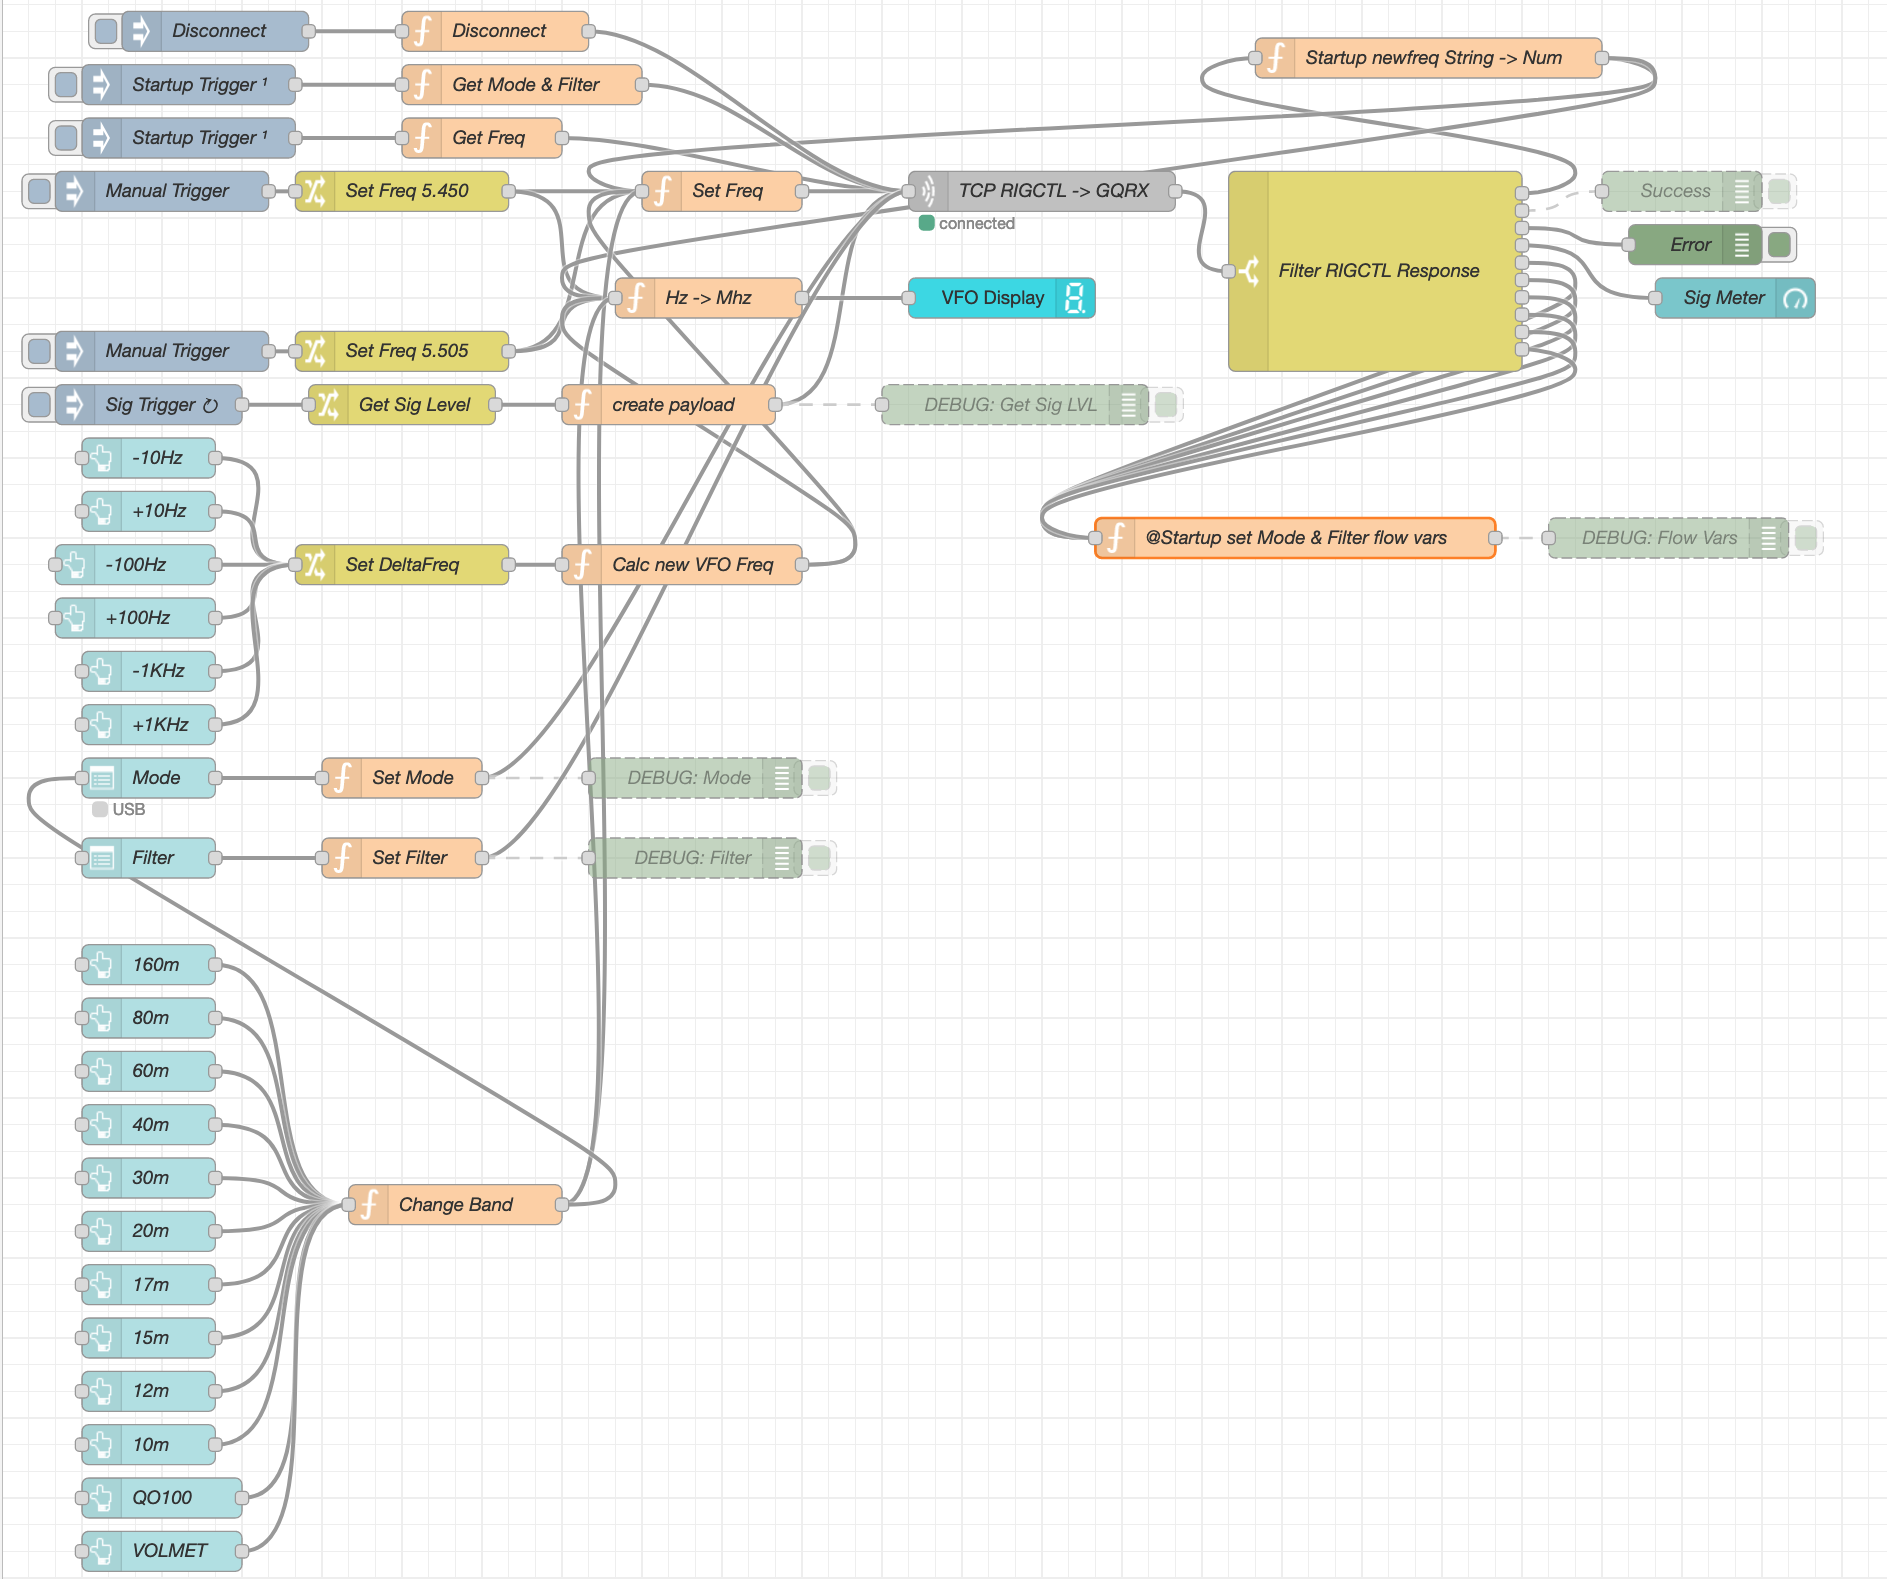
GQRX SDR has the ability built in to control the SDR via remote TCP connection using RIGCTL protocol. Currently there isn’t a RIGCTL node available for Node Red so I have written a number of Javascript function nodes that provide the appropriate functionality in conjunction with a standard Node Red TCP node. This is working extremely well on the local LAN in the radio room and is proving to be very stable and responsive.
M0AWS QO-100 Node Red Flow – Receive Section
The flow for the receive section of the dashboard looks fairly complicated but, in reality it’s really not too difficult to get to grips with. The receive flow provides the facility to switch bands, switch modes, change receiver filter band width, display a realtime signal strength meter, receive +/- clarifier in 10/100/1000Hz increments and put the receiver into QO-100 mode where the SDR VFO is tuned to 739.550Mhz whilst the dashboard VFO shows the QO-100 downlink frequency in the 10Ghz band. This is all working very well and I’m happy with the initial result.
M0AWS QO-100 Receive Dashboard in QO-100 mode
I now need to start work on the transmit side of the QO-100 dashboard and get communications between my IC-705 transceiver and the FCD SDR working via Node Red. This could be a little more challenging as it will involve communicating with the IC-705 via WFView over wifi.
More soon …
We use cookies to ensure that we give you the best experience on our website. If you continue to use this site we will assume that you are happy with it.