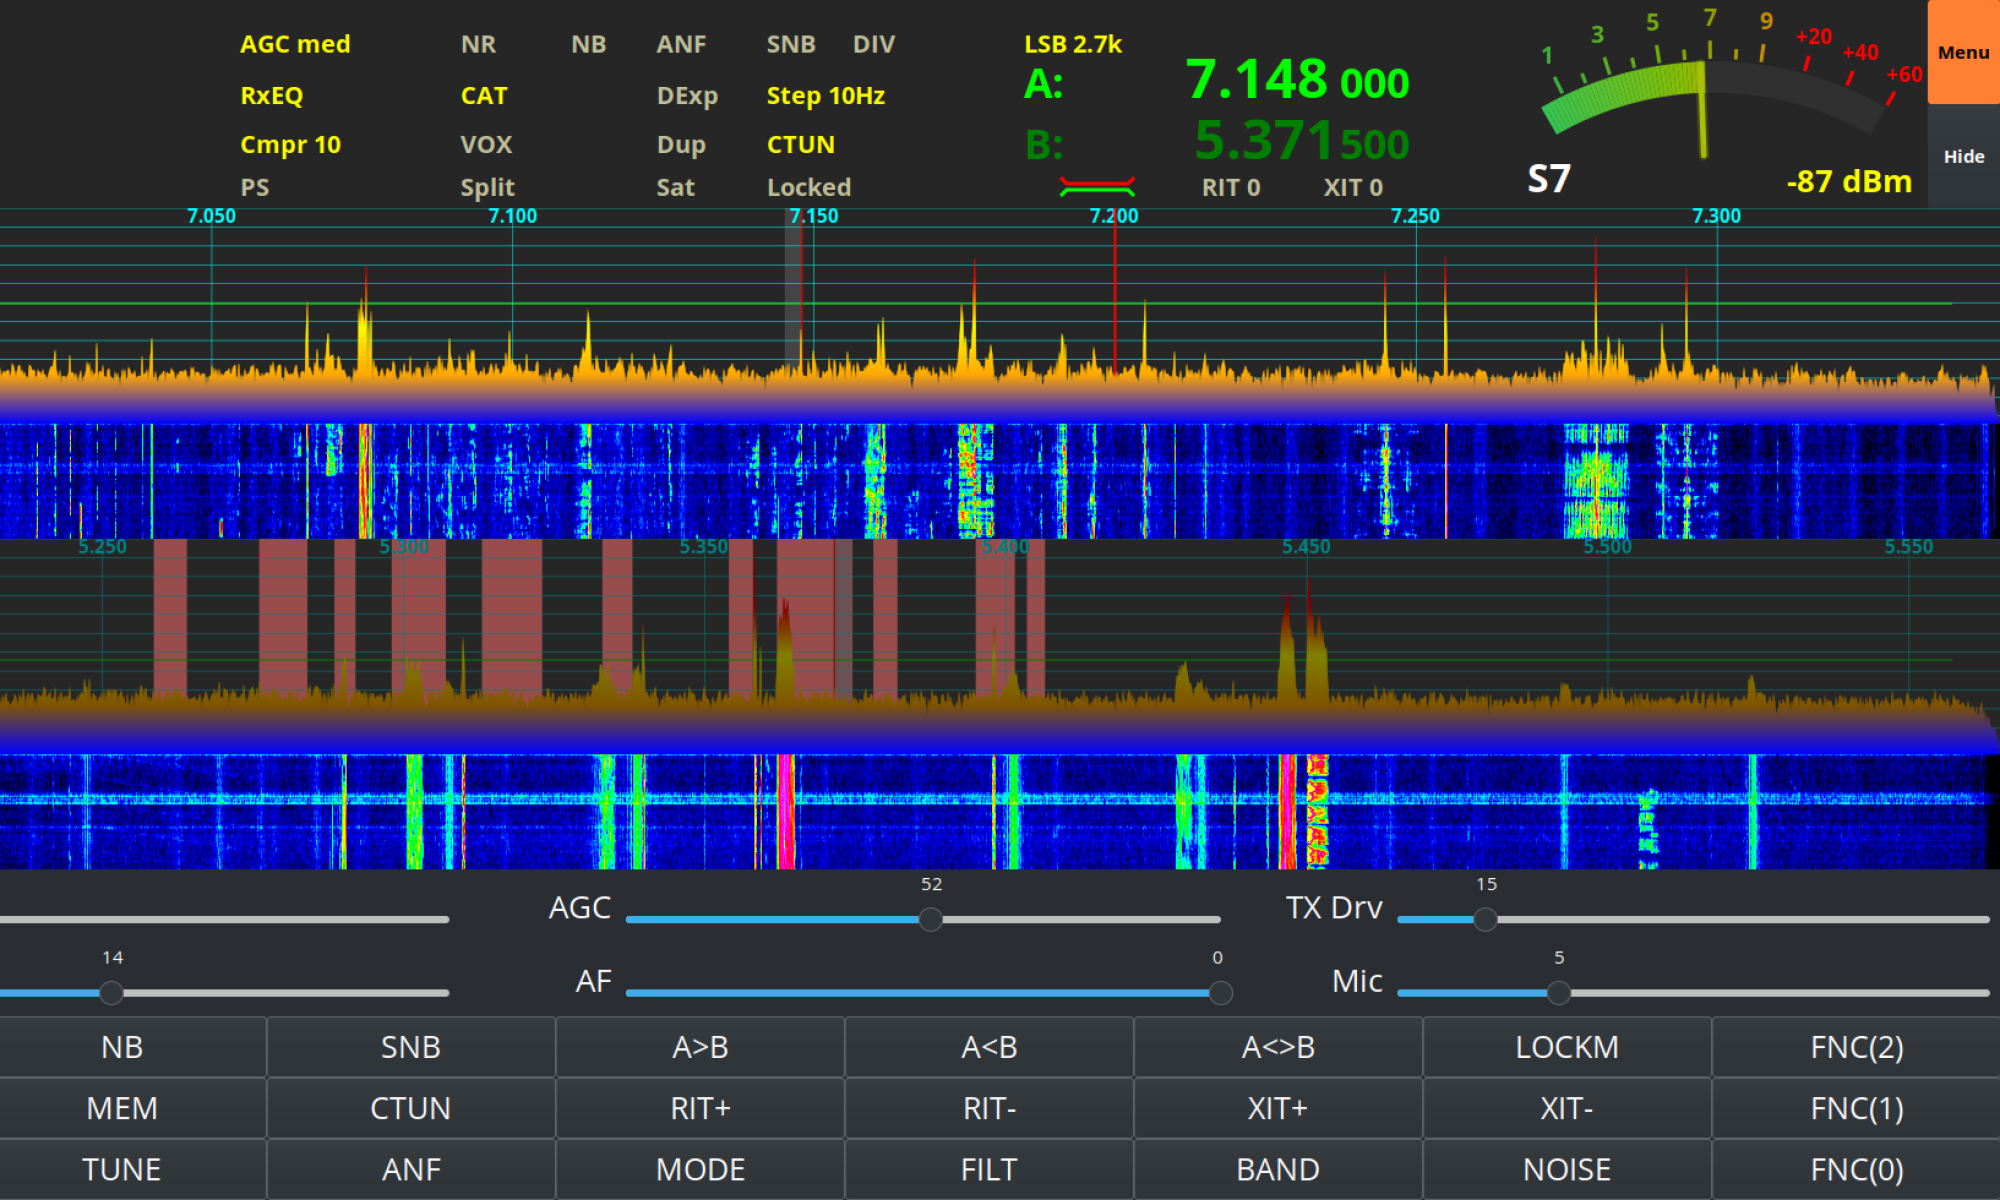
I’ve not been on the radio much over the last few weeks as I’ve had my head down other radio related rabbit holes.
One of the rabbit holes is a Node-Red project to make my online logs a little more interactive. For sometime now my logs have been displayed on my website as nicely formatted, searchable HTML pages however, they don’t really allow the viewer (myself included) to see the global coverage of all the contacts so, I decided to write a Node-Red flow that would do just that.

The flow itself isn’t too complicated and basically consists of reading in the individual ADIF formatted log files, processing the data and then sending the data in the correct format to the map node for display.
I’ve had to write a few functions to handle the processing of the ADIF formatted data but, these aren’t particularly complex and are fairly easy to understand even if like me, you’re not a Javascript programmer.
The flow is working perfectly however, I’m in the process of reworking the format generic payload function to reduce the amount of code and make it more efficient.

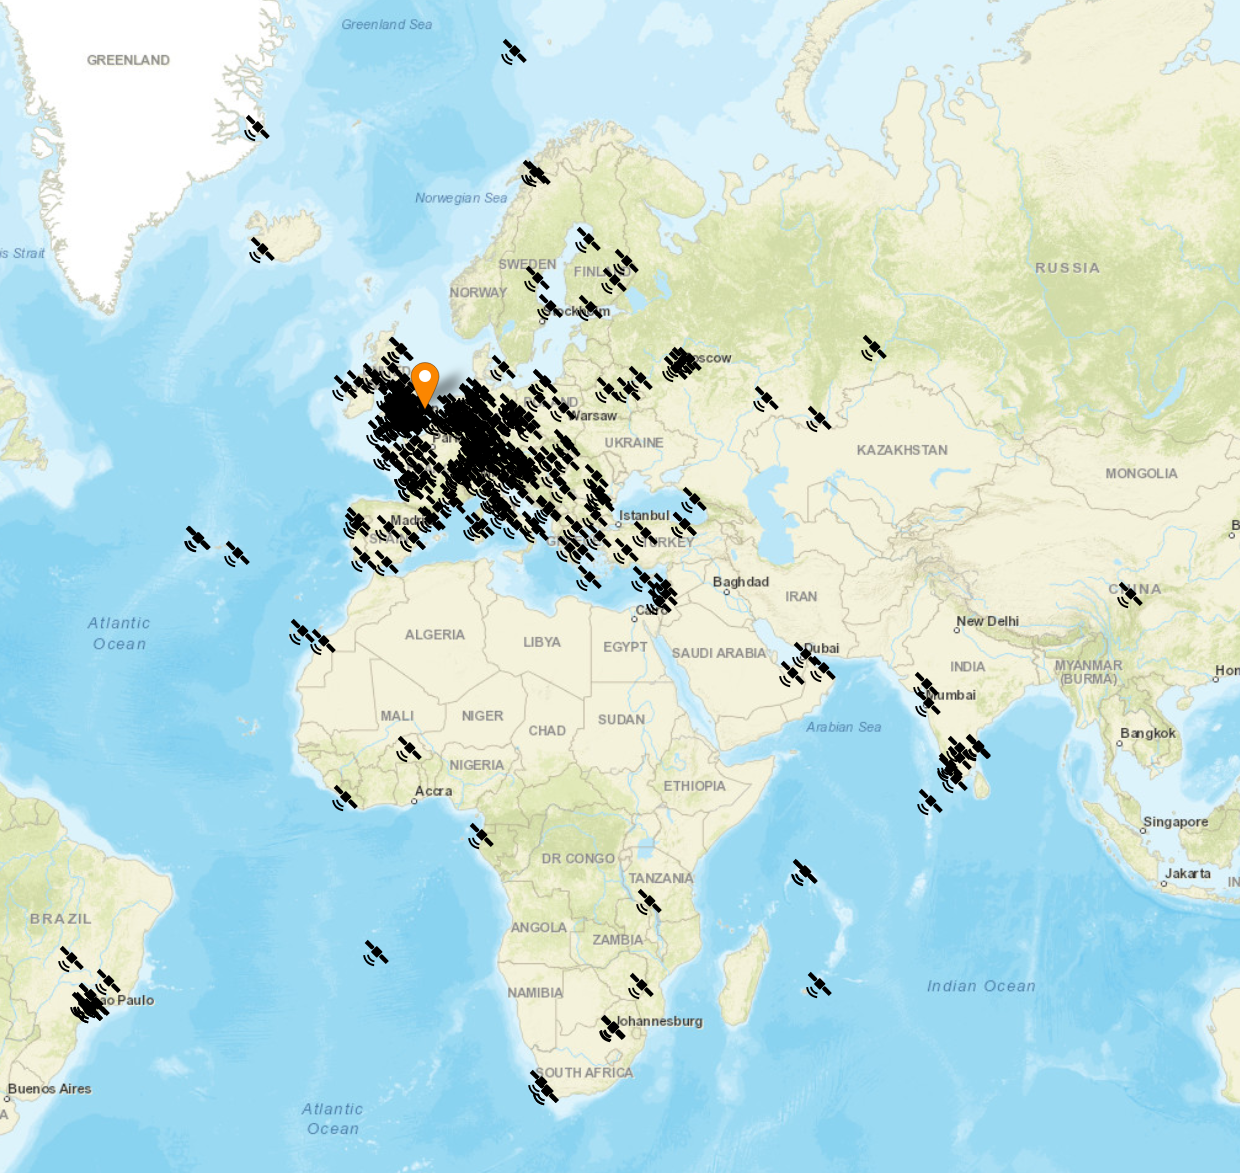
The flow generates two maps, one for voice / CW /Satellite contacts and the other for WSJT-X FT4/8 contacts. Every pin on the map is colour coded by band with satellite contacts being denoted by a satellite icon.
Each pin / icon on the map is clickable and reveals the data of the QSO being displayed.
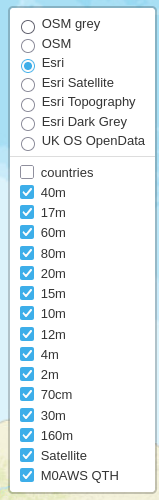
In the top right-hand corner of the map there is a drop down layer menu that allows the viewer to filter by band thus reducing the number of icons on the screen at any one time.
Seeing the data presented on a map really brings my logs alive. An example of this is that I had no idea I’d worked so many stations in India on the QO-100 Satellite.
The small icons in the pins show a microphone for SSB/FM/FreeDV contacts and a downwards pointing triangle in a box for CW contacts. Sadly I couldn’t find a Morse key icon in the collection available.
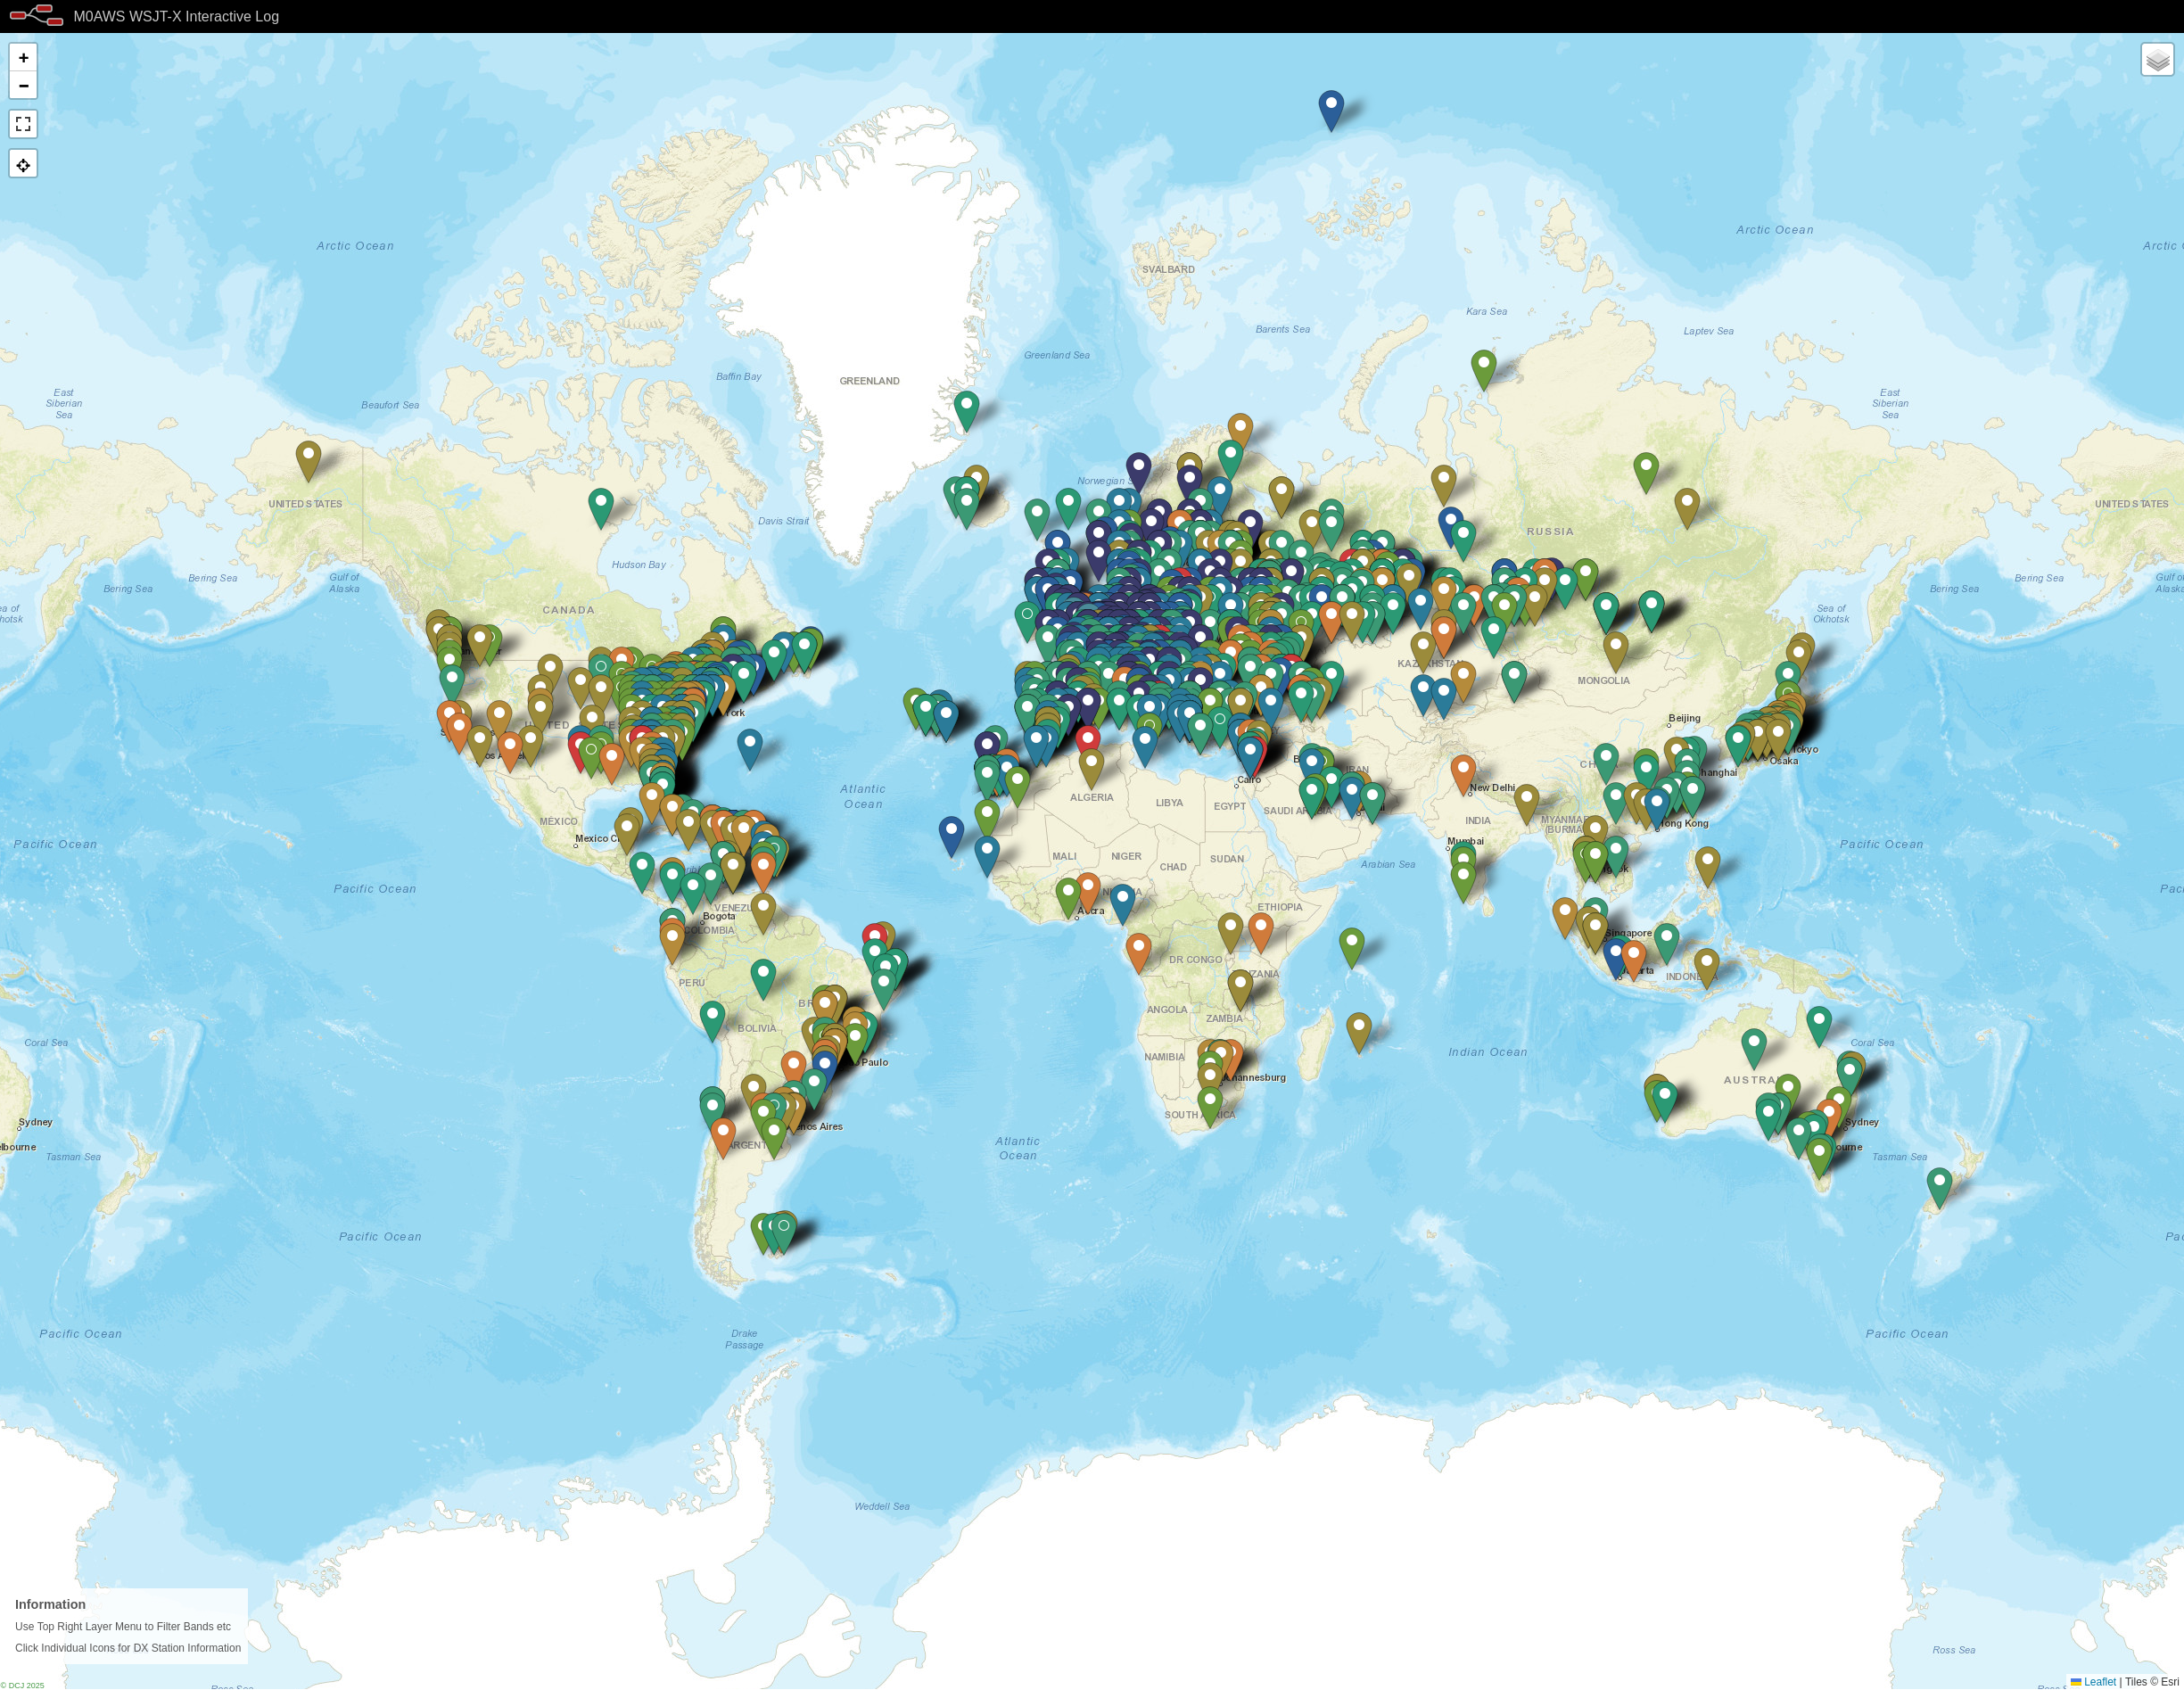
I only use FT4/8 for testing new antenna designs however, it’s interesting to see the global coverage accomplished with this weak signal mode.
Once I’ve finished rewriting the format generic payload function I will make the flow available for download here so that others can also create an interactive view of their radio logs.
If you want to have a look at the maps and try them out for yourself, they are available under the Logs menu above.
This Node-Red instance is running in a virtual machine (VM) on a 16GB RAM RaspberryPi 5 that is also running a number of other VMs at the same time so, it’s safe to say it’s not heavy on CPU and will run on the older Pi4 as well.
More soon …
One Reply to “Using Node-Red to build interactive log maps”
Comments are closed.