I’ve now completed the GQRX Receive and Icom IC-705 Transmit dashboard in Node Red. It was a fun project to put together and needed some javascript coding to get the functionality I wanted but, I got there in the end.
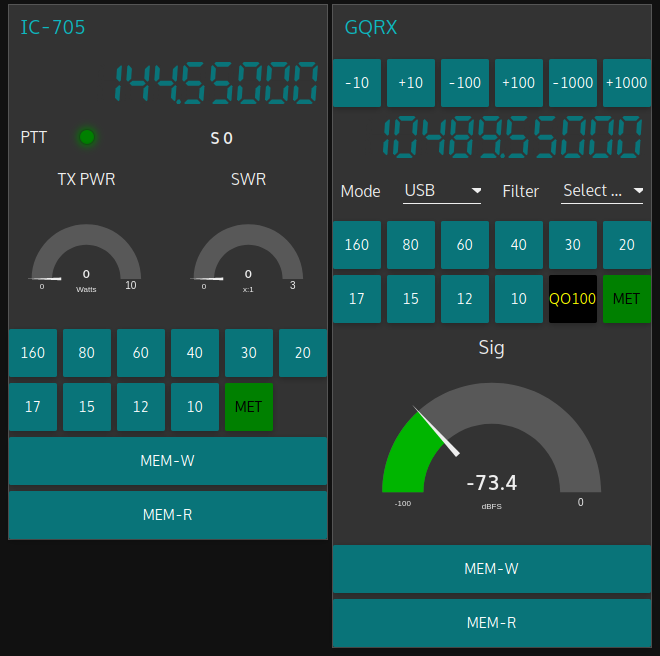
M0AWS QO-100 GQRX/IC-705 control dashboard
The dashboard looks fairly simple but, there is a lot behind the scenes to get it to this stage.
On the left is the Icom IC-705 transmit control panel. It shows the transmit frequency, power output and SWR reading. The SWR is so that I can check that the input into the 2.4Ghz transverter doesn’t have any connectivity issues. The “S0” will actually display the S Meter reading when the IC-705 is being used as a normal transceiver rather than being in QO-100 Duplex mode as shown above where the GQRX app and Funcube Dongle SDR are being used as the receiver.
The GQRX side of the dashboard shows the downlink frequency which tracks the uplink frequency of the VFO on the IC-705. This will ensure that the Funcube Dongle Pro+ SDR receiver will always be on the correct downlink frequency relative to the uplink frequency, thus I should always be able to hear my own signal coming from the QO-100 satellite.
Once taken out of QO-100 mode the two radios can be used independently on any of the HAM bands and can be switched using the buttons on the dashboard.
I also coded in a simple memory facility where a frequency can be stored in Node Red and recalled later on both the transmit and receive sides.
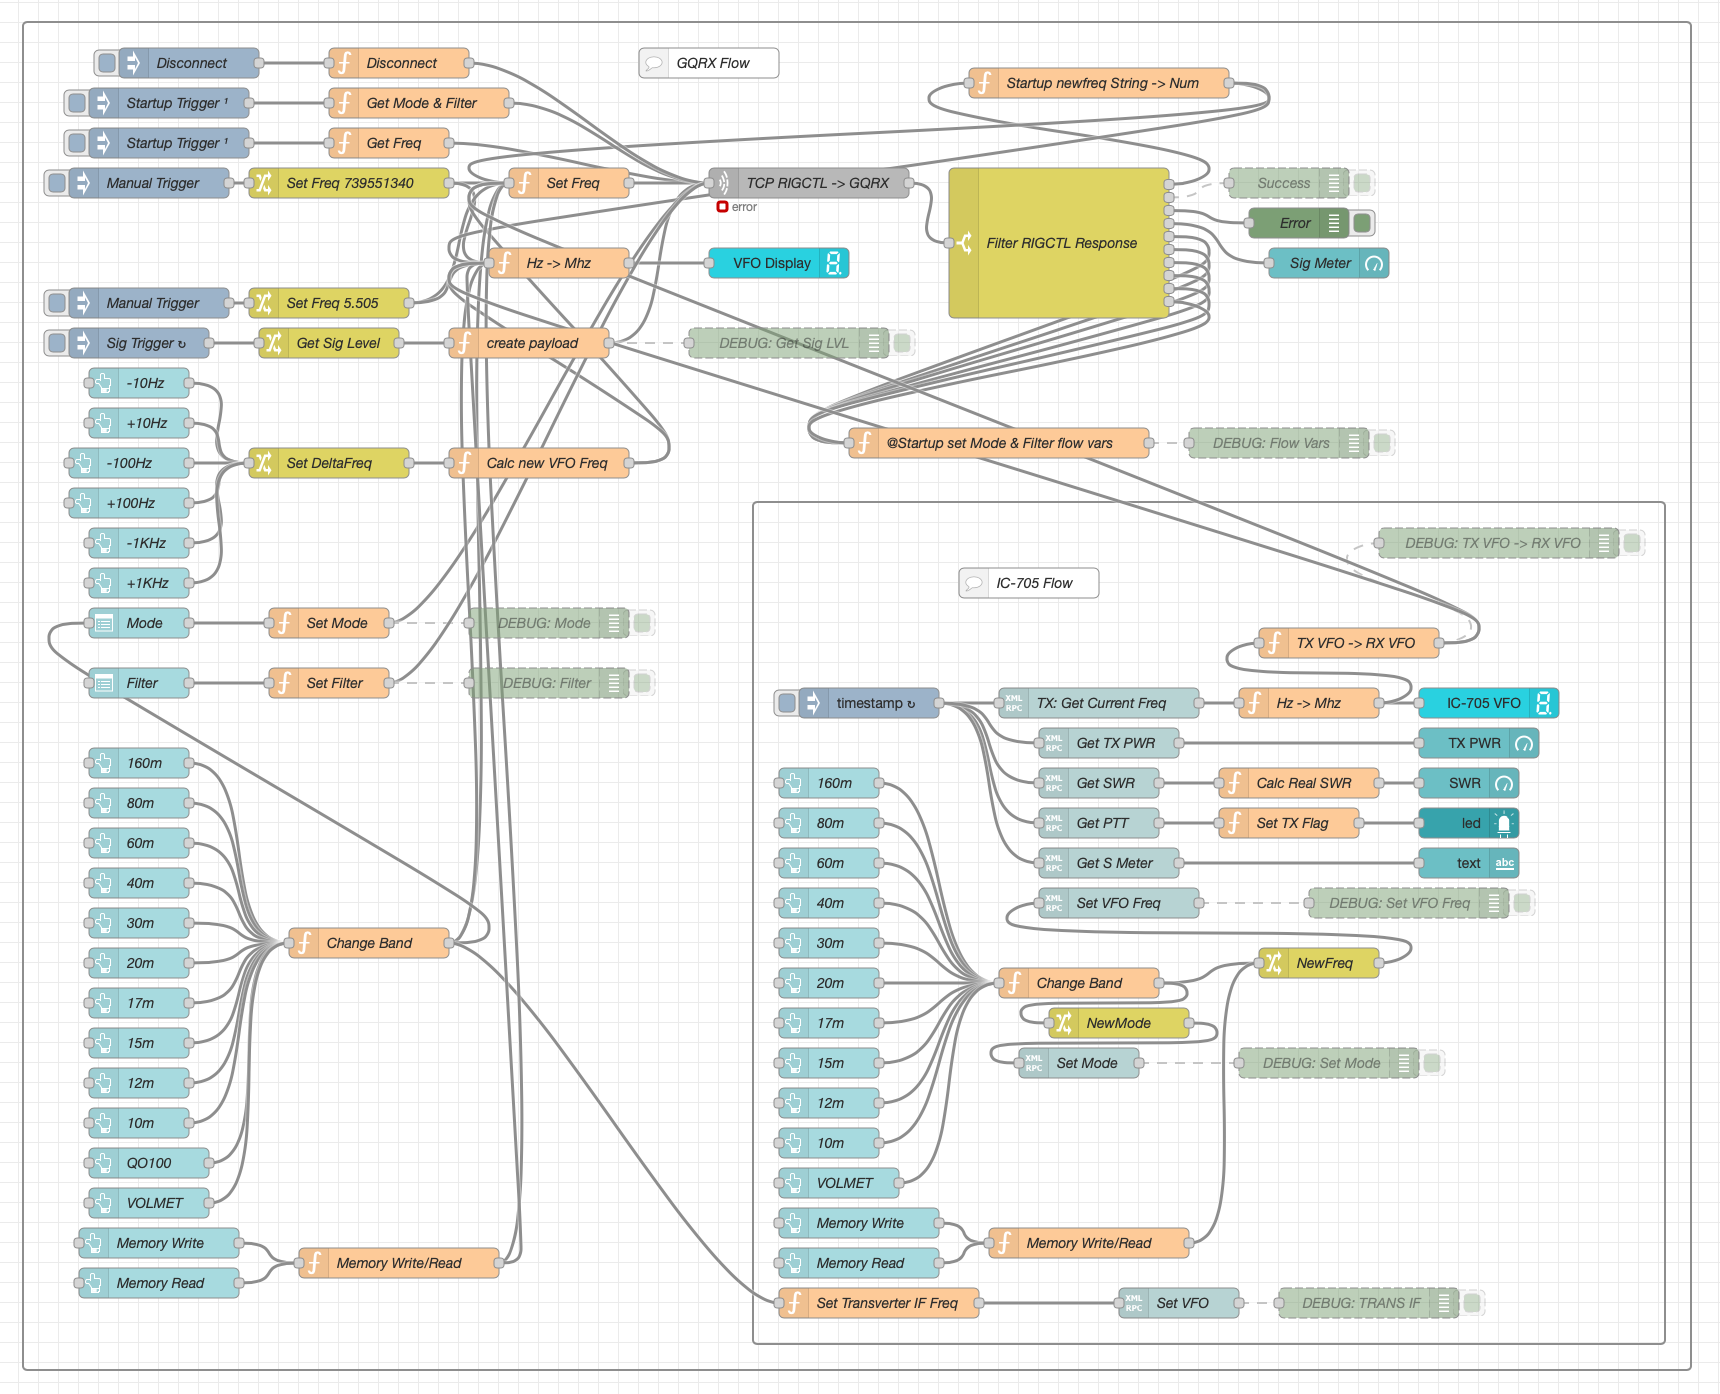
Looking at the dashboard it all looks simple and straight forward however, if you look at the Node Red flow it becomes obvious that this isn’t the case.
QO-100 Dashboard Flow in the Node Red Editor (Click for larger image)
There’s a lot to the flow to get the information from the receiver and transmitter so that it can be presented on the dashboard. There’s also some code to convert between Rigctl protocol used by the GQRX application and XMLRPC used by the IC-705 via FLRig and WFview. I had to also code around a bug in the Node Red XMLRPC node whereby you have to add 0.1 onto the VFO frequency for it to be passed onto the radio otherwise the information is never sent. This was a real pain of a bug to find but, with a little experimentation I found the problem and managed to code around it. The strange thing about this is that the 0.1 added onto the frequency isn’t actually passed onto the radio via the XMLRPC node, it just has to have that on input otherwise it doesn’t work at all. A very strange bug and hopefully one that will be fixed by the node developer in future releases.
All that is left to do now is add the temperature sensors dashboard to complete the dashboard. These haven’t arrived yet and so I’ve not been able to create the necessary flow to collect the data from them.
Hopefully this coming week the weather will improve and I’ll start getting the dish antenna up and the get the receive side working.
UPDATE: Further development of my QO-100 Dashboard has taken place, you can read all about it here.
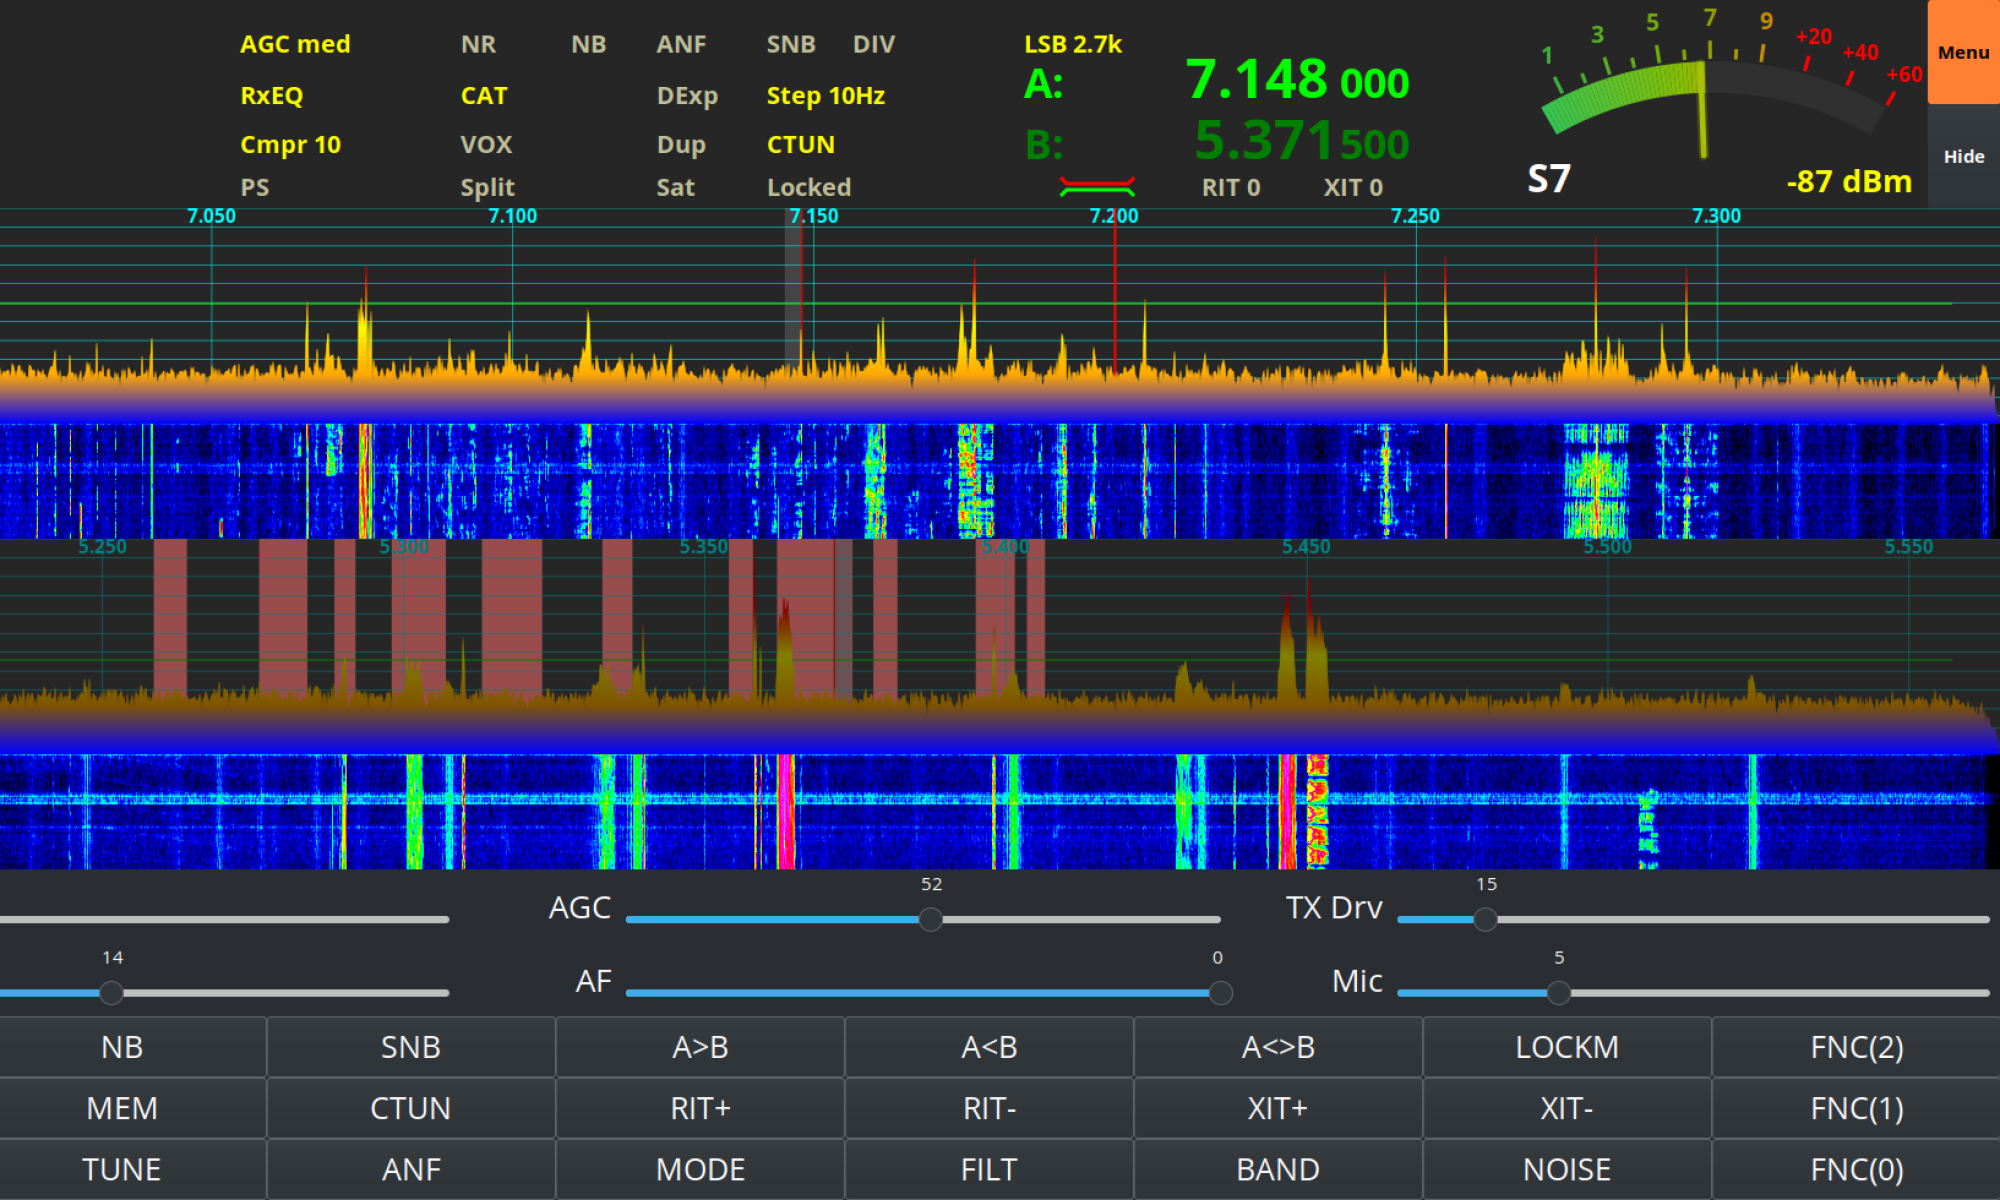
Whilst I’ve been waiting for the weather to improve so that I can get my QO-100 dish antenna up I’ve been working on my QO-100 Node Red dashboard.
The idea of the dash board is to bring together the operating of the receiver and transmitter into one control centre so that the two separate devices are able to communicate and behave as if they were actually one device, like a transceiver rather than being individual components.
Ideally I would like to have the transmitter and receiver talking to each other such that when the VFO on the transmitter is incremented/decremented the receiver VFO also moves by the same amount.
By doing this the receiver VFO should always be in the right place on the 10Ghz band to hear my 2.4Ghz uplink signal and of course, any station coming back to my CQ calls.
So far I’ve only been working on the receive part of the Node Red flow, it’s certainly been a lot of fun getting it put together.
I control my Funcube Dongle Pro+ (FCD) using GQRX SDR on my Kubuntu PC. This software is working extremely well with the FCD and I’m happy with the level of functionality it offers.
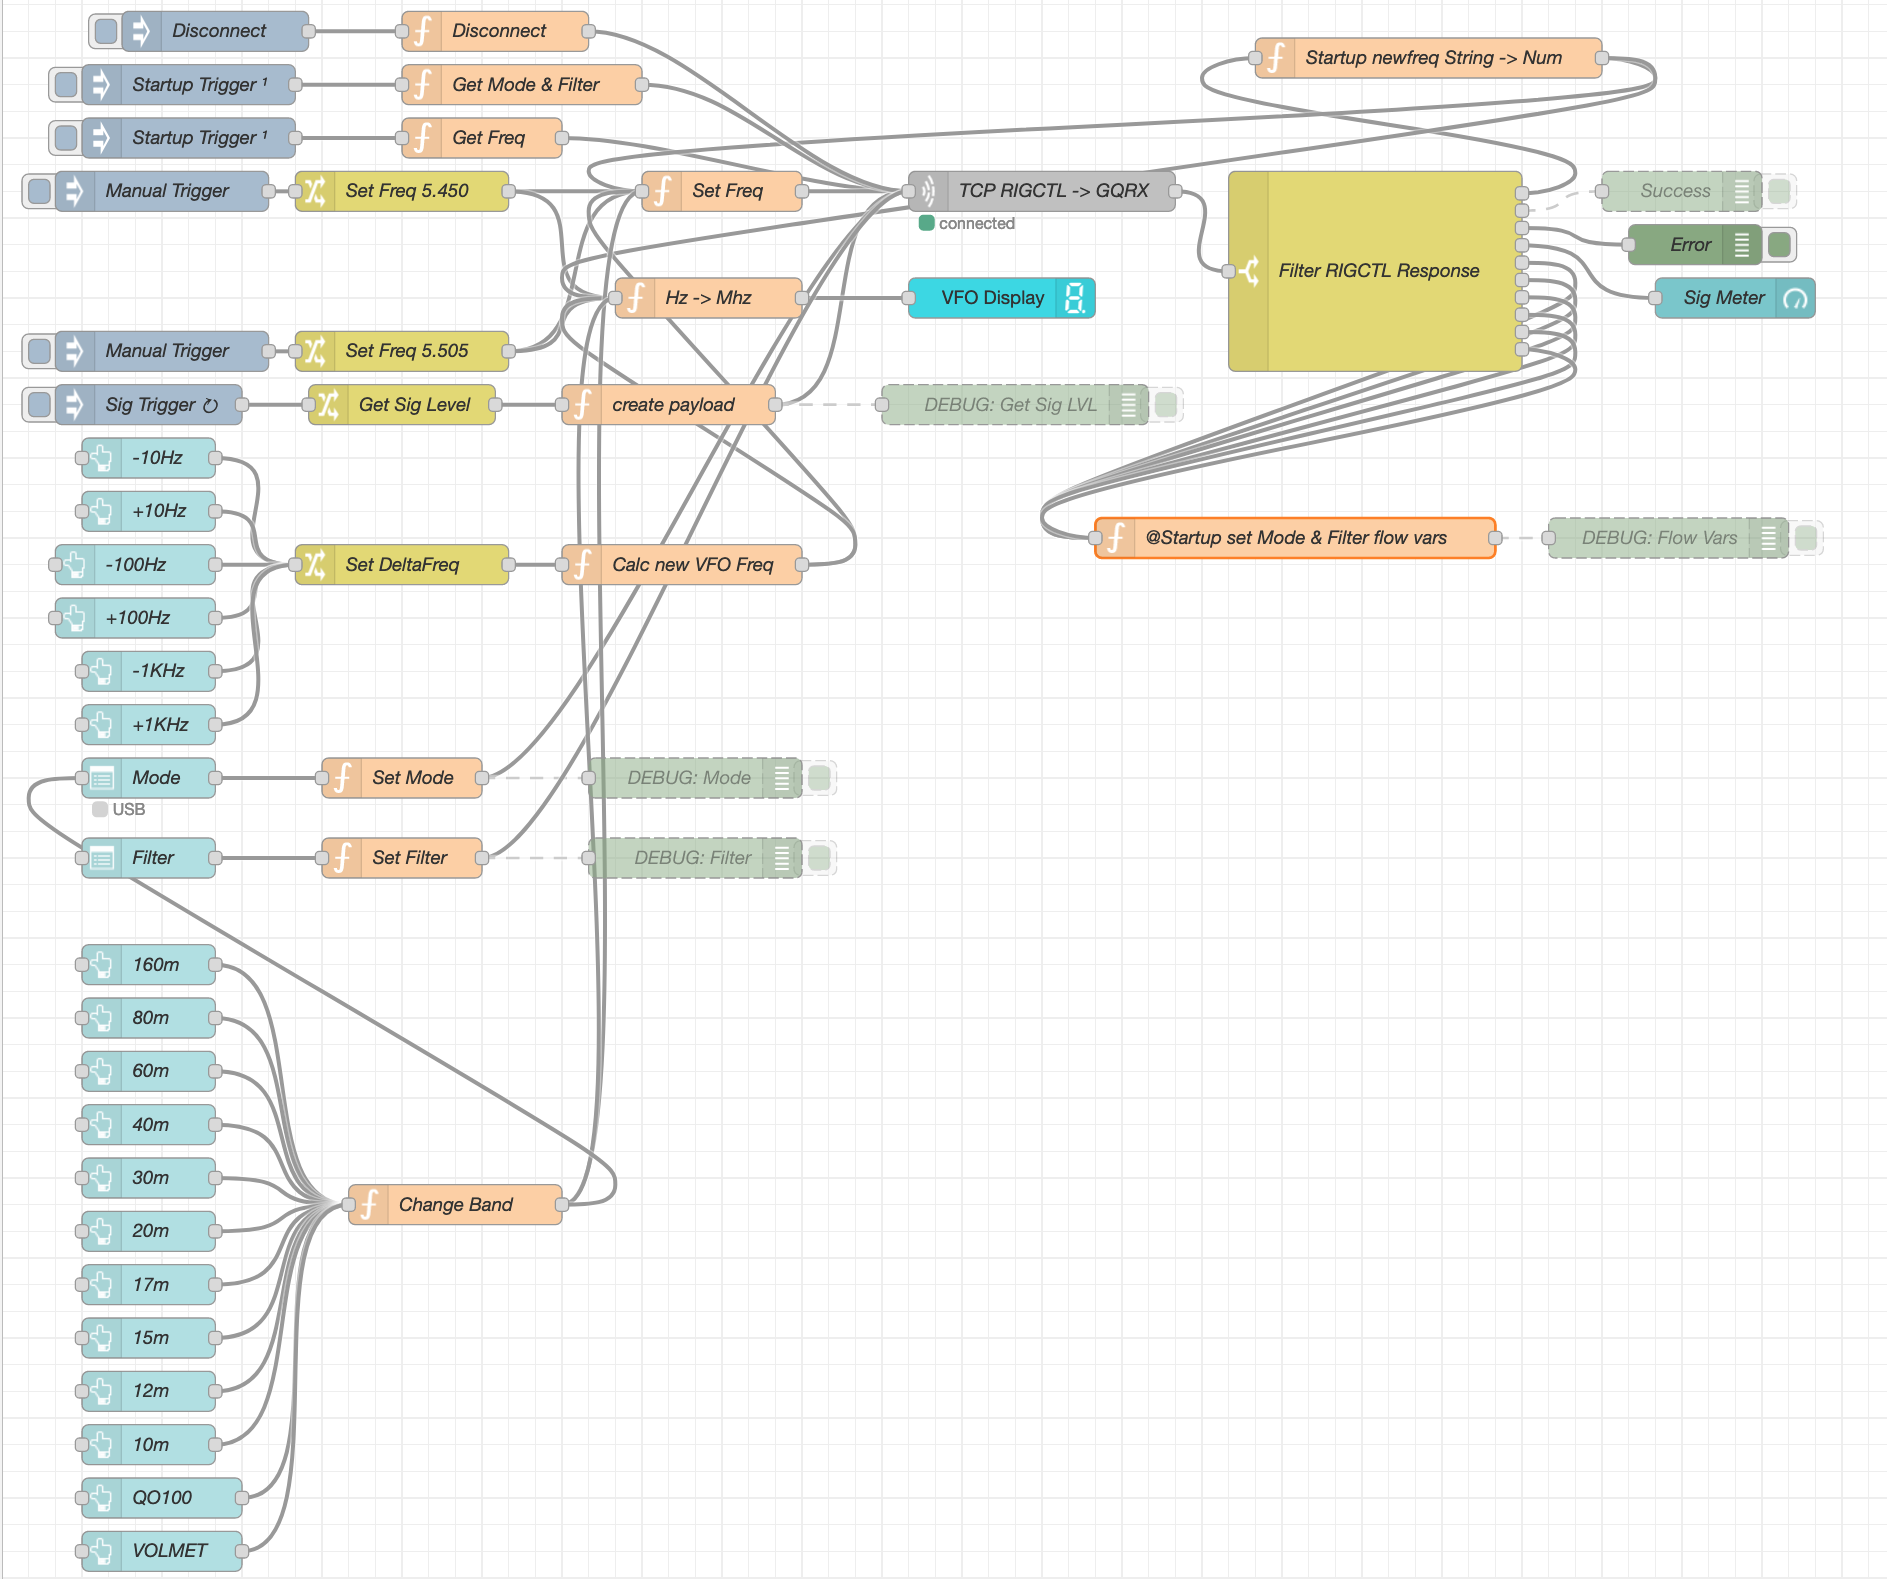
GQRX SDR has the ability built in to control the SDR via remote TCP connection using RIGCTL protocol. Currently there isn’t a RIGCTL node available for Node Red so I have written a number of Javascript function nodes that provide the appropriate functionality in conjunction with a standard Node Red TCP node. This is working extremely well on the local LAN in the radio room and is proving to be very stable and responsive.
M0AWS QO-100 Node Red Flow – Receive Section
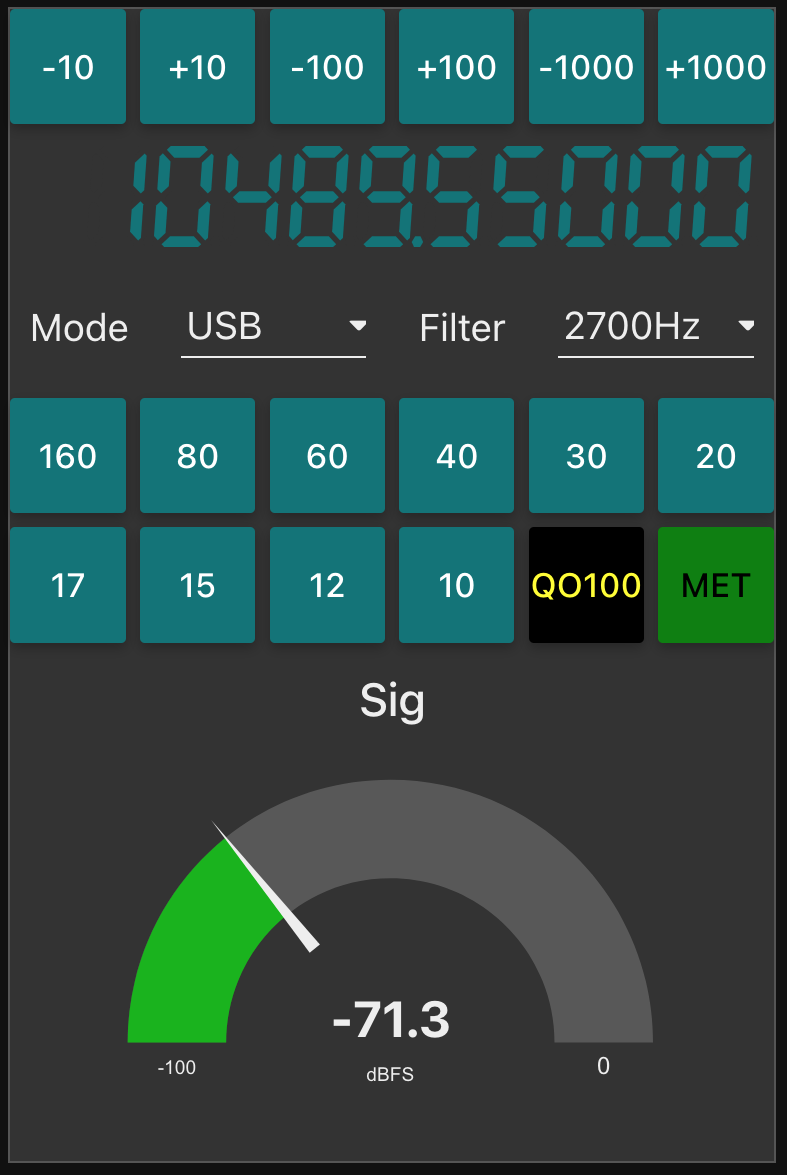
The flow for the receive section of the dashboard looks fairly complicated but, in reality it’s really not too difficult to get to grips with. The receive flow provides the facility to switch bands, switch modes, change receiver filter band width, display a realtime signal strength meter, receive +/- clarifier in 10/100/1000Hz increments and put the receiver into QO-100 mode where the SDR VFO is tuned to 739.550Mhz whilst the dashboard VFO shows the QO-100 downlink frequency in the 10Ghz band. This is all working very well and I’m happy with the initial result.
M0AWS QO-100 Receive Dashboard in QO-100 mode
I now need to start work on the transmit side of the QO-100 dashboard and get communications between my IC-705 transceiver and the FCD SDR working via Node Red. This could be a little more challenging as it will involve communicating with the IC-705 via WFView over wifi.
Following on from my initial article on plotting realtime WSJT-X decodes on a Node Red map I’ve made a few enhancements to the flow so that it includes even more data then before.
The additions to the flow now enables collection of status information from WSJT-X so that the flow is able to capture the frequency that the radio is tuned to and also the mode that WSJT-X set to. Neither of these two bits of data are in the decode message payload and so a separate mini-flow has to be created to collect the data from the status payload along side the other main flow.
Node Red flow showing additional sub flow in the top left corner of the flow editor screen
Since the status information needs to be available to all other flows I used flow variables to store the status information in so that it can be addressed directly from any of the other flows in the Node Red app.
If you’d like to use the flow in your radio room then I have put a download link below for a file that you can import into Node Red and build the flow in an instant.
Following on from my other Node Red exploits I’ve put together a flow that creates an interactive map of contacts that is generated from the WSJT-X ADI log file.
The flow is fairly straight forward and self explanatory so I won’t go into detail here but, will make a copy of the flow available for download at the end of this article.
Node Red Flow for processing the WSJT-X ADI Log file
The flow is incredibly quick at generating the map with all the pins on it, one for each station worked. The pins are colour coded, blue for FT8 and green for FT4. If you want to add other modes then just create a new colour entry in the Dynamic Icon Colour function.
The resultant map is fully interactive with each pin being clickable showing the QSO information in a tiny popup.
Node Red map generated from the WSJT-X ADI Log file
You can download the flow and try it yourself using the link below.
Following on from my previous article on Enhancing Digital modes with Node Red I’ve now got to a point where I have realtime decode information from the WSJT-X digital application being plotted on a Node Redworld map not just for CQ calls but, for stations in conversation too.
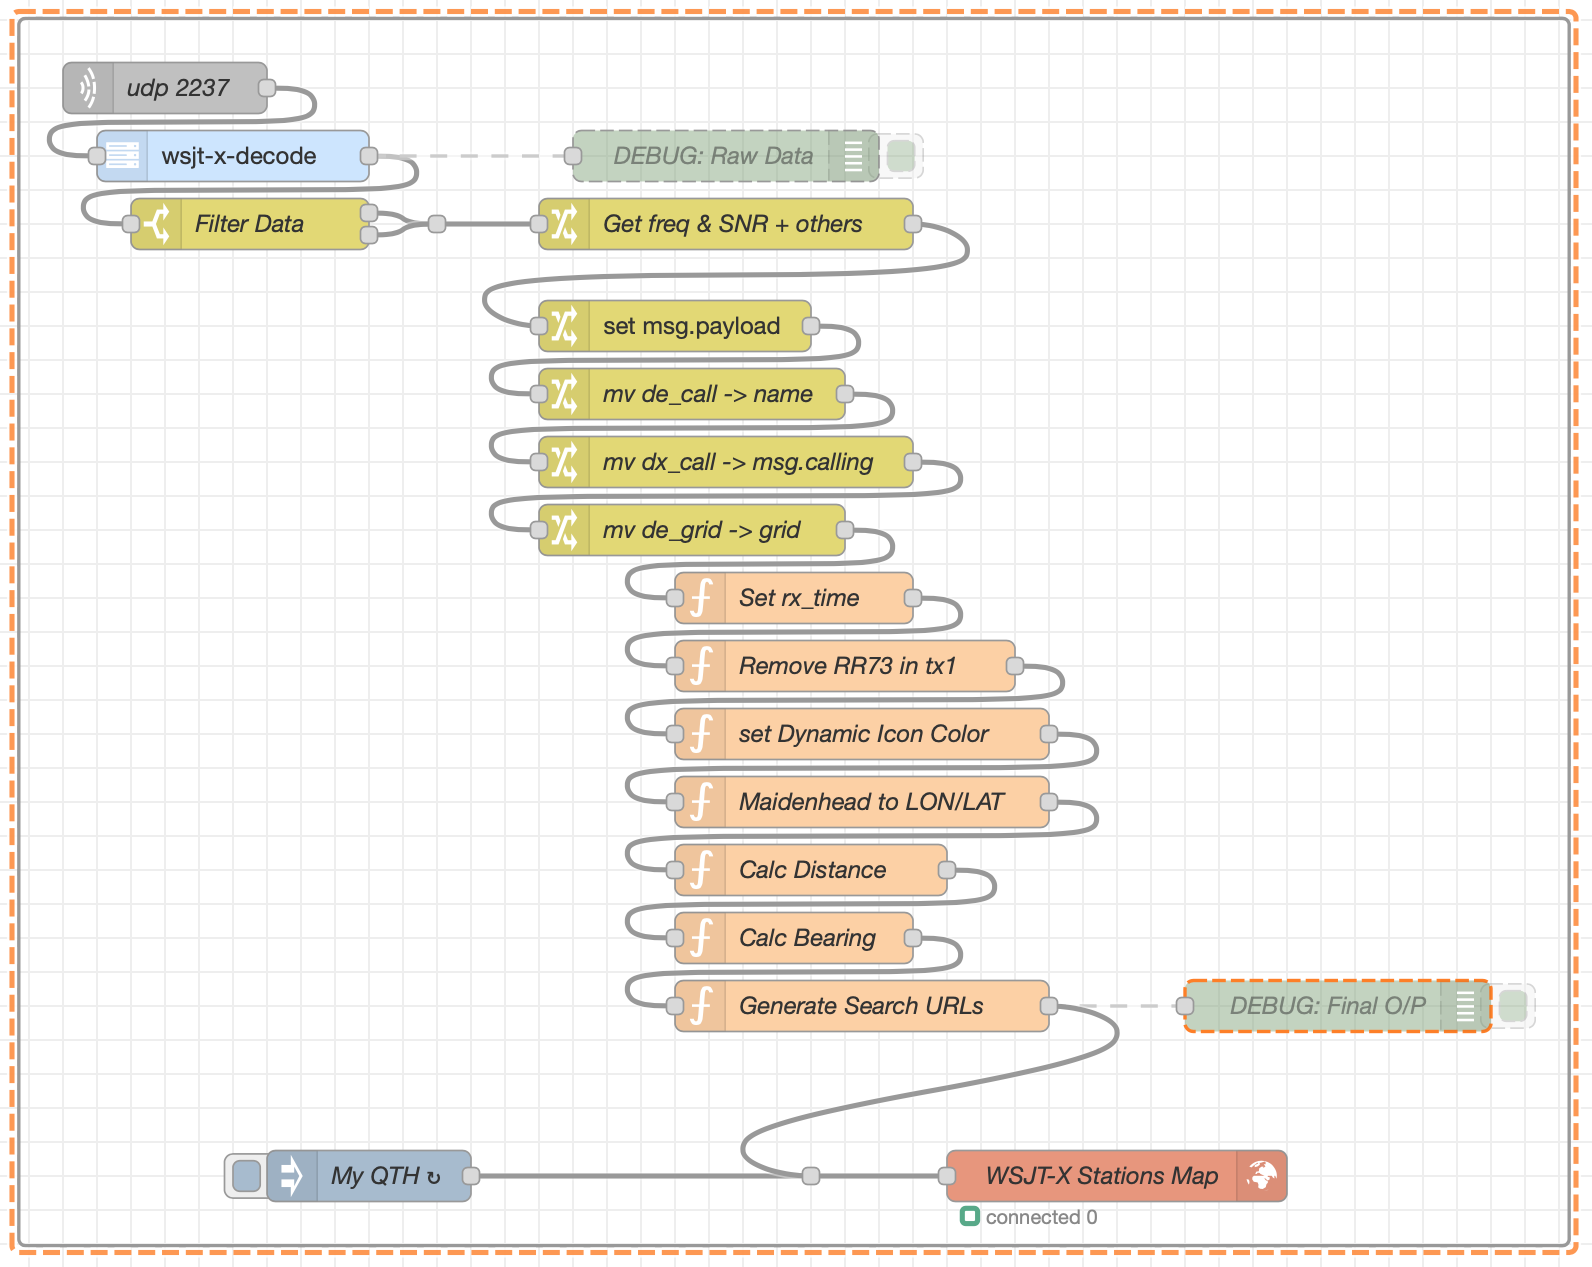
The flow has become somewhat more complex than it was originally as more and more functionality has been added. I have deliberately split out the flow process into more nodes than are really necessary so that the flow is easier to understand. Anyone from a programming background like myself will soon realise that a lot of the nodes could actually be combined into one big node however, the overall flow process wouldn’t be so easy to understand for the Node Red newcomer and would possibly put people off from trying it out.
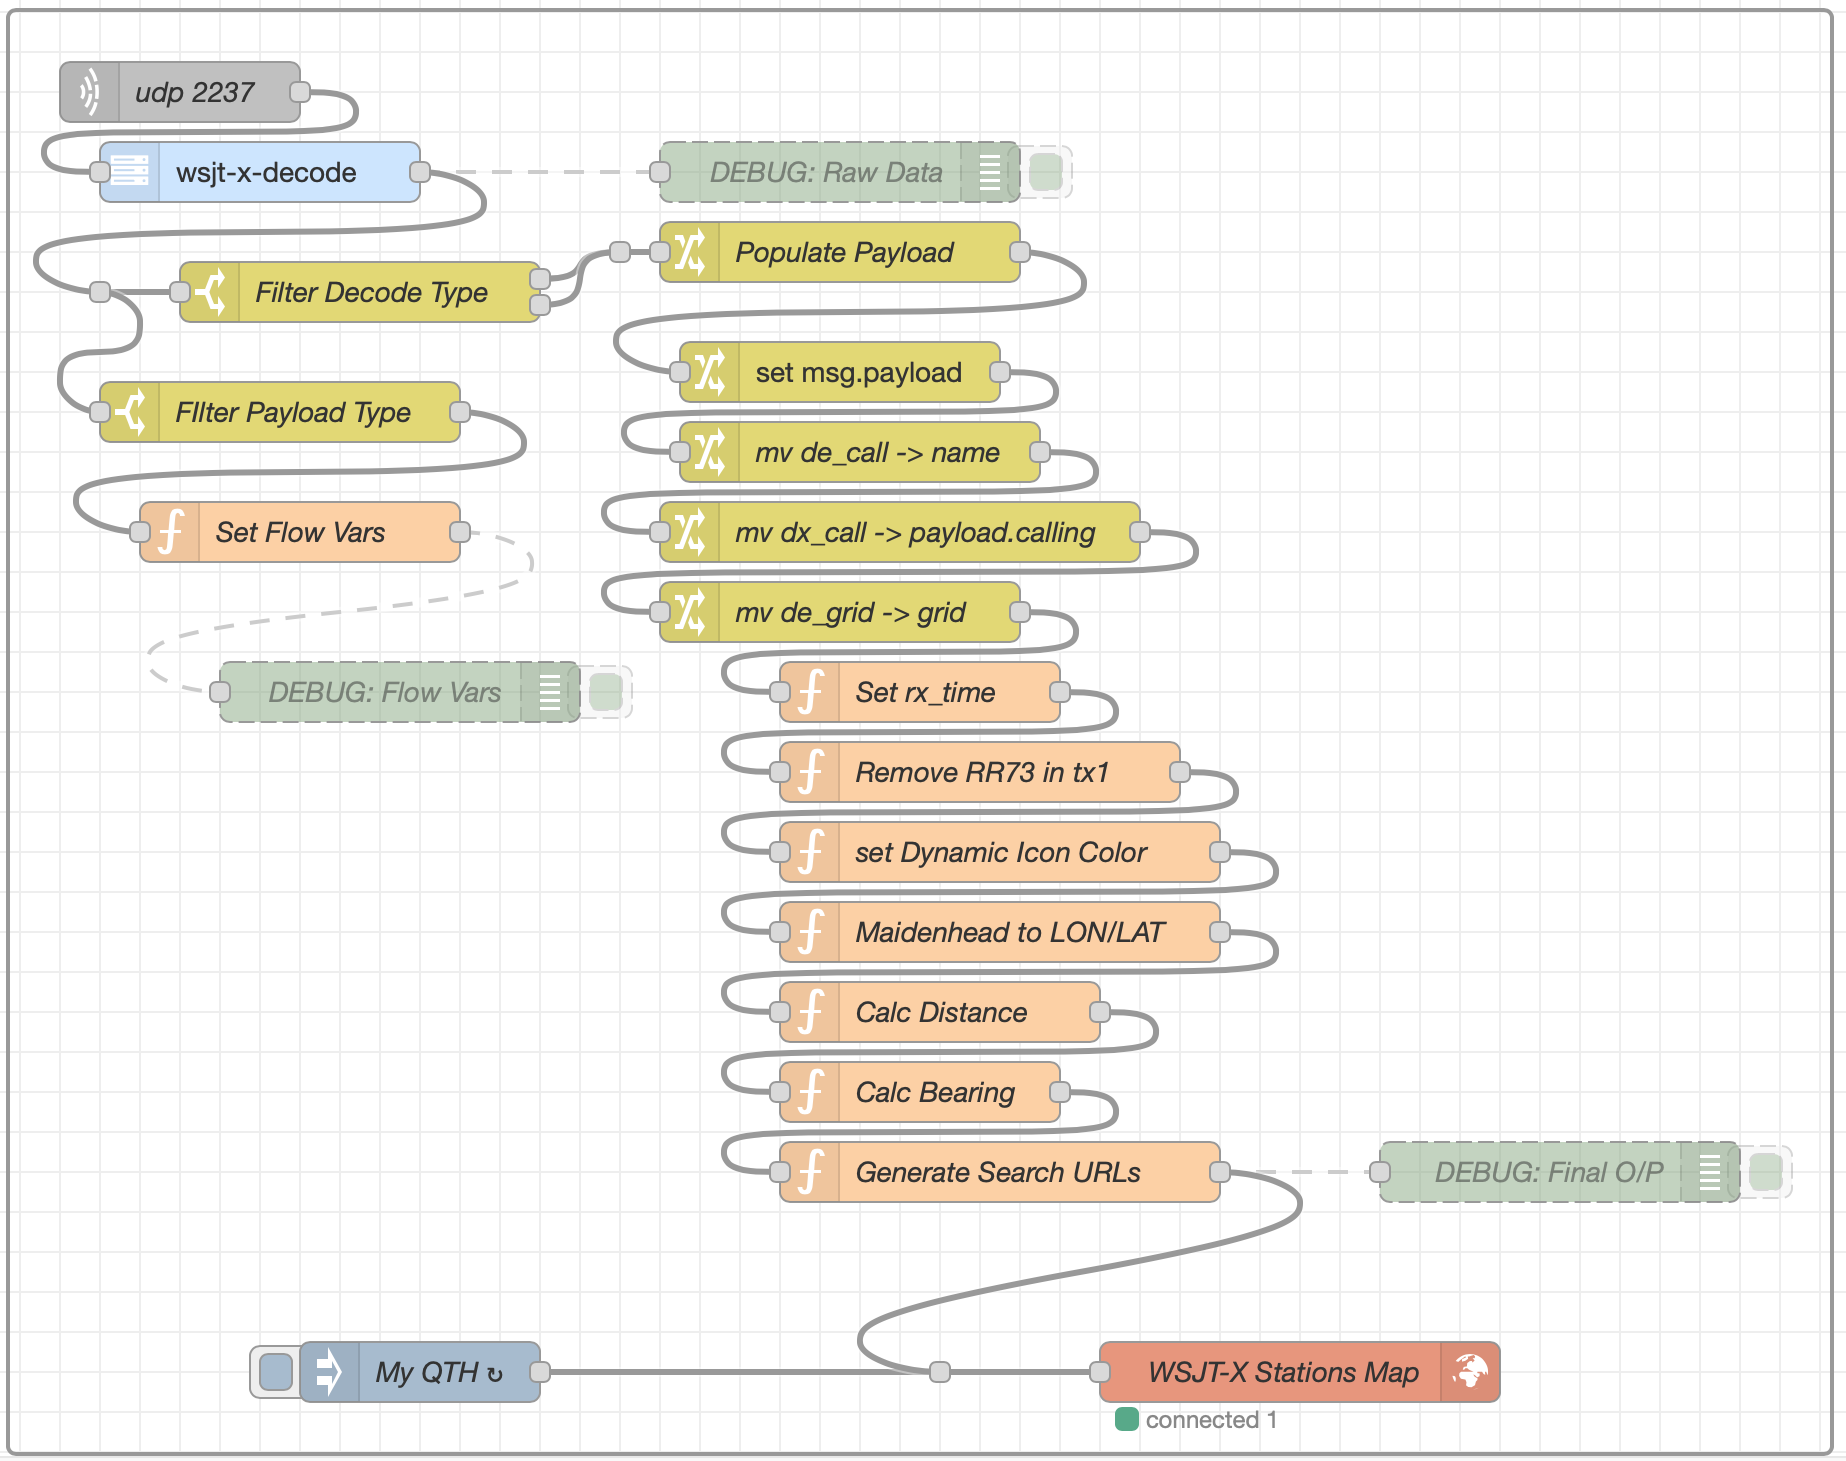
Current WSJT-X Node Red flow
Above is a screenshot of the flow as it currently stands. It’s pretty easy to understand what is happening in the flow due to the fact that the processes are broken out into small, easy to digest blocks.
From the top down we connect to WSJT-X via UDP port 2237 and listen for the data stream. As the data is received it’s passed directly into the WSJT-X-Decode node that converts the information into a Node Red compatible format. The data is then filtered with only the information required being passed onto the next node. There are two outputs from the filter node as we require two different streams of information, namely “CQ” and “TX1” data. All the rest of the data from WSJT-X is ignored as it’s not required at this time.
The “Get freq & SNR + Others” node builds a decode message payload with all the correct data, in the right format ready to be passed on along the flow. This node also sets a number of parameters required by the map node to be able to control the display of the data.
The next node along is “Set msg.payload”, this brings together all the necessary data into a single message payload that is then worked on by all the nodes further along the flow.
The next 3 nodes perform the simple task of moving some of the data into the objects defined by the world map node, if the data isn’t moved into these specific objects the map will not plot anything.
Now we get onto the slightly more difficult bit that might put off those who aren’t from a programming background. The next 7 nodes are all javascript functions which I have created to perform tasks that cannot be done via the standard Node Red pallet.
At this point it’s worth noting that I’m not a javascript programmer, I’ve used Python, Rust, Go, C and many other languages during my 40 plus year career but, javascript has never been one of them. I’m sure any seasoned javascript programmer will most likely raise an eyebrow at my attempt at javascript programming but, you need to remember that I’m doing this in my retirement and my enthusiasm for learning yet another programming language has wained somewhat!
So, getting back to the flow, each javascript function does just one task each of which is as follows:
Set rx_time – Sets the time the data was received/processed
Remove RR73 in tx1 – Remove decodes where RR73 is in TX1 instead of a valid callsign
Set Dynamic Icon Colour – Sets the icon colour depending on what type of call is decoded
Maidenhead to LON/LAT – Converts Maidenhead locator codes into LAT/LON Coordinates
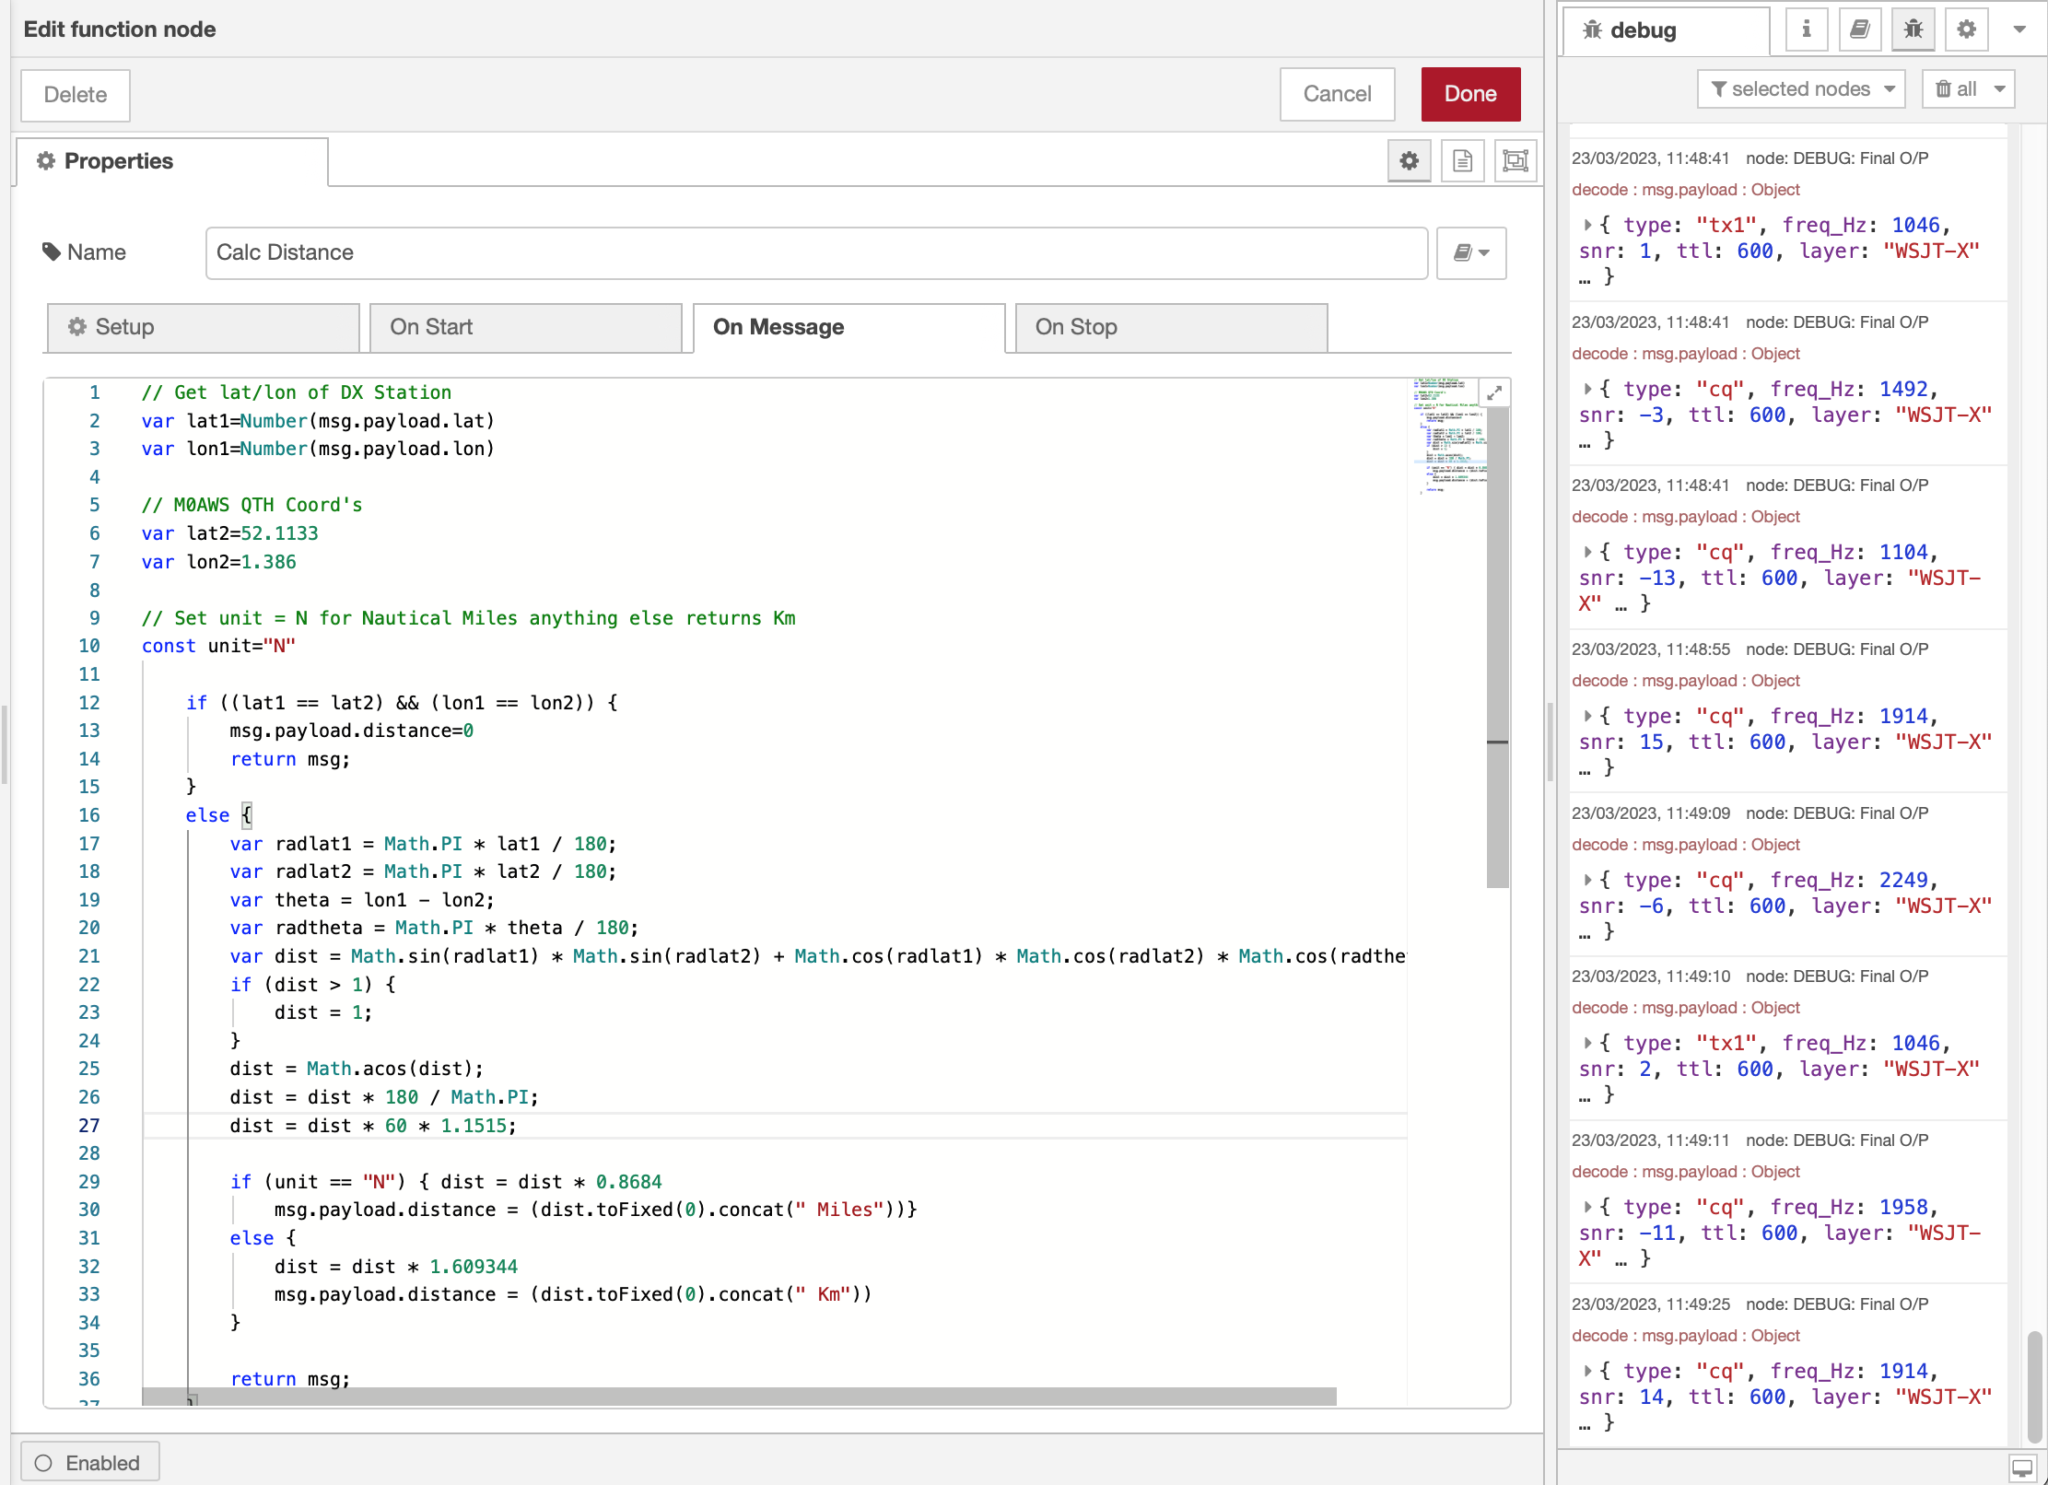
Calc Distance – Calculates the distance between “My QTH” and the DX station
Calc Bearing – Calculates the bearing/beam heading to the DX Station from “My QTH”
Generate Search URLs – Generates the URLs for QRZ and my own online log lookups
Editing the Calc Distance function with debug info in the far right panel
Once all the functions have run the resultant data set is forwarded on to the WSJT-X Stations Map node where it is plotted real time on a world map.
To view the map point your web browser at your PC running Node Red as follows:
http://radiopc.your.domain:1880/worldmap/
Or if you haven’t got a DNS setup at home then just use the IP Address of the PC instead:
http://192.168.100.10:1880/worldmap/
Don’t forget that for all of this to work you must configure WSJT-X to send data via UDP on port 2237 otherwise the flow won’t be able to connect and listen for the decode data.
You may have noticed that there are 3 other nodes that I haven’t mentioned yet. The two green greyed out nodes are Debug nodes that can be enabled when required to help see what is going on in the flow. These debug nodes will display data in the debug panel on the right of the flow editor screen when they are enabled, they are extremely useful for debugging!
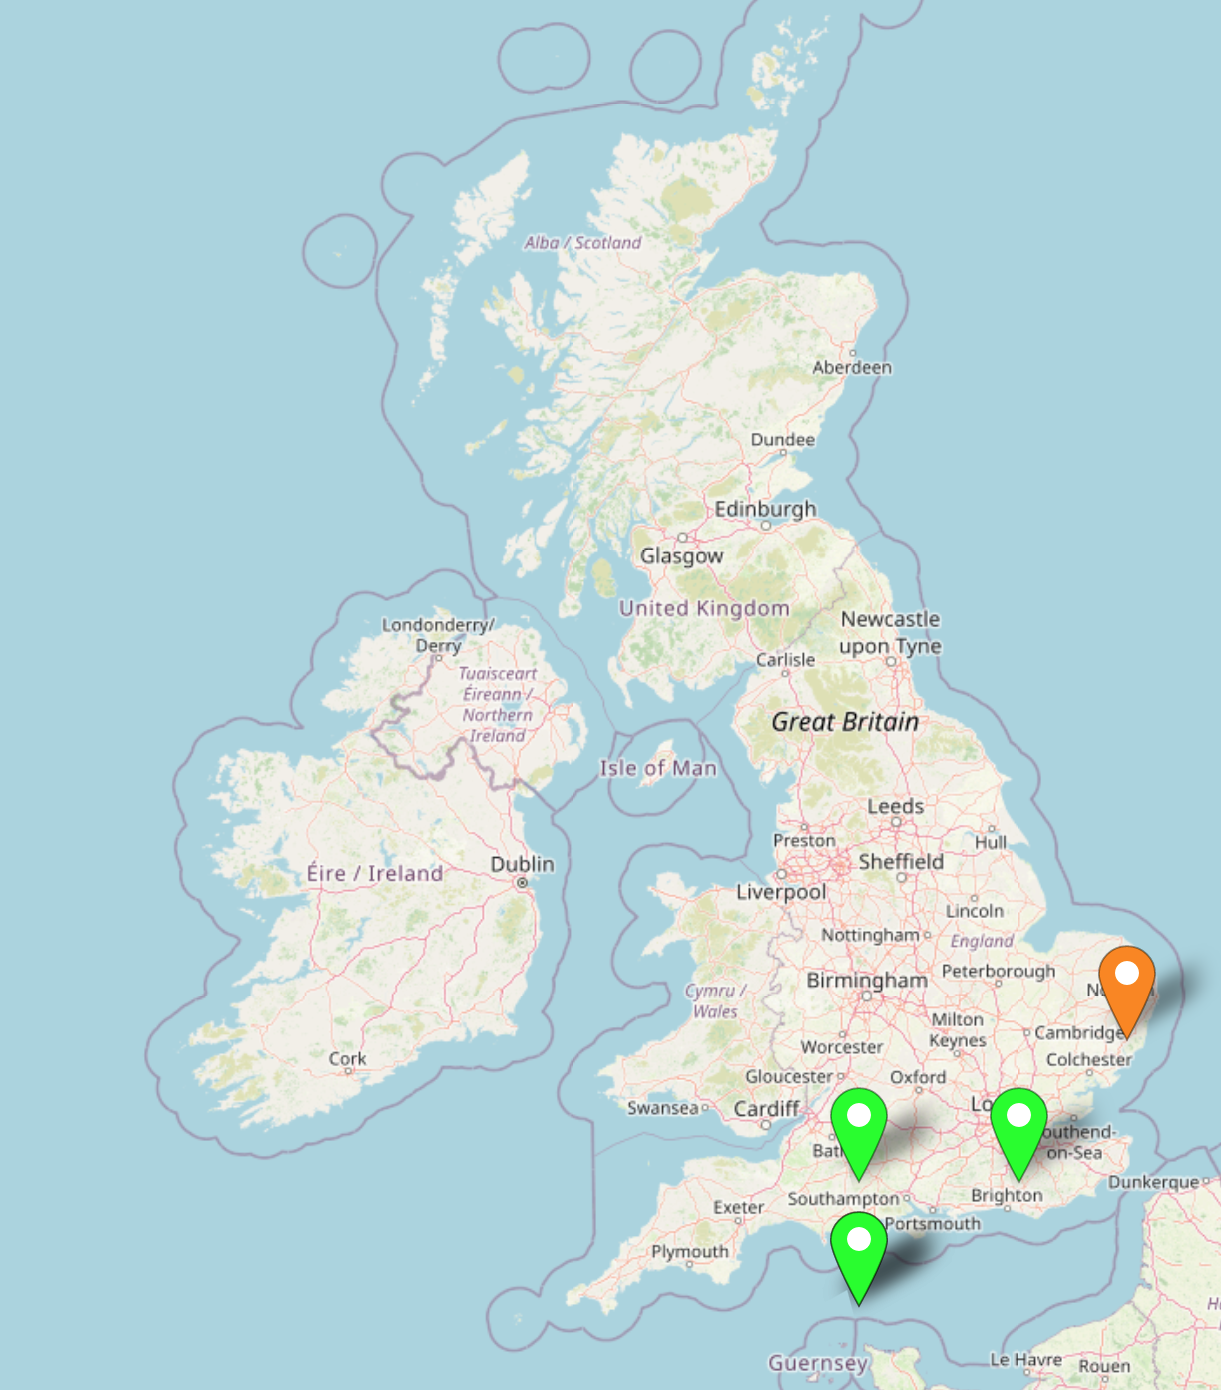
The third is the blue My QTH node, this contains data pertaining to my QTH that is plotted on the map using an orange icon. You can easily edit this node to point to your QTH instead.
WSJT-X Node Red map showing orange icon denoting my QTH
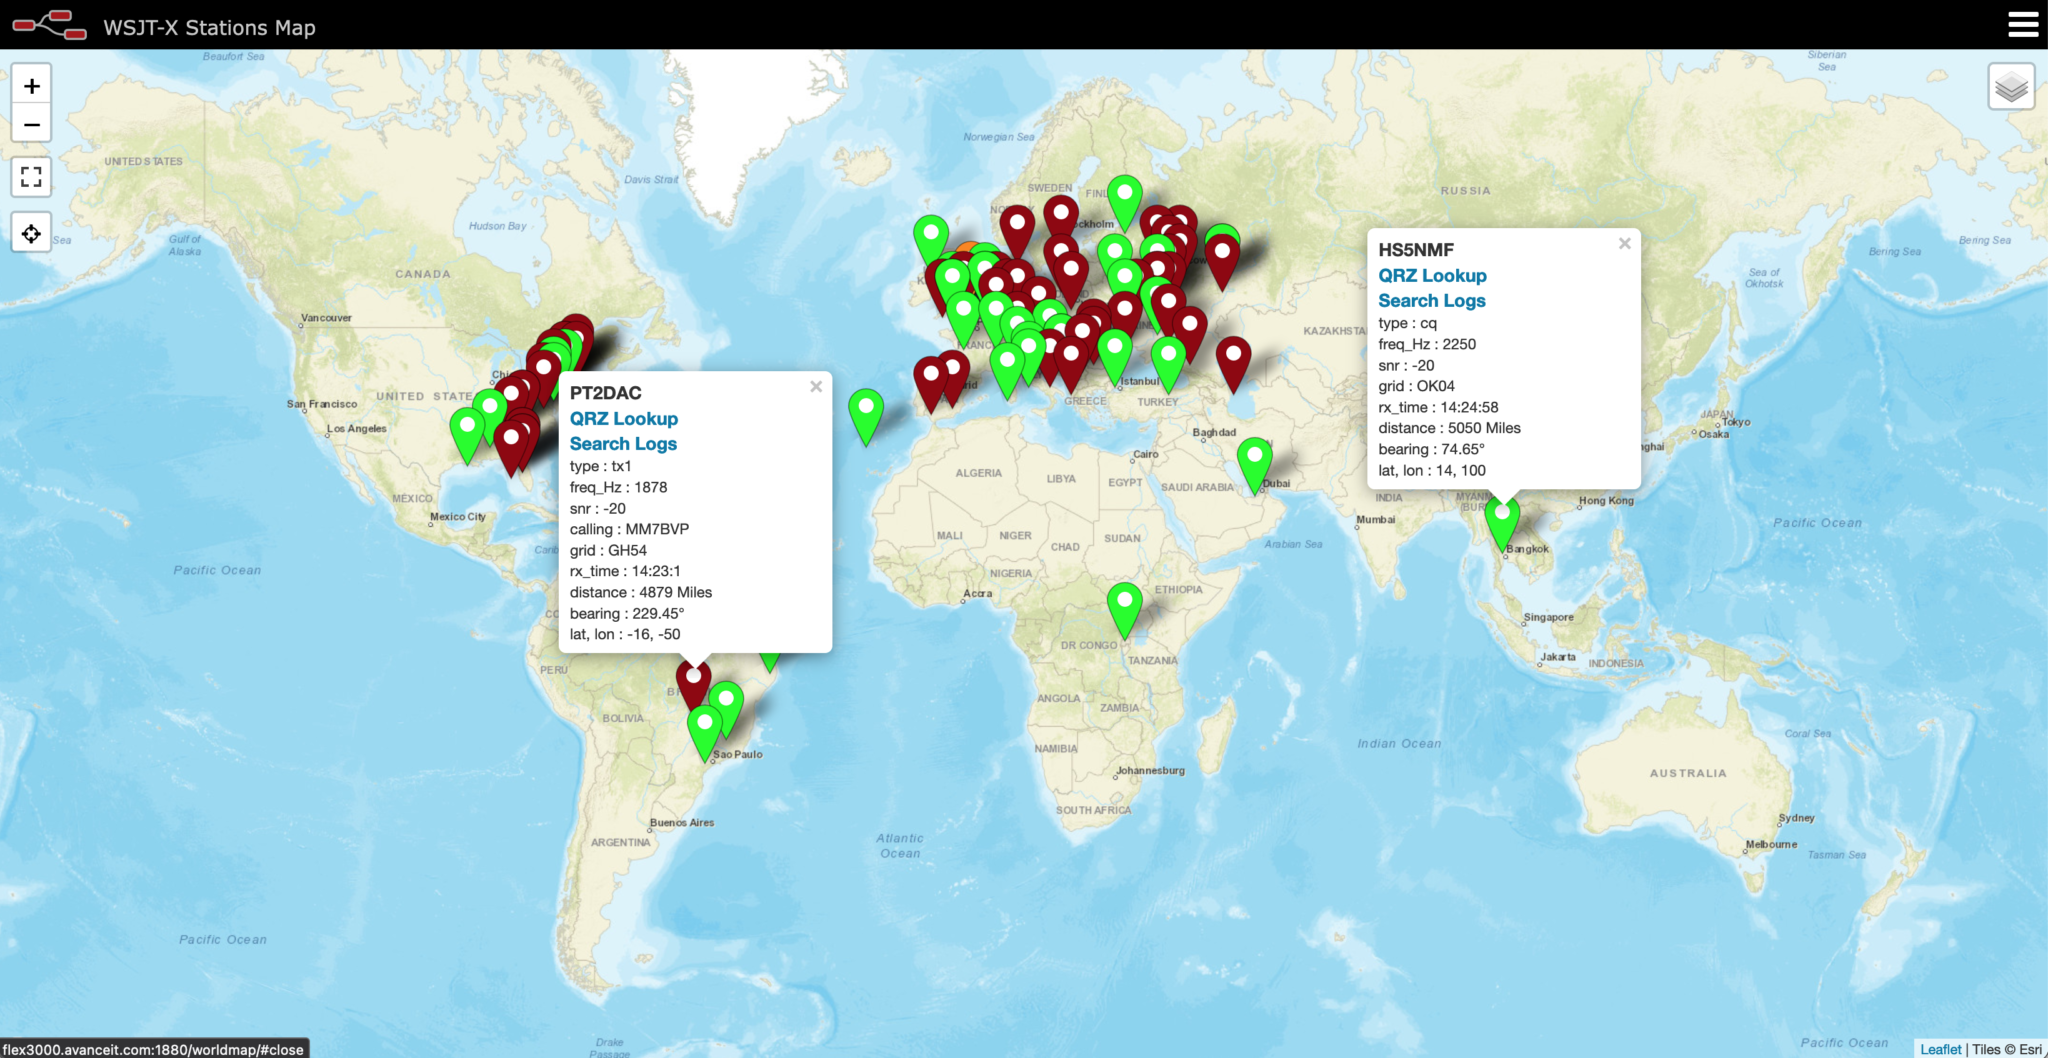
Once the flow is deployed you’ll be surprised how quickly the data starts to be plotted on the map. Stations calling “CQ” are shown by Green icons and stations that are in a QSO with another station are denoted by the Red icons.
Each icon is clickable and will present all the information collected by WSJT-X for each station viewed.
WSJT-X Node Red World Map showing FT8 stations realtime on the 12m Band
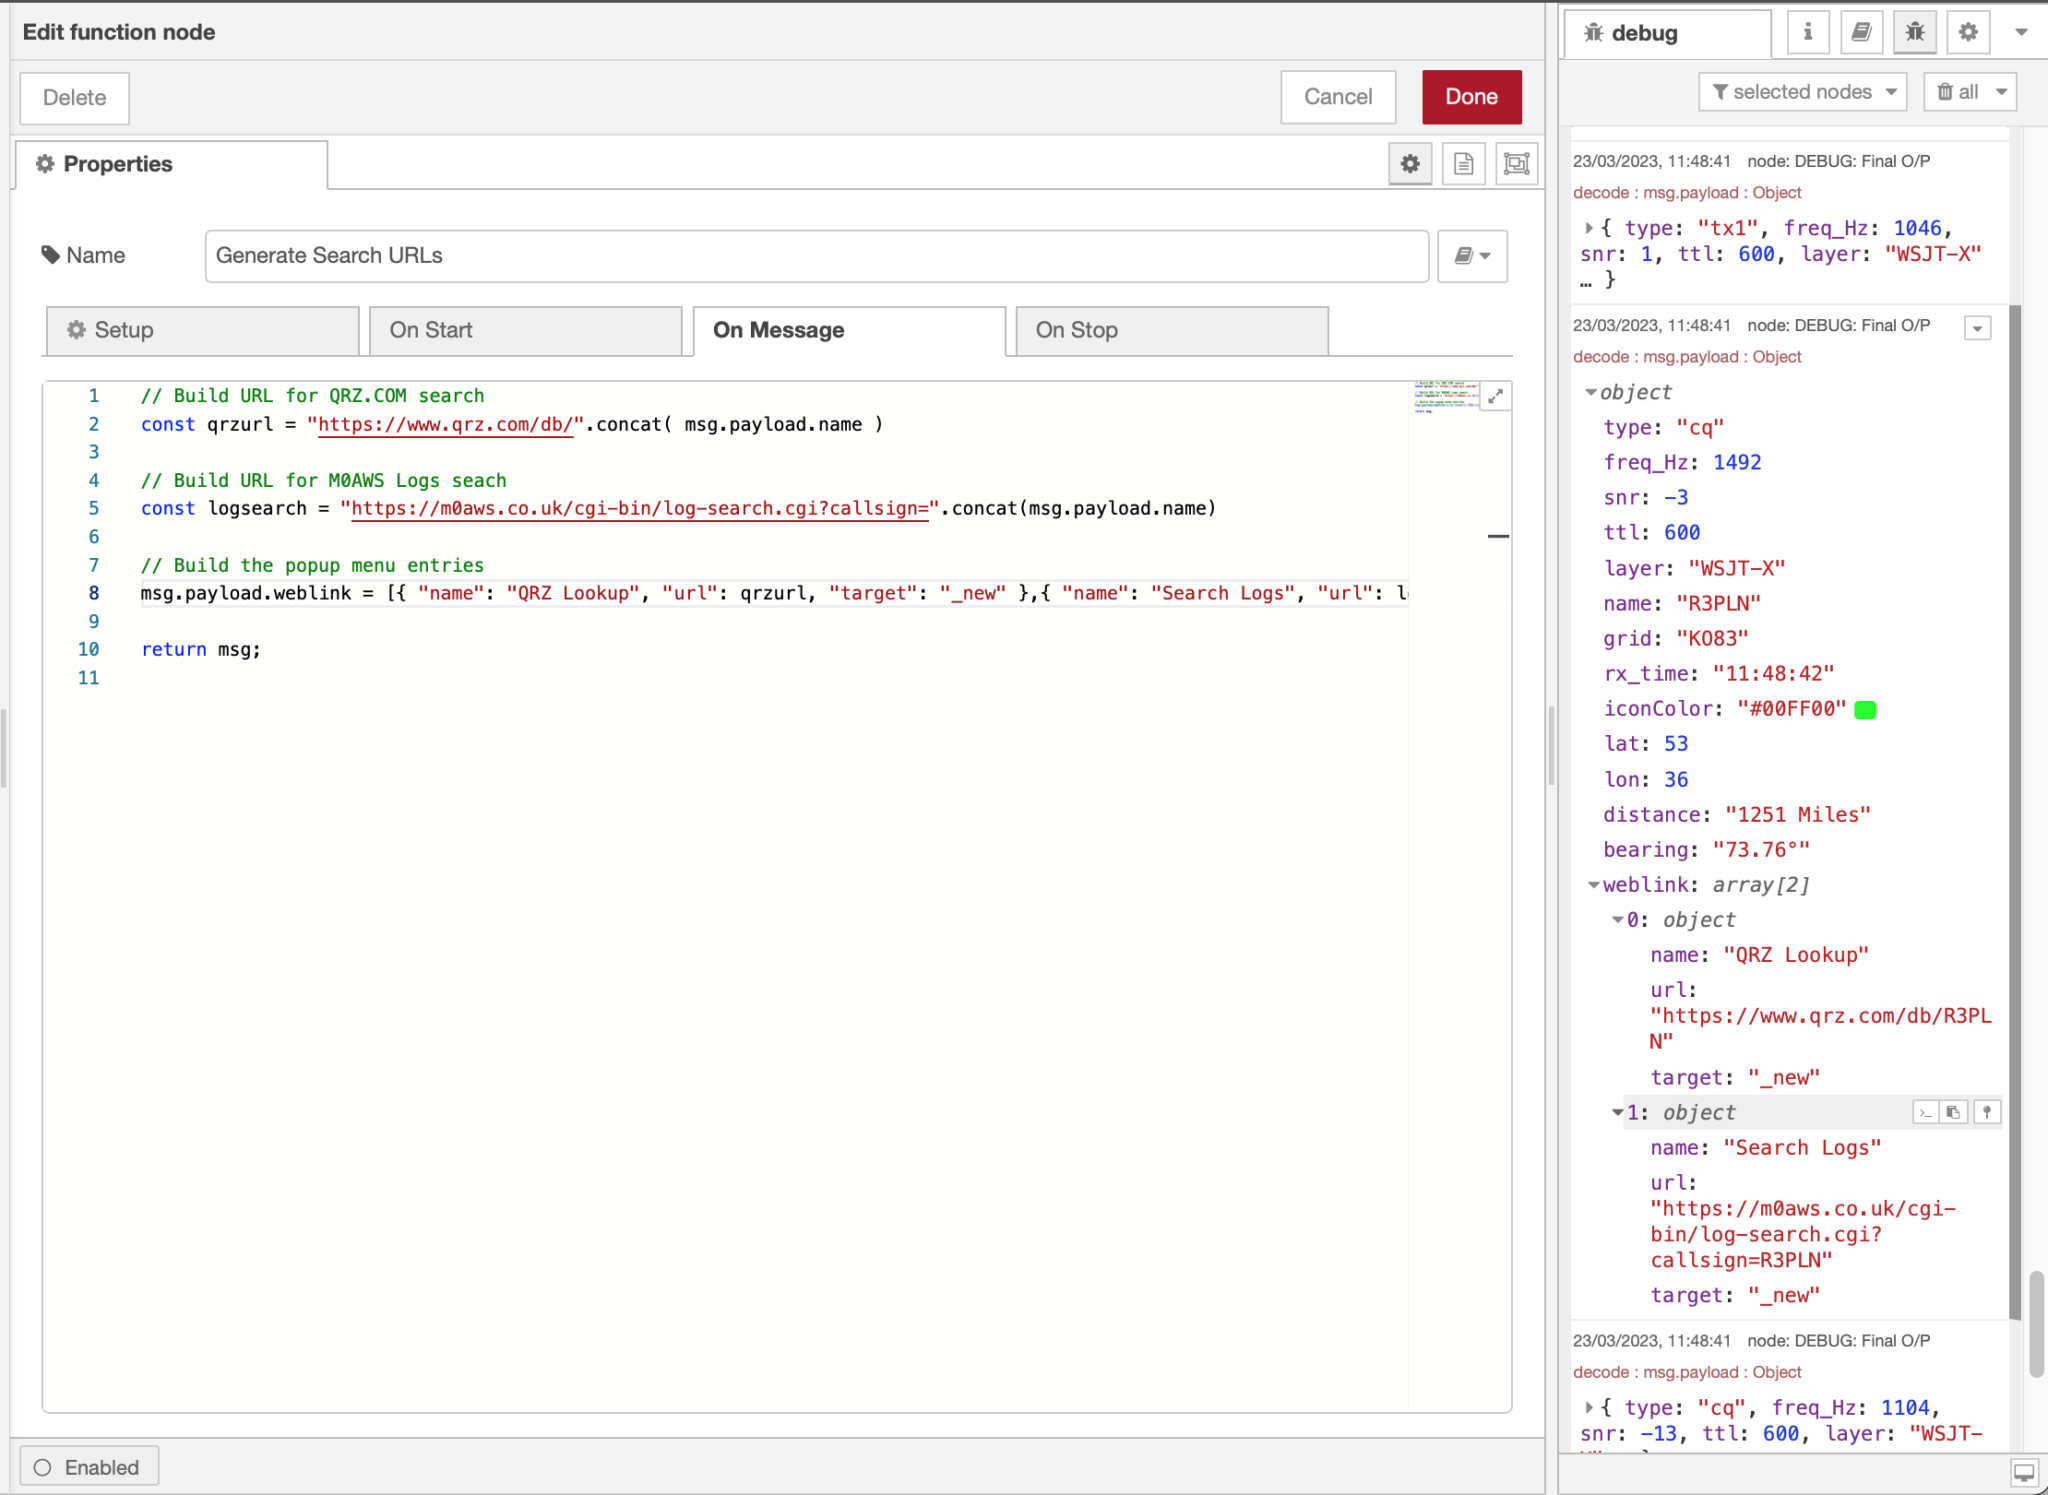
The popup also has two clickable entries, one will take you to the qrz.com page for the station being viewed and the other will search my logs to see if I have worked that station already and if so it will open a new tab showing the information.
Node Red Function Editor showing the Generate Search URLs function
You can edit the “Generate Search URLs” node so that it points to your online logs search engine so that you can view your own log data instead of mine.
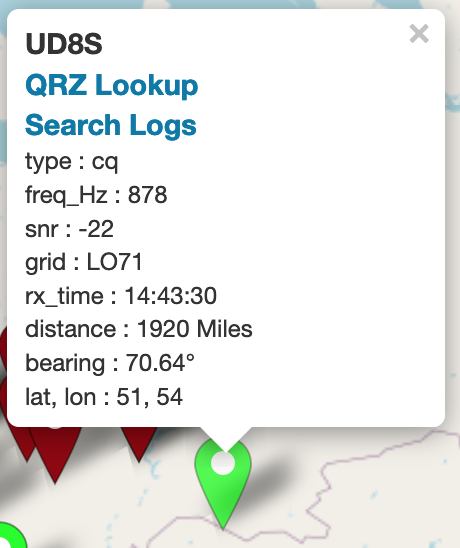
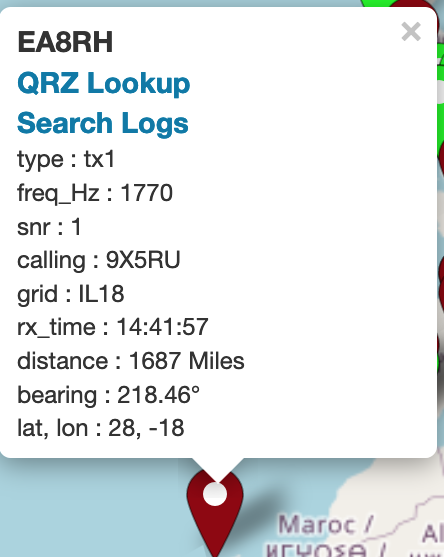
Below is a close up of the popups that are displayed when each icon on the map is clicked. The popups show the information collected from WSJT-X for each station plotted on the map.
Left – Green “CQ” Popup and Right – Red “TX1” in QSO popup
If you fancy trying this out for yourself but, don’t fancy creating all the nodes in the flow manually then I have made an export of the flow available for download. All you have to do is download the file, unzip it and then import it to Node Red and you’ll have everything built ready to play with.
For a couple of weeks now I’ve been playing with Node Red to add functionality to my digital mode applications.
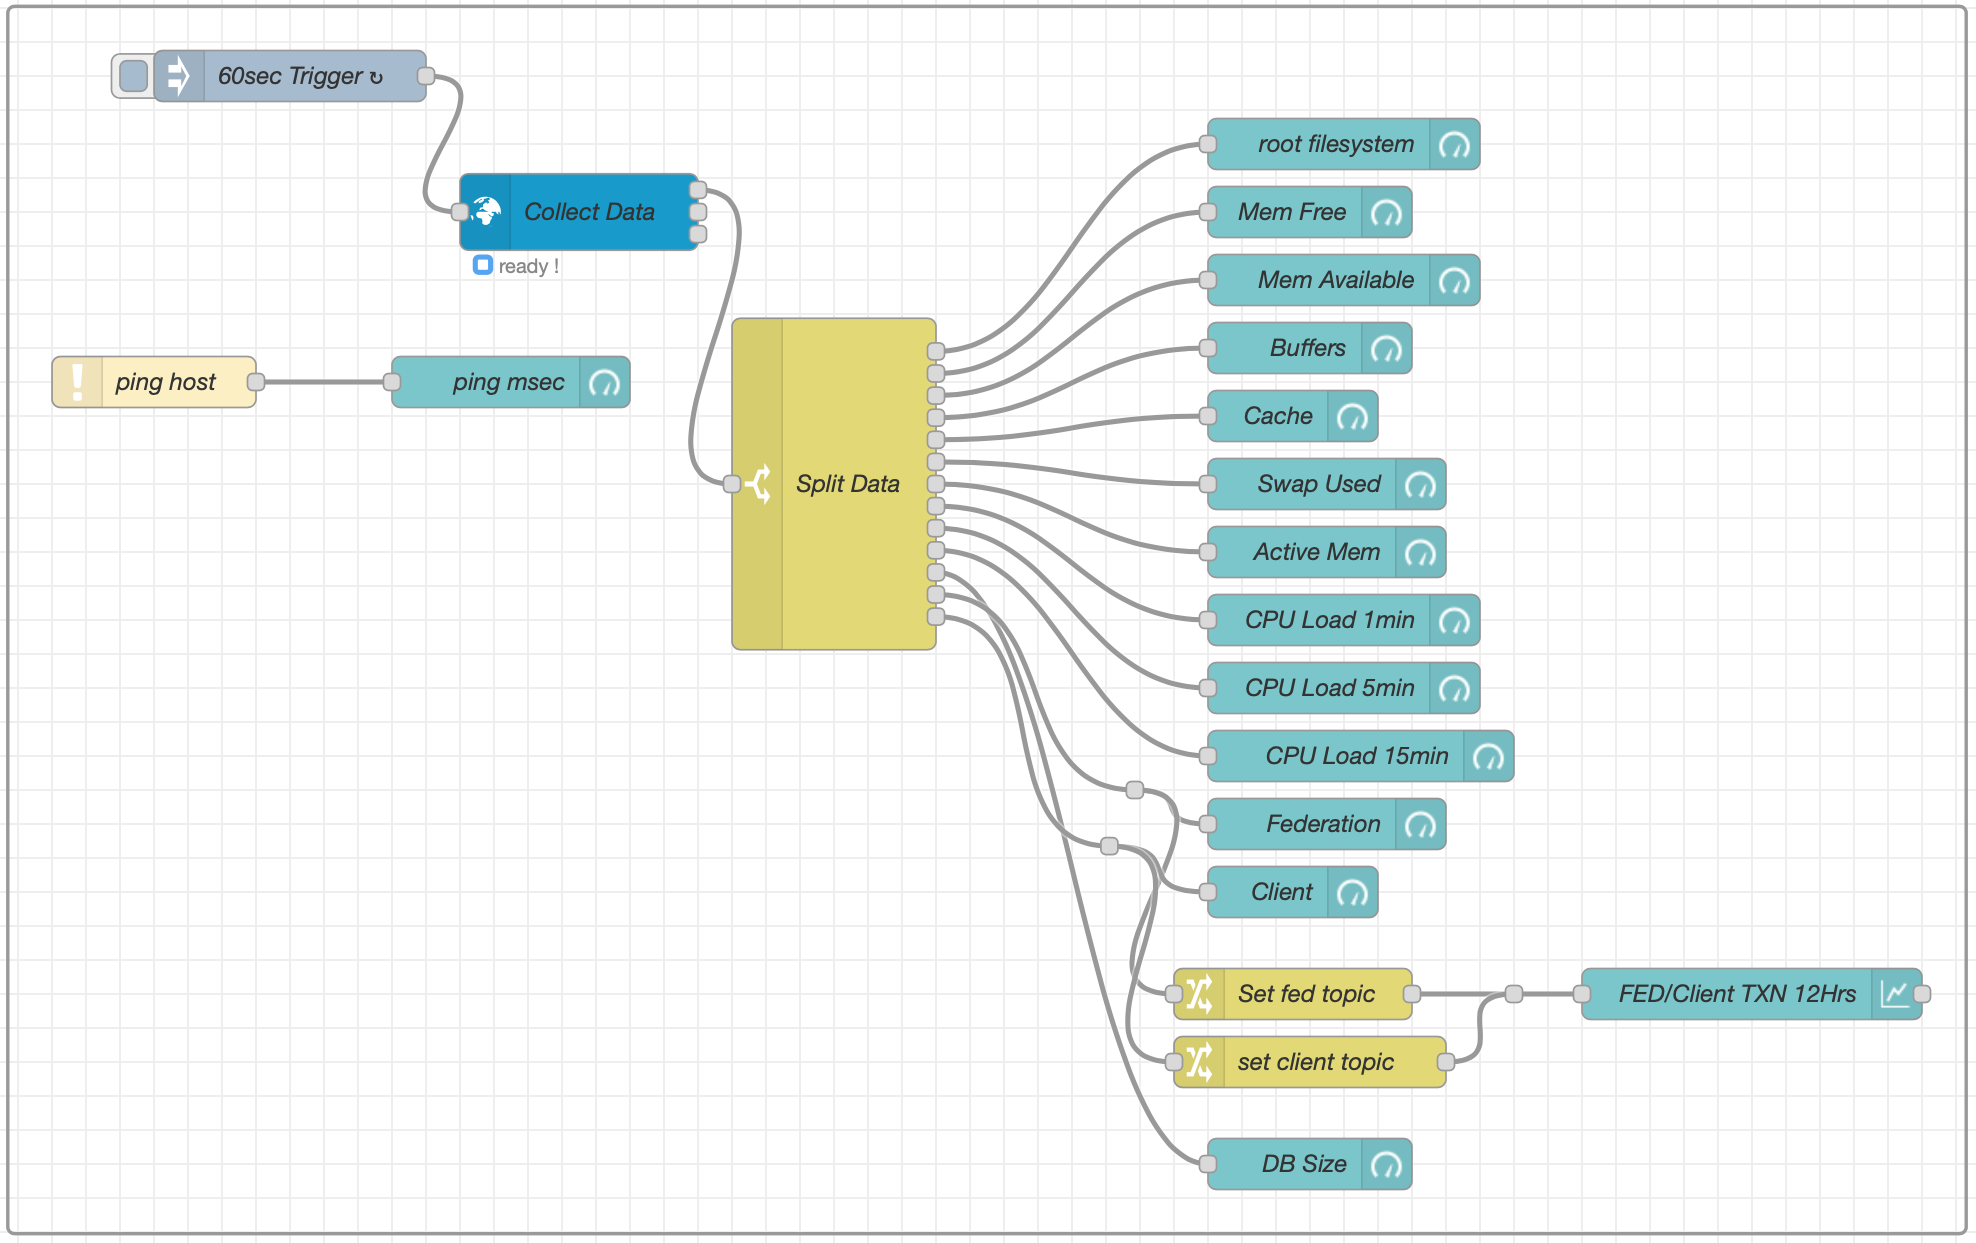
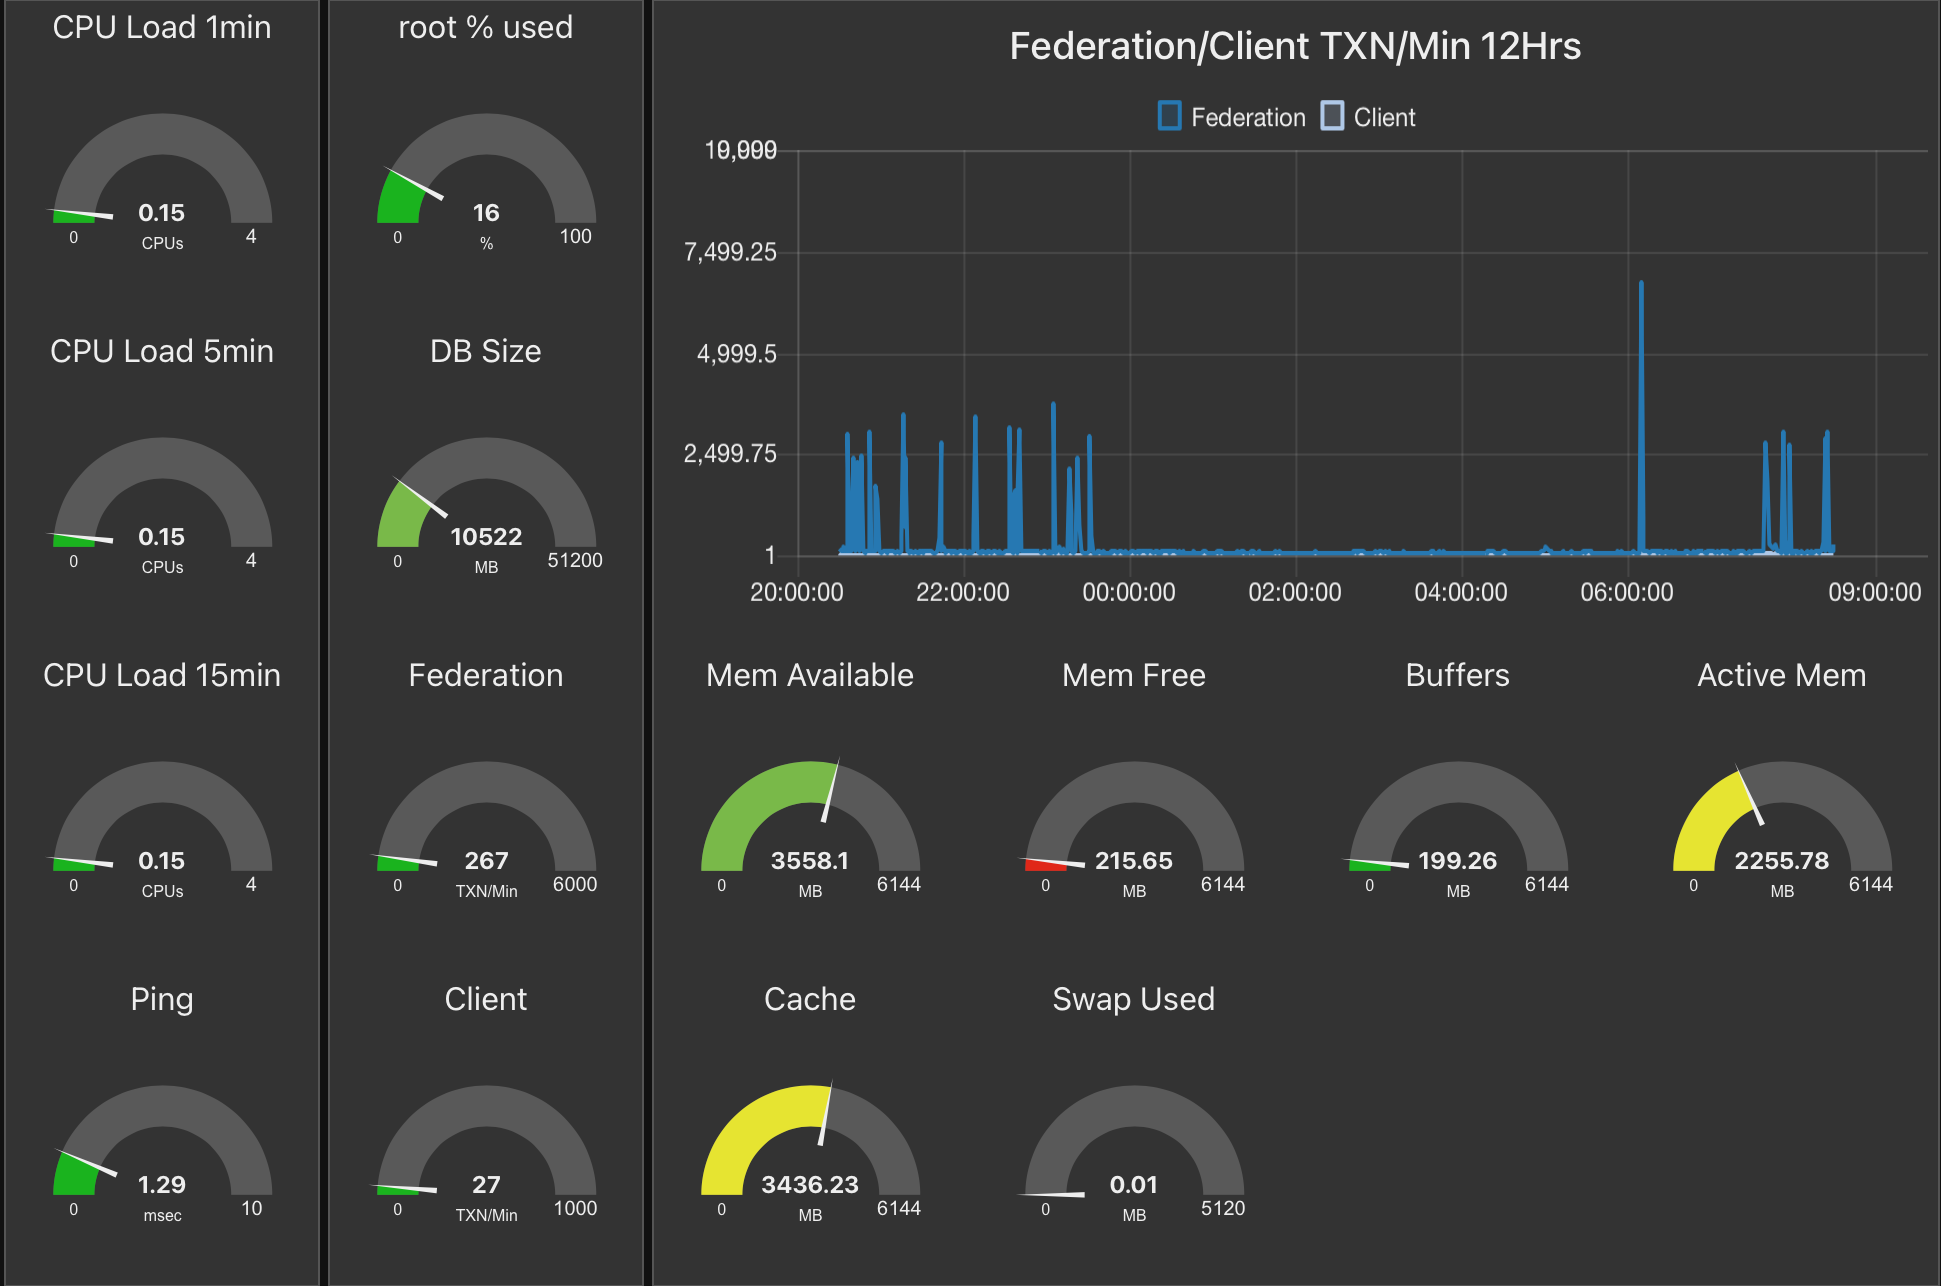
To get to know how it all works I initially used Node Red to create a series of dash boards for my servers and virtual machines to show realtime information on CPU temperature, CPU load, memory usage and storage etc.
Node Red Flow to collect information from a virtual machine (VM)
This worked very well and I was soon able to generate the information I needed in a palatable format. This was a great way to get to know Node Red flow building and introduced me to using gauge and graph nodes in flows.
The resultant Node Red Dashboard for one of my Virtual Machines
Once I had mastered creating dashboards for servers/virtual machines (VMs) I then started to investigate using Node Red to plot data from WSJT-X on a map.
I currently use the PSKReporter website to see stations that I hear on a map as WSJT-X sends the data to the site automatically however, this information is always 5mins or more old. For some time I’ve been wanting to see the information realtime as it is received and so I was hoping to be able to achieve this via Node Red.
Node Red has nodes available for a multitude of applications all easily installed via the Manage Palette menu in the flow editor.
I installed the WSJT-X Decode and World-Map nodes and set about building a flow to capture the data and plot it on a world map.
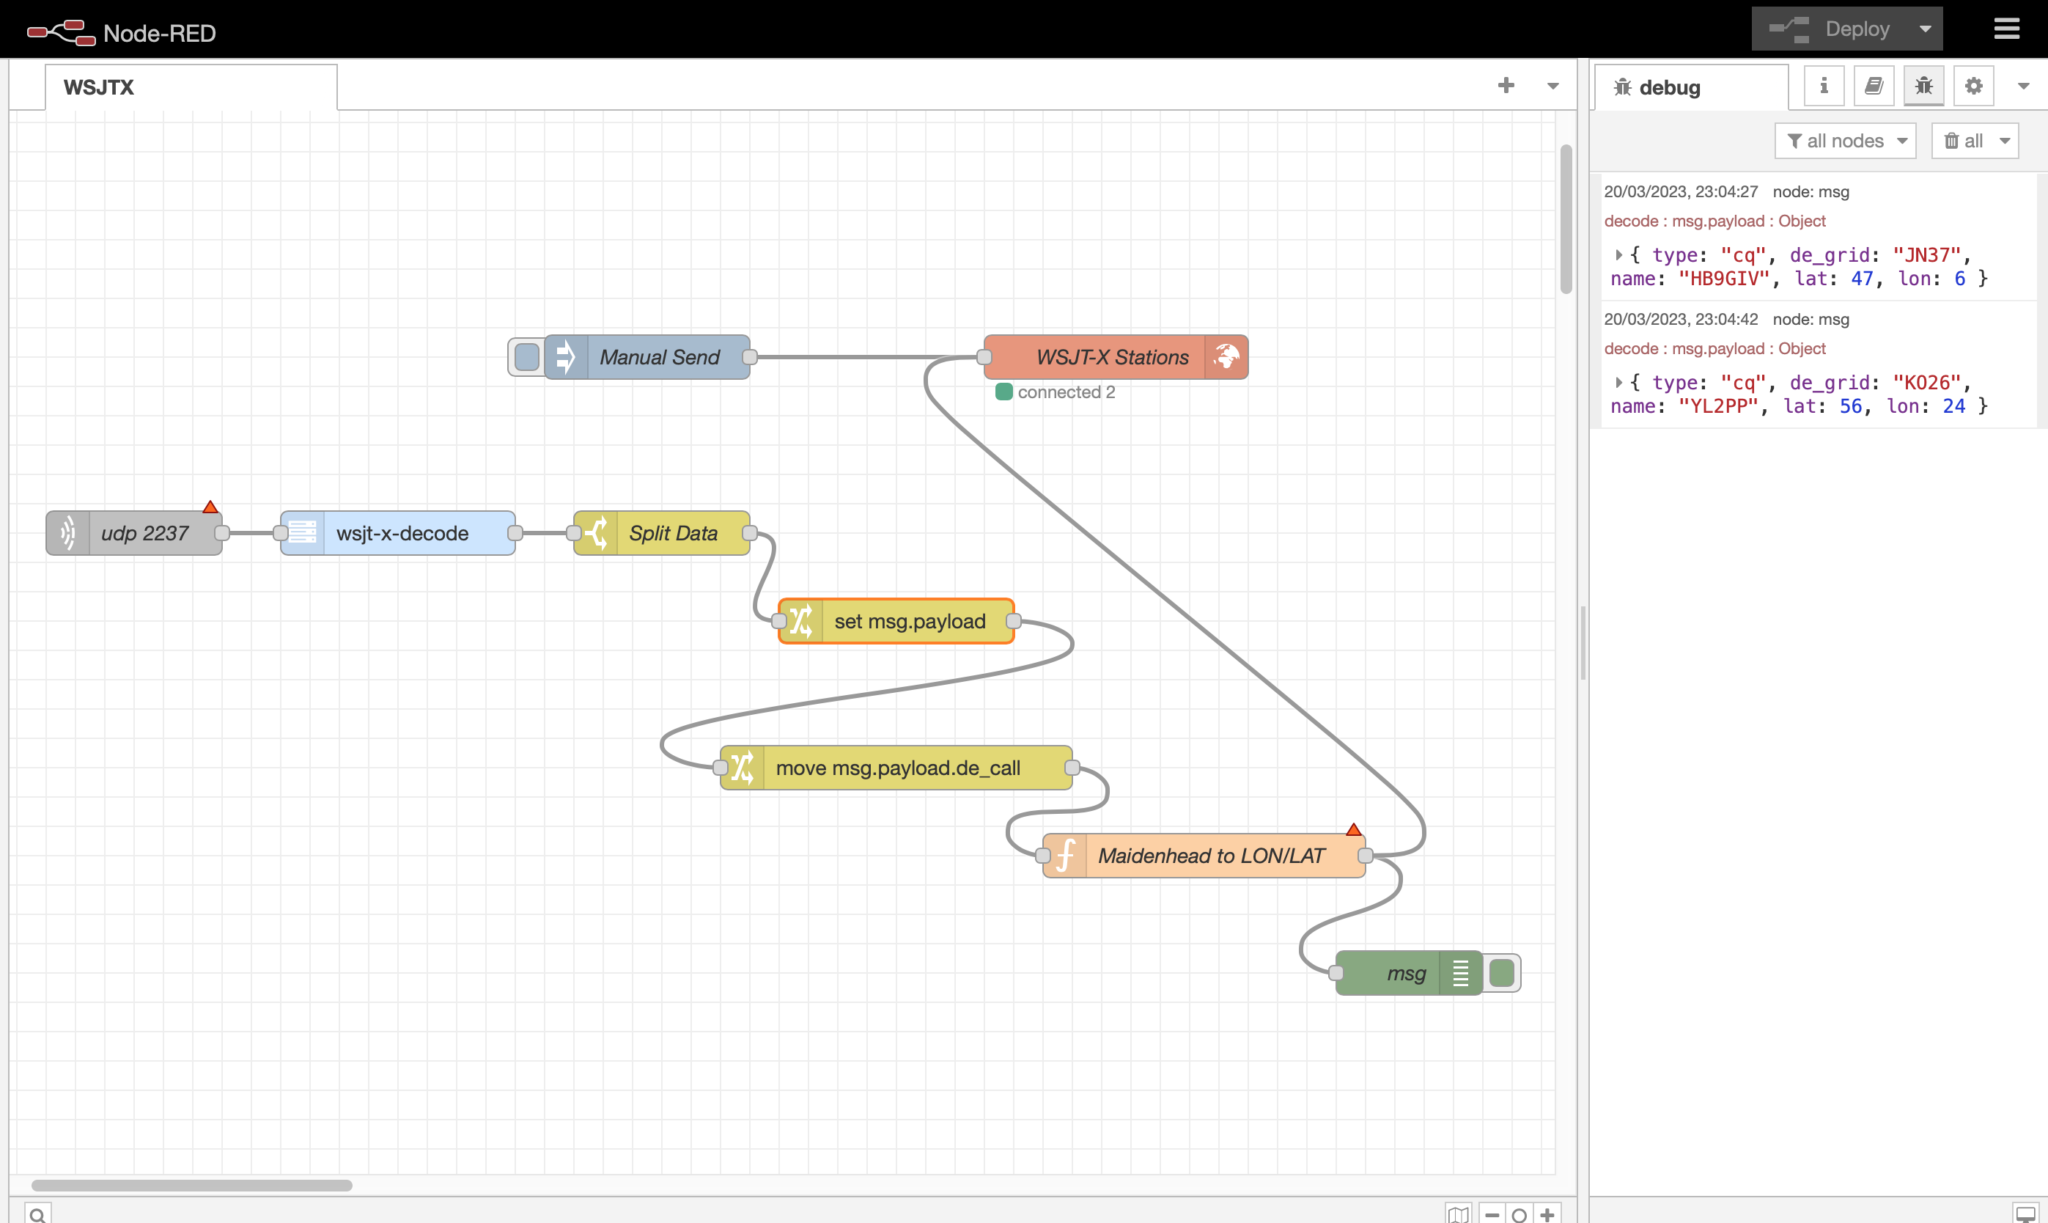
Building a Node Red Flow to decode WSJT-X data and plot it on a World Map
Putting the building blocks of the flow together is fairly straight forward and easily achieved using the excellent flow editor built into Node Red.
I configured WSJT-X to make the decode data available via UDP on port 2237 and then started the flow by creating a UDP node that connects to WSJT-X using the same port. The data immediately started flowing and I could see the information via a debug node.
I can’t stress enough how useful debug nodes are in Node Red. You can add debug nodes onto any output on any other node to capture the data as it flows. This gives you the ability to check what you’re getting is what you expected and also to see the format the data is in. The debug data is displayed in the debug panel on the right of the flow editor in realtime and gives you a great view of what is going on in your flow.
I decided to start with capturing the data for stations calling CQ as this was easily identifiable in the JSON object coming out from WSJT-X.
Passing the output from the WSJT-X-Decode node into a switch node I added a rule that filtered out data containing “type: “cq” and passed it onto the next switch node that created a payload consisting of the station callsign, maidenhead grid square and type so that it could be passed onto the next node for processing.
The next node in the flow is a function, this is where it gets a bit tricky. To be able to plot data on the map we need the Lat/Lon coordinates of the station making the CQ call. Since WSJT-X uses maidenhead locator data I needed to convert this to Lat/Lon coordinates before passing the data to the map node to be plotted.
Since Node Red is written in Java all the functions have to be written in javascript. The problem here is that I am not a javascript programmer and so this meant I’d need to learn yet another programming language. Unfortunately Node Red doesn’t allow functions to be written in C, Rust, Go or Python, all languages that I know well and after retiring from over 40 years in the UNIX/Linux/IT world my enthusiasm for learning yet another programming language has wained somewhat.
Being so close to having a working solution I pressed on and after much head scratching I finally put together some javascript that converts the maidenhead locator information in to good old fashioned Lat/Lon coordinates. I’m sure a seasoned Javascript developer wouldn’t be impressed with my code but, it works and does what I need and so I’m happy with it for the time being.
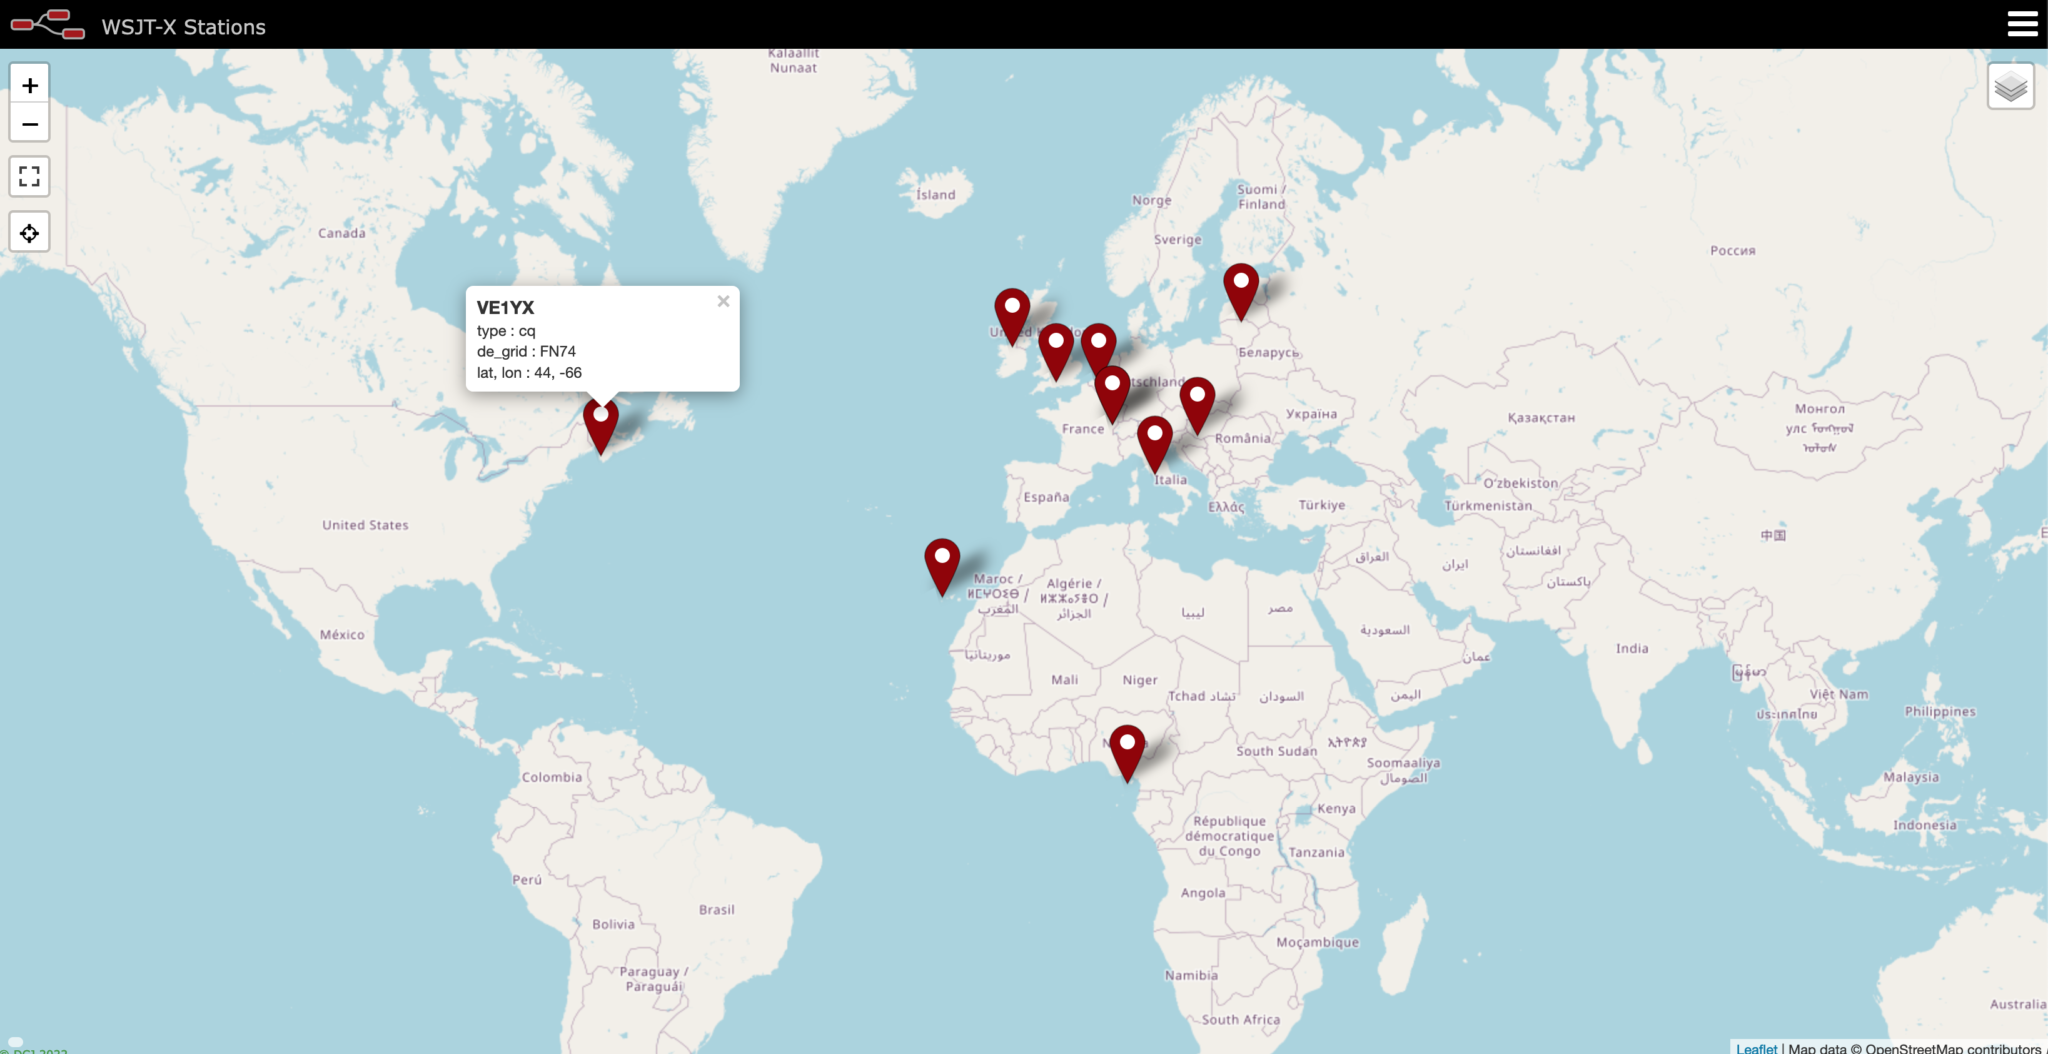
WSJT-X FT8 stations calling CQ on the 60m Band plotted on a Node Red World Map
Once I had the location information converted it was just a matter of passing the data to the world map node in the correct format for it to be plotted realtime.
As you can see on the screenshot of the map above, it worked extremely well with stations popping up as they were decoded by WSJT-X.
I now need to refine the data sent to the map so that it shows the frequency the station is calling on, the time they made the CQ call and the mode (FT8/FT4 etc) being used.. I would also like to add the distance from my QTH to the station calling CQ to round the information off however, this will mean writing another javascript function which, I’m not sure I want to dive into just yet.
I also need to add into the mix stations that aren’t calling CQ but, who’s callsign and grid square are passed on from WSJT-X. This will mean I will then be able to add to the map those stations that are actively working other stations and maybe I might even be able to show a line between the two stations that are in QSO.
This has been a fun but, steep learning curve however, it will certainly add some great functionality into my radio room and enhance my radio HAM addiction even further.
More soon …
We use cookies to ensure that we give you the best experience on our website. If you continue to use this site we will assume that you are happy with it.