I’ve recently built a new AllStarLink (ASL) node for my MB7IBW gateway that I have recently brought up on air on the 2m band.
AllStarLink 3 has a lot of changes in it when compared to the previous version and this of course impacts my Node-Red Control Dashboard that I’ve been using to manage my first ASL node for well over a year now.
To build the node I used the RaspberryPi imager and added the AllStarlink 3 image as detailed on the allstarlink.org website.
Installing the system this way makes it pretty easy compared to previous installs but, it comes with some quirks which cause issues with Node-Red.
From the outset the plan has always been to have AllStartLink 3 and Node-Red running on the same Pi4 to keep it totally self contained. This was easy enough to achieve and works without issue.
Node-Red Control Dashboard for AllStarLink 3
Installing Node-Red onto a Pi4 is really easy and is fully documented on the Node-Red Website.
Once the AllStarLink 3 operating system was installed on my SD card, booted and operational I installed Node-Red. I soon realised that there were a few things I had to do before loading the Node-Red flow.
AllStarLink 3 no longer logs connect and disconnect messages in the connectlog like it did in AllStarLink 2. To get logging working again I had to create two new BASH scripts as detailed below and put them into /etc/asterisk/myscripts.
For the connect information I created the BASH script as detailed below.
Next I disabled the temporary filesystems that are used by default for the apache and asterisk logging as it’s useful to keep the apache logs for debugging and I needed the asterisk logs for the Node-Red dashboard.
Disabling the temporary file system is very easy to do, just edit the /etc/fstab and comment out the two lines as shown below.
# Comment out the next line for persistent Apache logs
#tmpfs  /var/log/apache2        tmpfs   defaults,noatime,nosuid,nodev,noexec,mode=0775,size=32M 0 0

# Comment out the next line for persistent Asterisk logs
#tmpfs  /var/log/asterisk       tmpfs   defaults,noatime,nosuid,nodev,noexec,mode=0775,size=32M,uid=102,gid=106 0 0

# Note: These lines are wrapped, should be on 1 line in the /etc/fstab
Once the entries in the /etc/fstab were commented out I rebooted the Pi4 to get persistent filesystems.
The final thing that had to be done was to allow user repeater to use sudo without a password so that it could be used to perform reboot/shutdown/process restart as user root from within the dashboard.
# /etc/sudoers

# Allow repeater sudo without password
repeater ALL=(ALL) NOPASSWD: ALL
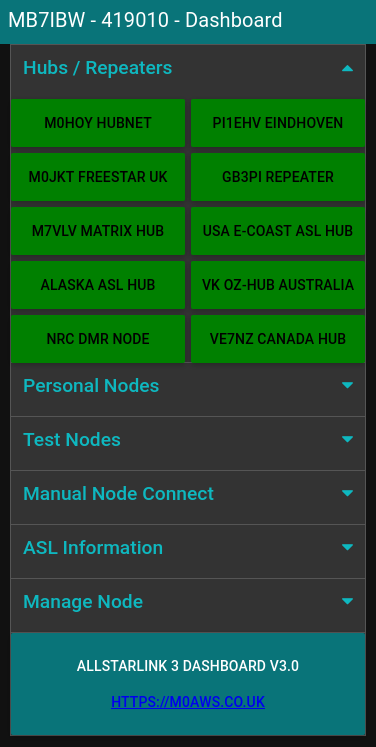
Once this was all done I imported the Node-Red flow, configured the SSH nodes with login credentials for the Pi4 (important to use the user repeater for SSH), clicked deploy and the dashboard was ready for use.
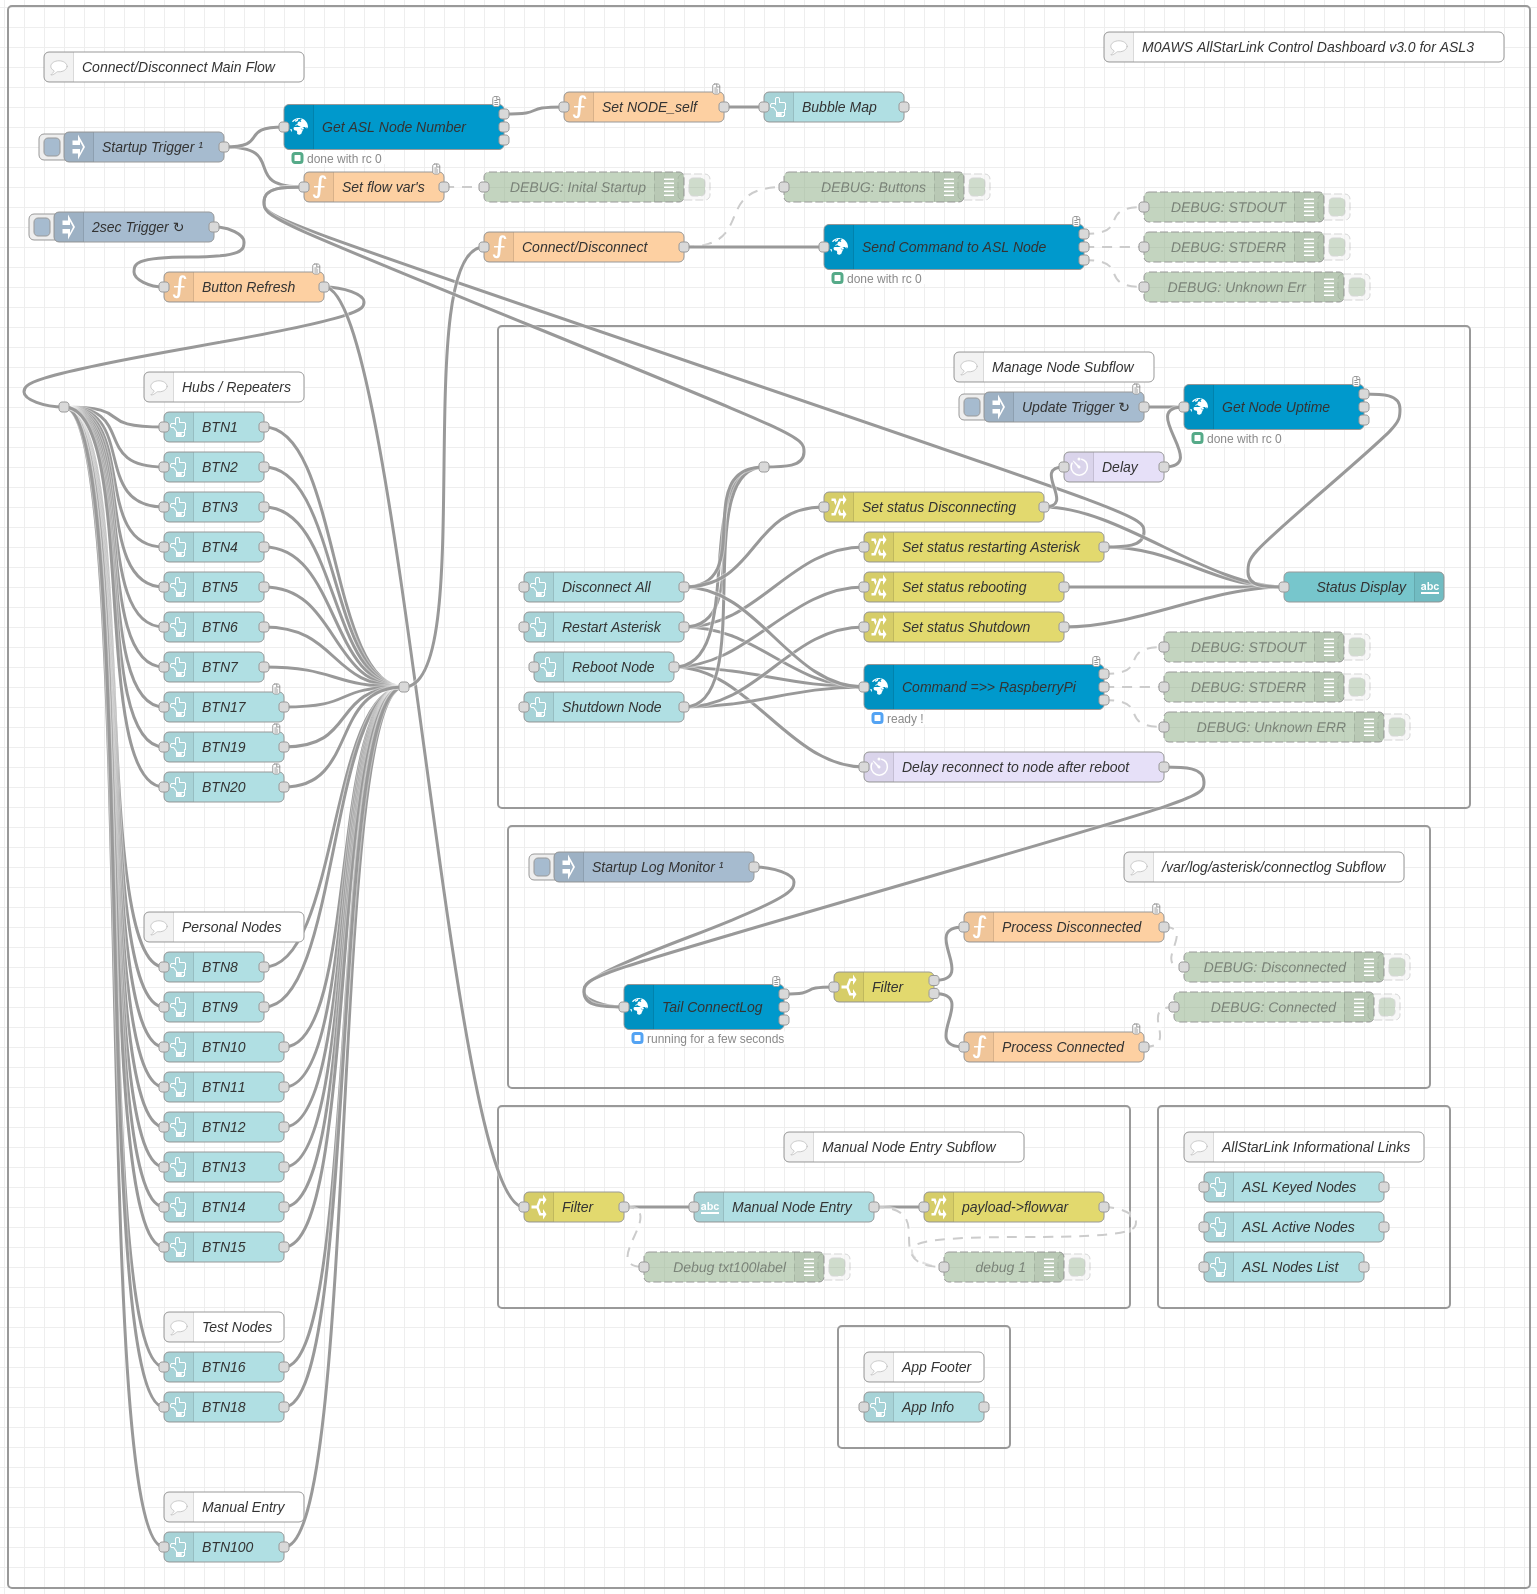
Node Red AllStarLink3 Control Dashboard Flow
I’ve been using the dashboard for a few weeks now and it’s running perfectly, without error.
If you want to build your own Node-Red Control Dashboard for your AllStarLink 3 node then, just download the flow using the button below and import it into your flow editor.
I’ve spent some time this afternoon modifying my Node-Red Dashboard for controlling AllStarLink nodes to work with the new AllStarLink version 3.
My original AllStarLink Control Dashboard was designed to work with AllStarLink 2 which I have running on an old RaspberryPi 3b on the 70cm band. The dashboard has worked reliably ever since deployment and is in use daily.
With the release of AllStarLink 3 and all the changes that it entails I’ve had to make a few changes to the dashboard flows in order to make it compatible with AllStarLink 3 nodes.
This entails not only flow changes but also the addition of two new bash scripts that are called by Asterisk to log connect and disconnect messages as they are not logged by default any more. (Seems a bit of a step backwards)
Node-Red AllStarLink Control Dashboard v3.0 for ASL3
The changes also entail disabling the temporary filesystems used by default in the new ASL3 build so that log files etc become persistent.
I’ll spend some time using the new dashboard to ensure it’s working correctly and then will release it into the wild for all those that are brave enough to move over to AllStarLink 3.
The articles I write for the blog are mostly technical but, I thought it was about time that I wrote this article as it’s been buzzing around inside my head for some time now.
So, what are the 5 things that I have found revolutionary in my shack that have brought new, exciting ideas and projects to life making amateur radio more enjoyable.
1: A RaspberryPi Single Board Computer
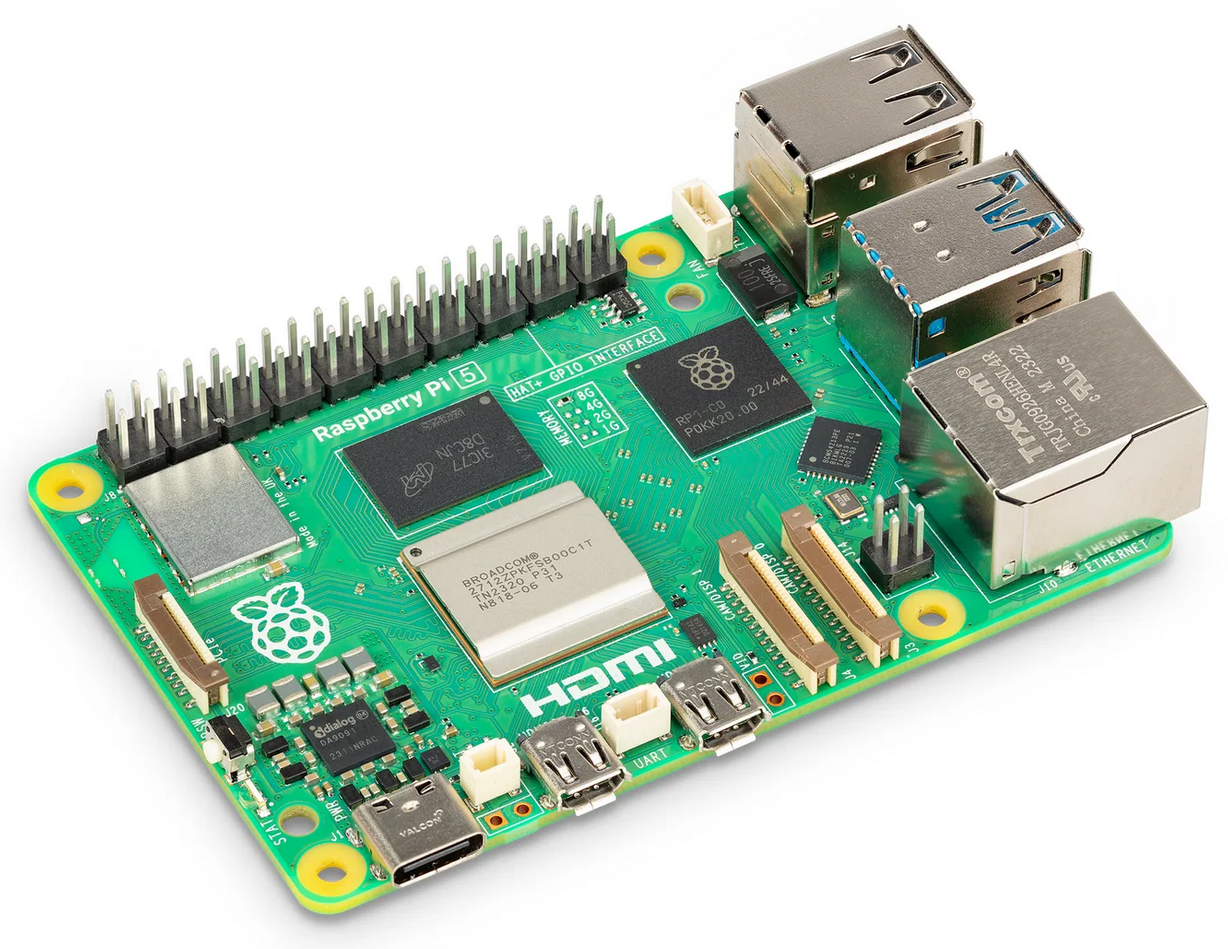
RaspberryPi 5 Single Board Computer
Ever since the first RaspberryPi Single Board Computer (SBC) was released I’ve been a huge fan. This little credit card sized number cruncher has been the base for so many projects, it has to be the first on my list.
The RaspberryPi SBC has been through a few iterations since its initial conception and is now powerful enough to take on most tasks that any radio HAM is going to throw at it.
So, what have I done with them?
Well I’ve used them to run Node-Red services for my many web app dashboards that control things like my QO-100 Satellite Ground Station, UPS power monitoring, Internet speed graphs, server and virtual machine monitoring, AllStarLink nodes, hosting websites, building an SDR shortwave receiver, running HAM Clock / Open HAM Clock, developing my own software, hosting virtual machines and a whole host of other fun and interesting things. I’m even writing this article using my RaspberryPi 500+ computer that is my daily desktop PC.
There are an endless number of things you can do with a RaspberryPi to bring new life and functionality to your radio hobby.
Want to get into Amateur TV? Want to decode digital modes real time? Want to track aircraft in the sky real time on a virtual radar screen? Want to search the shortwave bands for stations of interest? Want to host your own blog and website?
All these things and a lot more are easily within reach with a RaspberryPi.
The RaspberryPi is only limited by your imagination, the more imaginative you are the more your number crunching little friend will do.
2: A 3D Printer
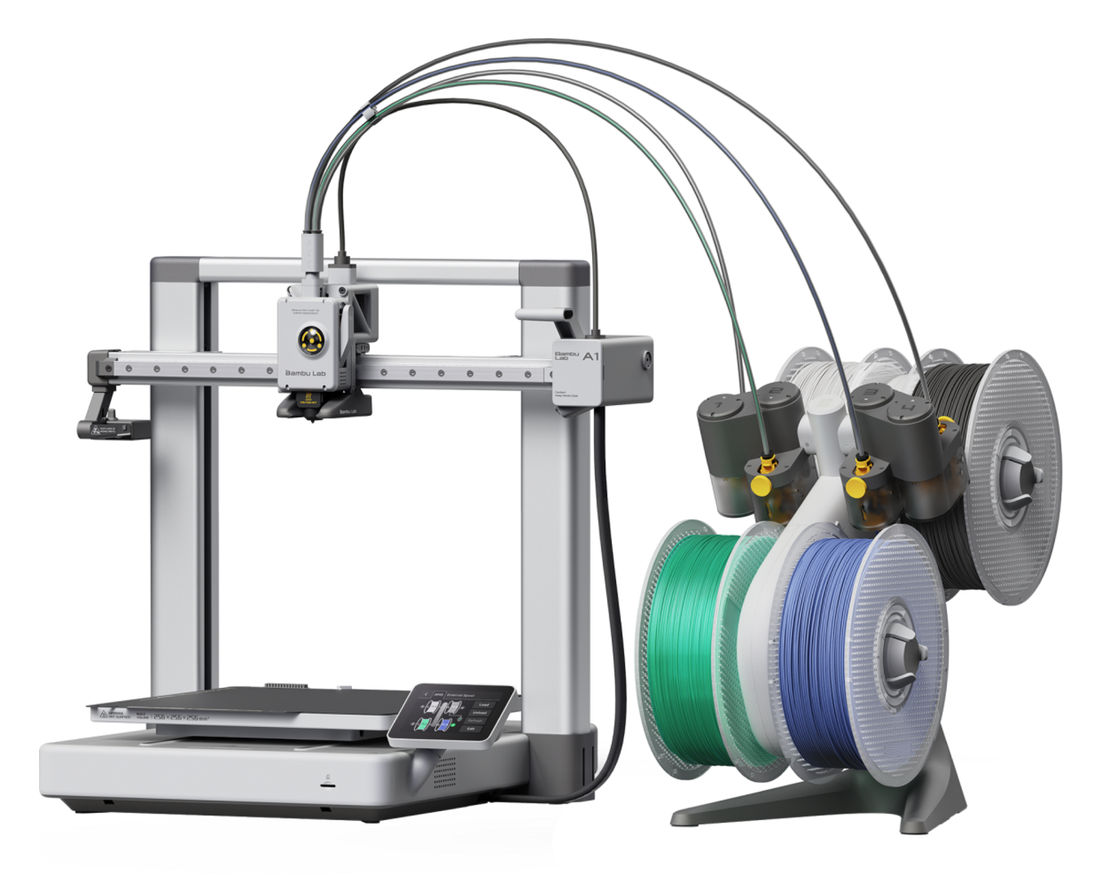
Bambu Lab A1 Combo 3D Printer
Every HAM should have a 3D printer. These manufacturing marvels bring a new level of quality, design and simplicity to your HAM radio projects. I’ve found it incredibly useful since venturing into the rabbit hole that is 3D printing. When I think back to the weeks and months of my life I’ve spent making cabinets and boxes out of sheet metal, aluminium or wood for the numerous projects I’ve built over the years, a 3D printer would had made my life so much easier. 3D printing has revolutionised the making of things for the Amateur Radio home brewer.
There’s a multitude of useful things on websites like Printables, Thingiverse , Makerworld and others where you can just download the files and print high quality designs for all those things you’ve wanted to do but, don’t have the time or inclination to craft by hand.
The real satisfaction with 3D printing comes from designing your own things and making them. My first project was to design and print a fan cooling system for my Xiegu XPA125B amplifier.
From the factory the amp is passively cooled and doesn’t take long for the heat-sink to become saturated resulting in a high operating temperature. I was never happy with this and so was determined to resolve the problem.
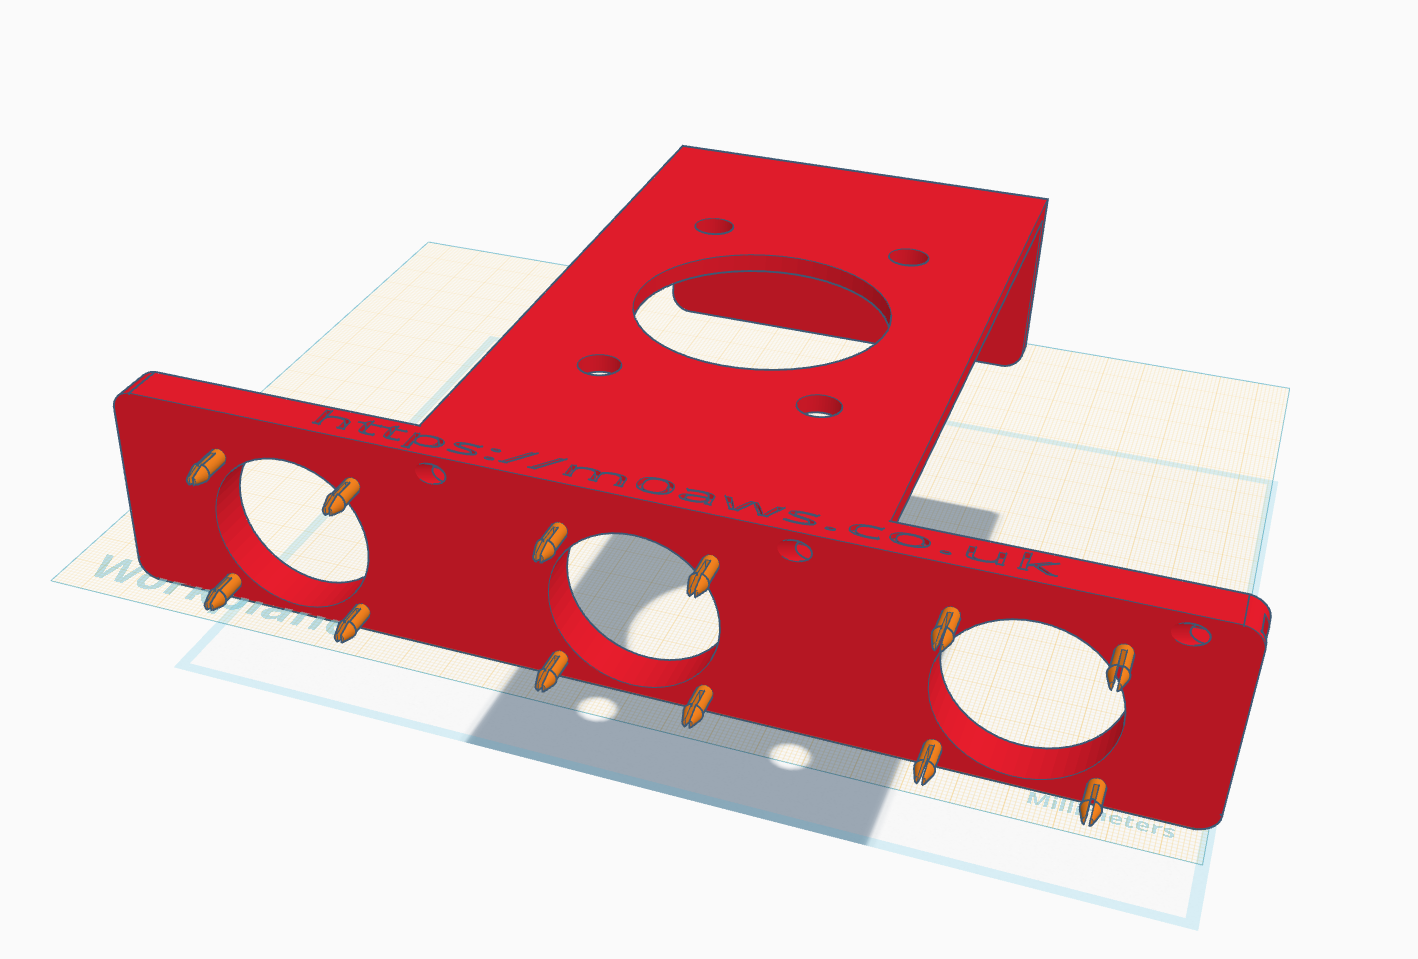
Getting to grips with TinkerCAD was a bit of a vertical learning curve but, after a few mistakes and design mishaps I soon had it under my belt and pressed on with designing the cooler unit.
Designing the Xiegu XPA125b cooling system using tinkerCAD.
It’s not until you start designing and manufacturing things that you suddenly realise how much effort goes into them but, I persevered and over the period of about a week or so I had a perfectly fitting, operational cooling system that kept the amp super cool regardless of how long I waffled on for on the HF bands.
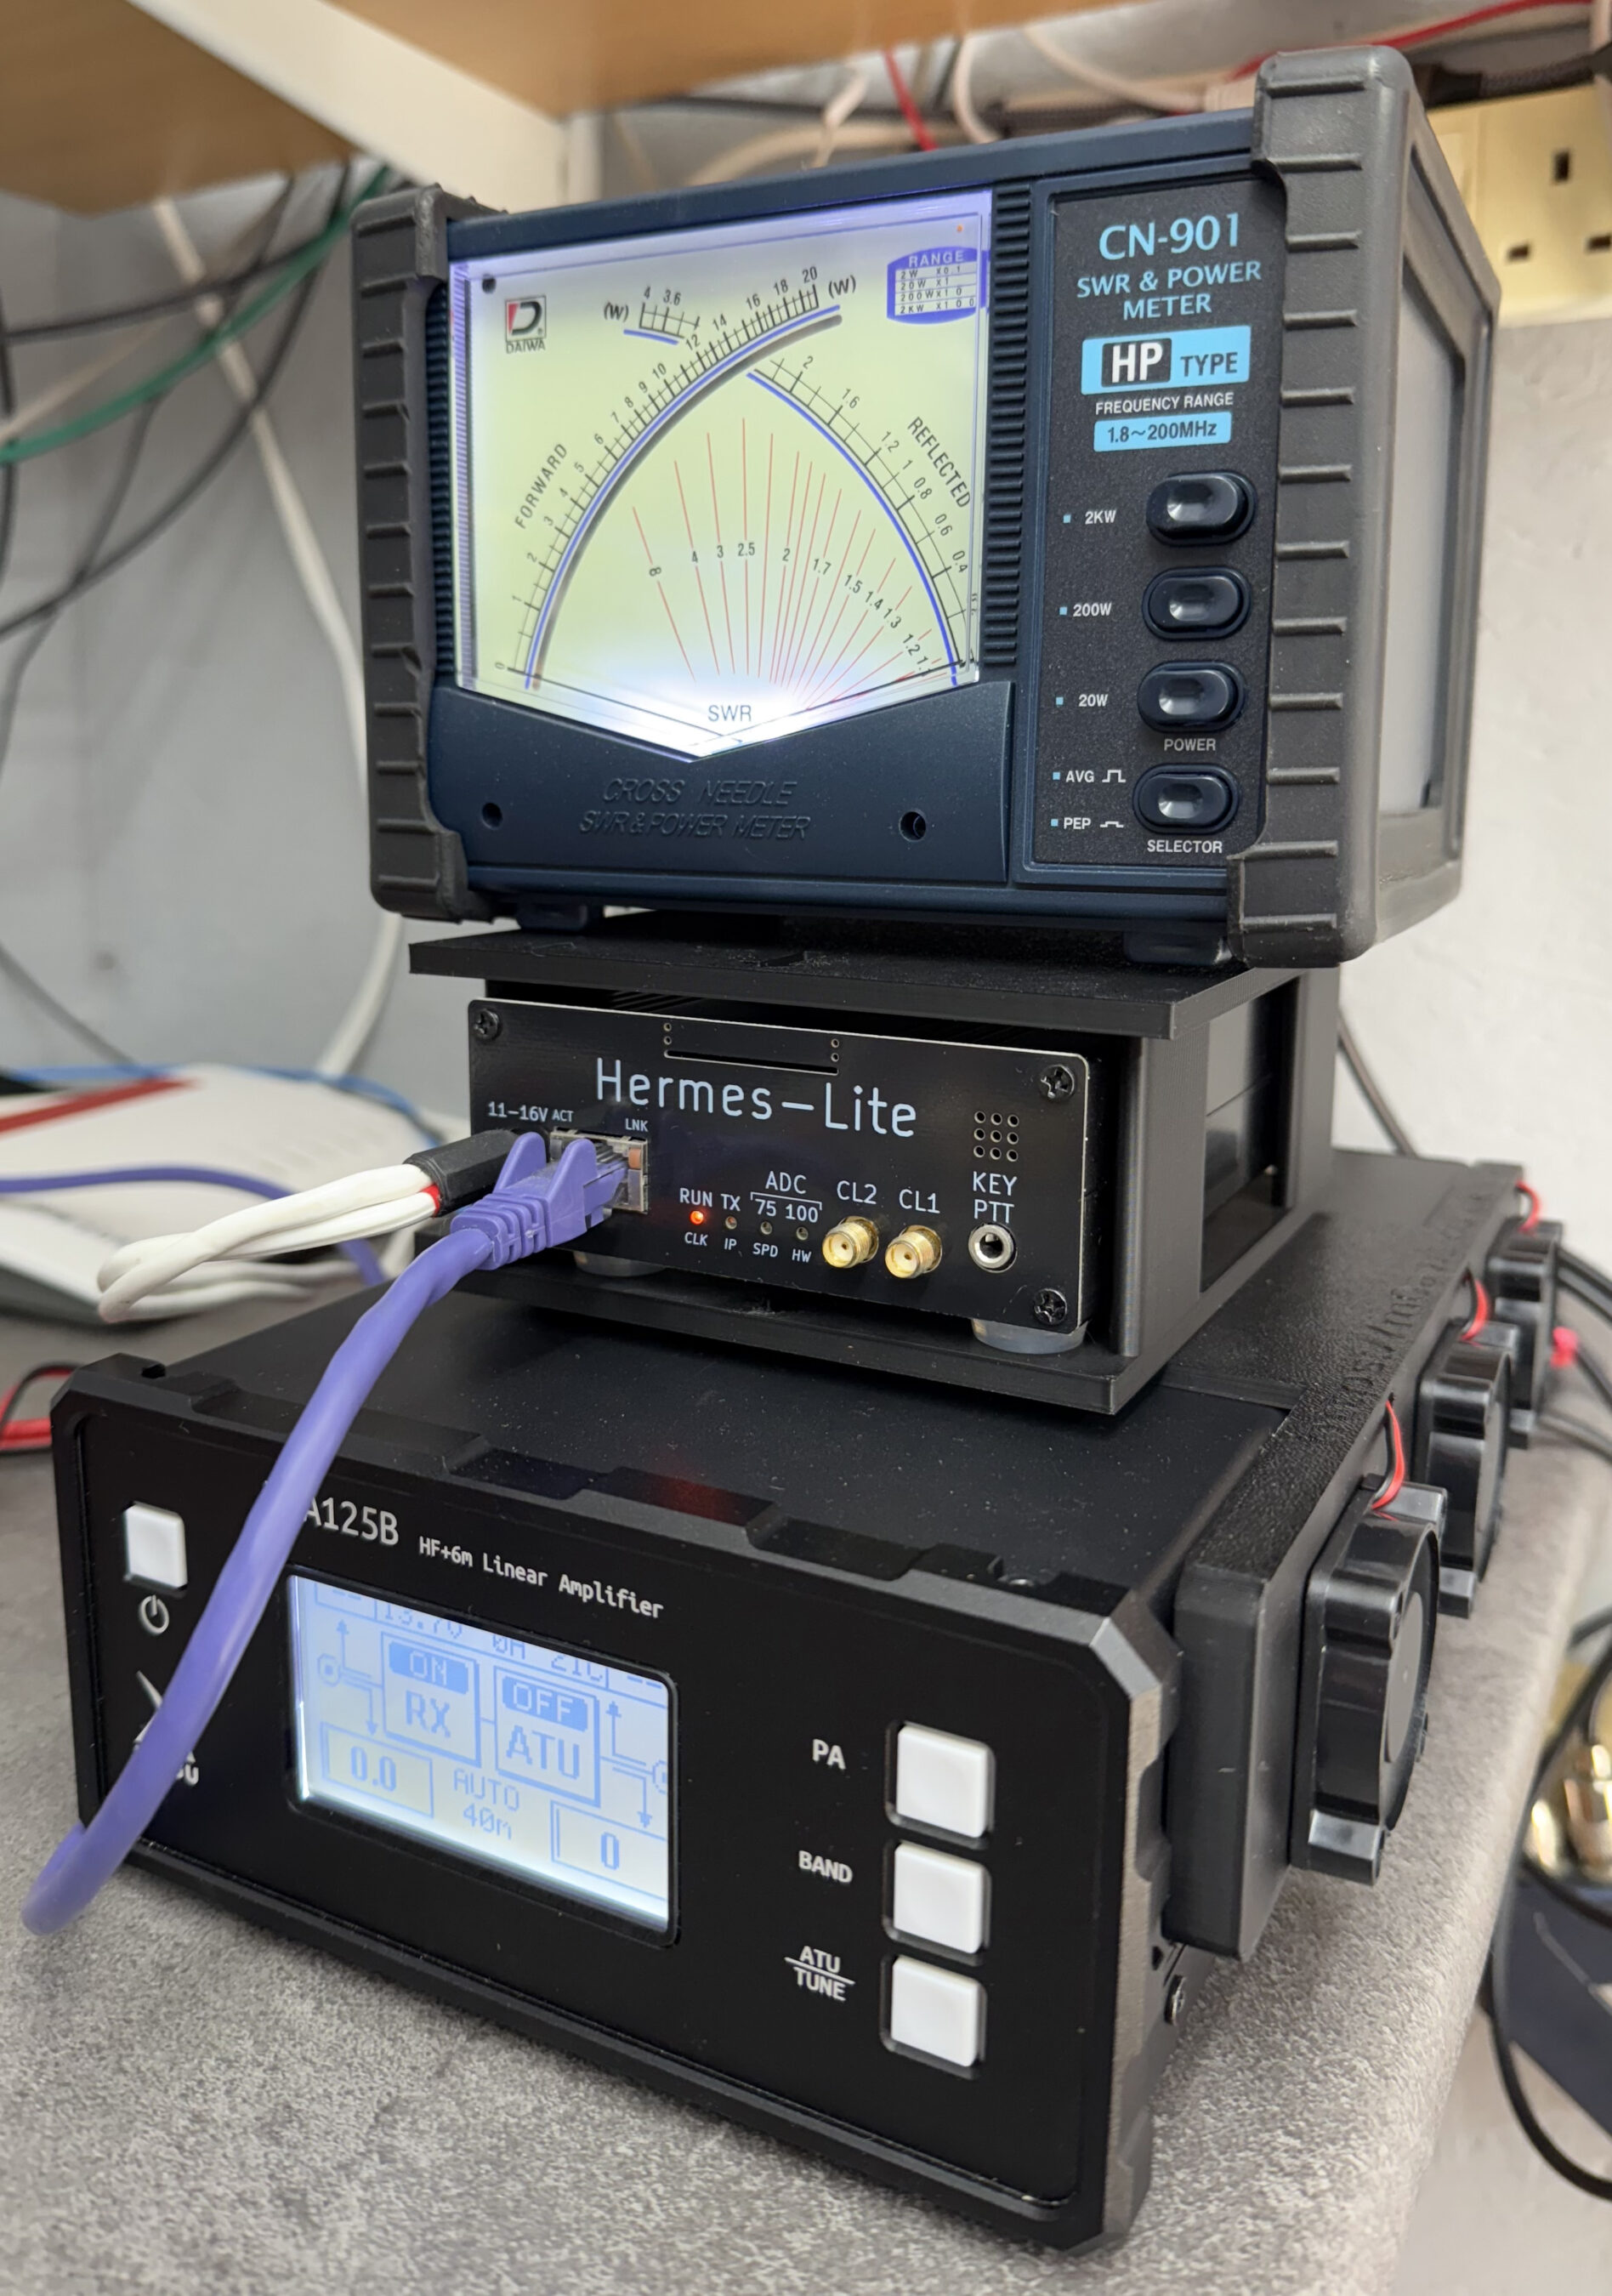
Once you’ve got your first design made you suddenly find yourself wanting to improve it and add things. In my case this was adding a Hermes Lite 2 holder to the top of the amp cooler and then a top shelf to hold my cross needle SWR and power meter.
Since then I’ve progressed massively with my designs and have even designed and printed things for other HAMs and family members, it’s totally addictive!
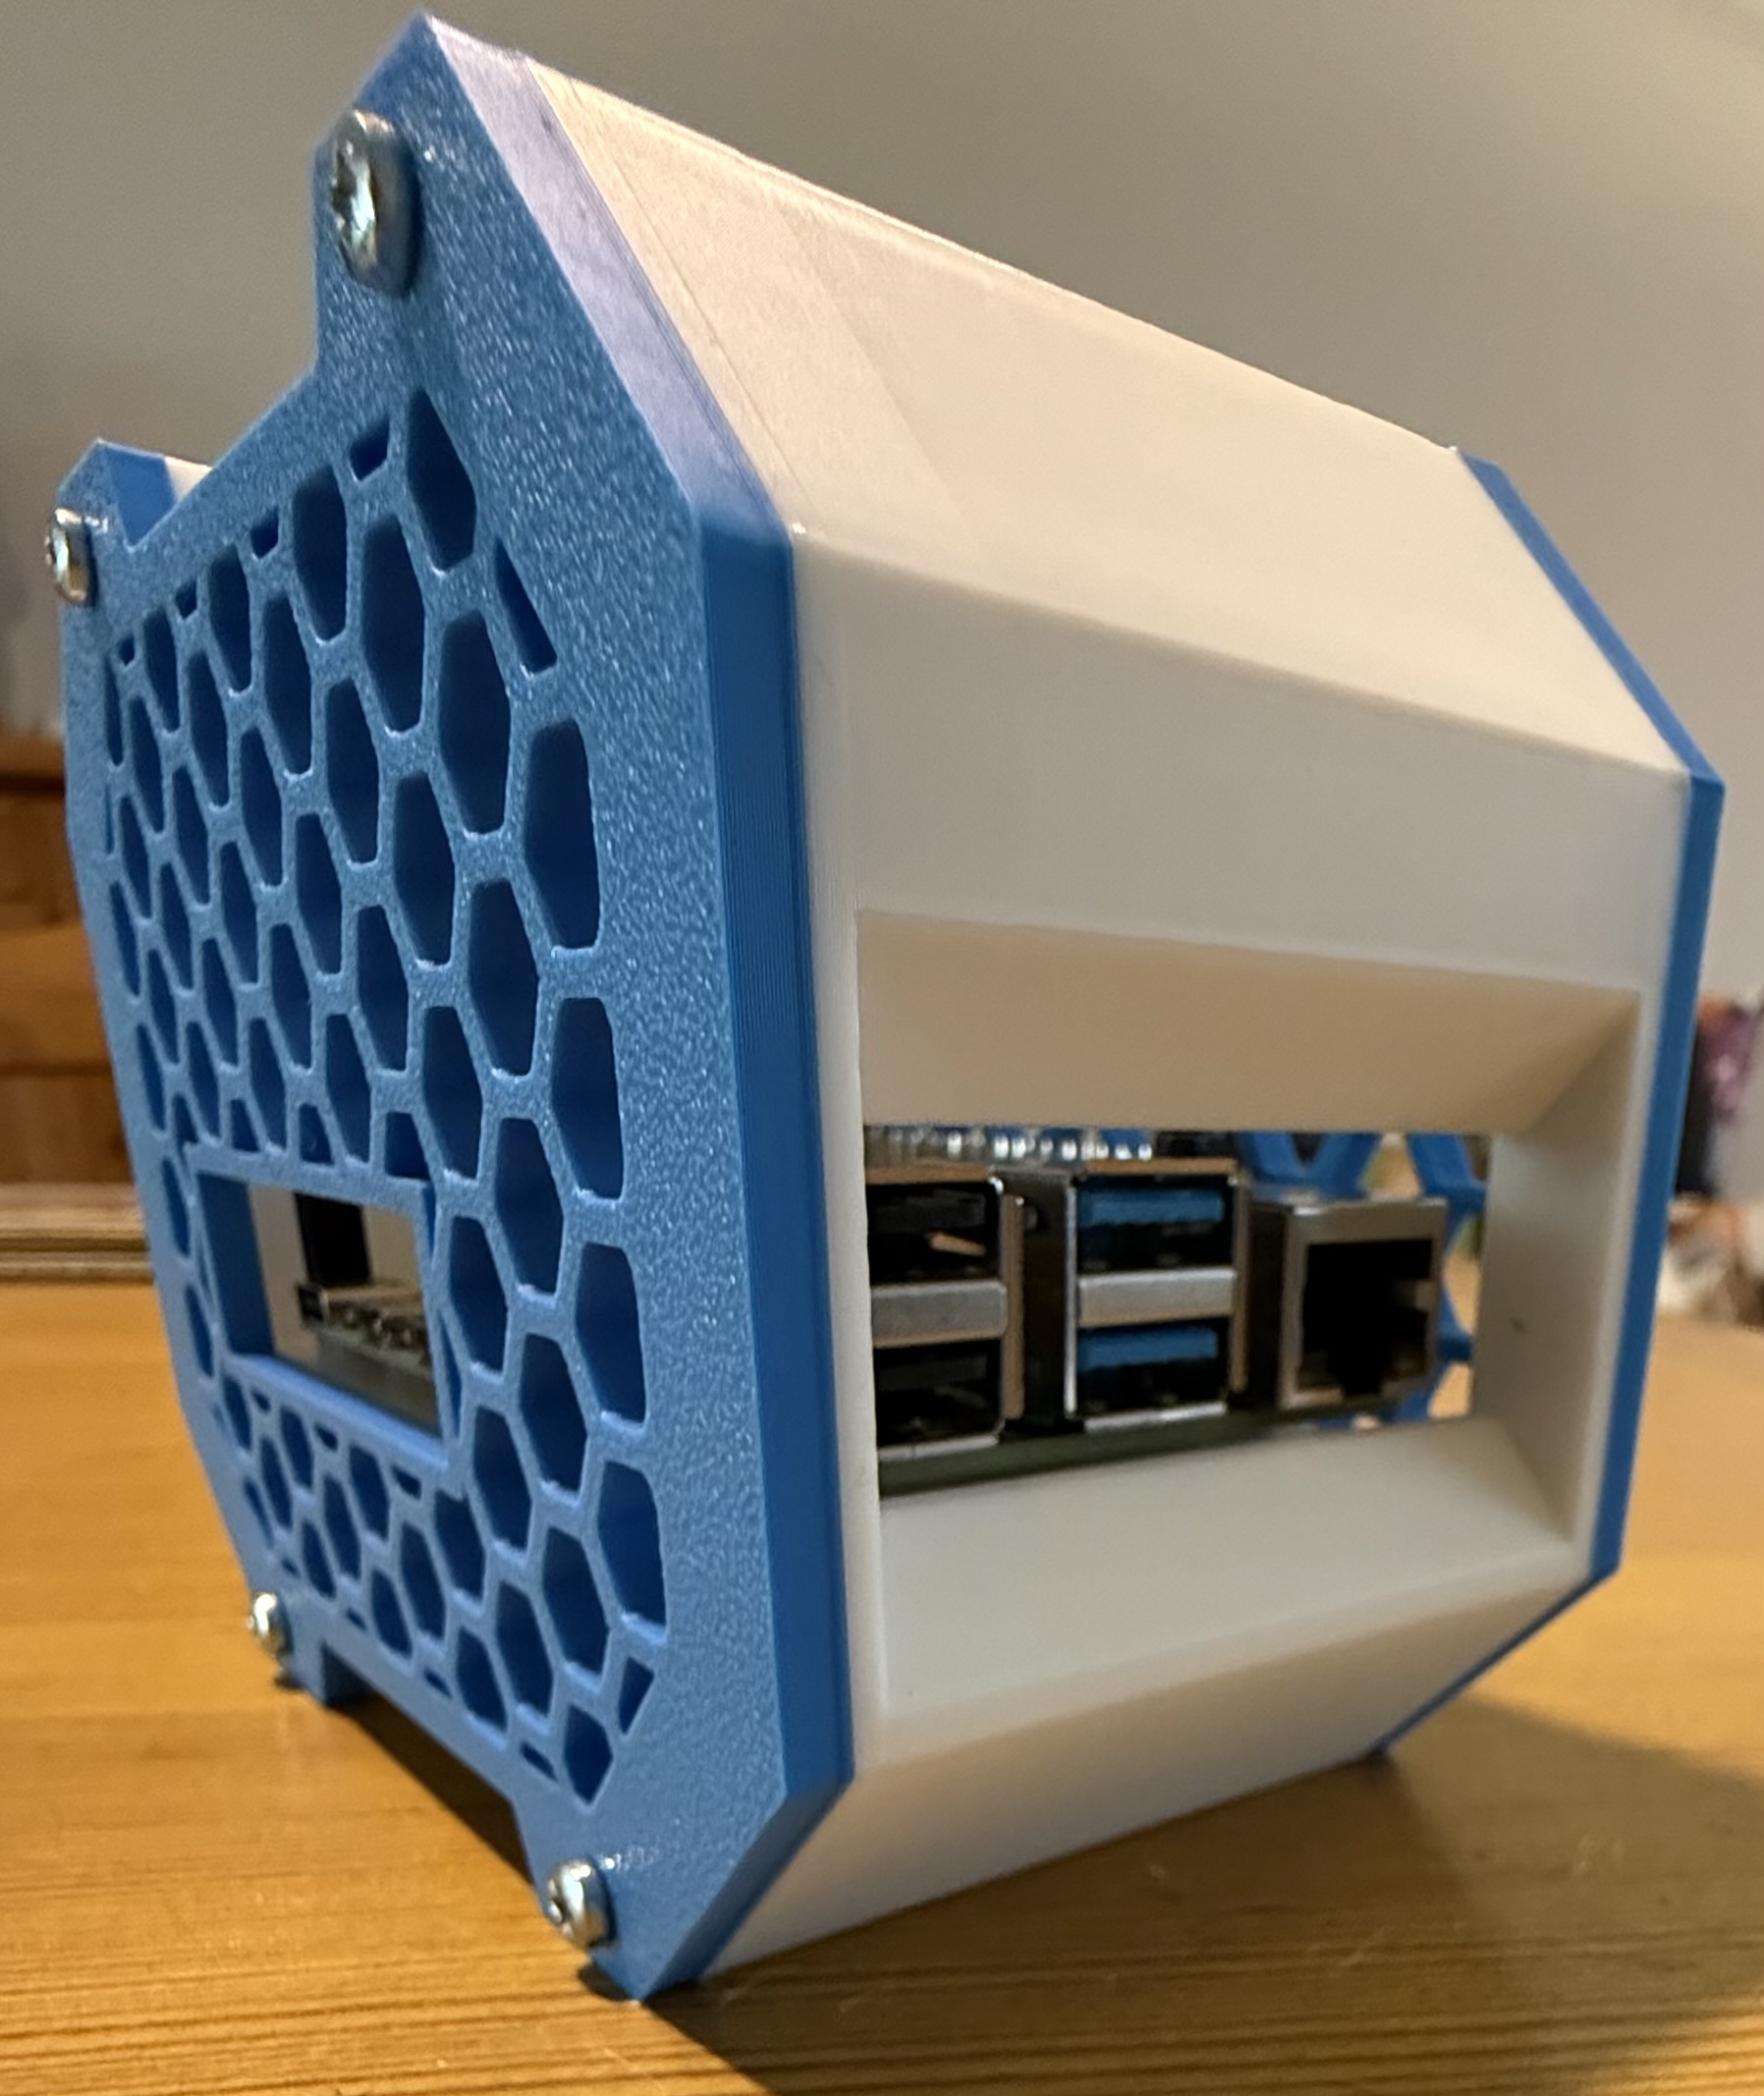
I can highly recommend the Bambu Lab A1 Combo (As shown above). It’s a quality piece of equipment that has operated faultlessly since purchase. Right now it’s printing a case for my RaspberryPi 4, just one of the many projects I’ve used it for since becoming a happy owner.
RaspberryPi 4 case from printables.com
Go on, release your inner creativity and treat yourself to a 3D printer, you won’t regret it and it’ll help you bring to life all of those radio projects you’ve dreamt of doing but, never got round to starting.
3: An AllStarLink Node
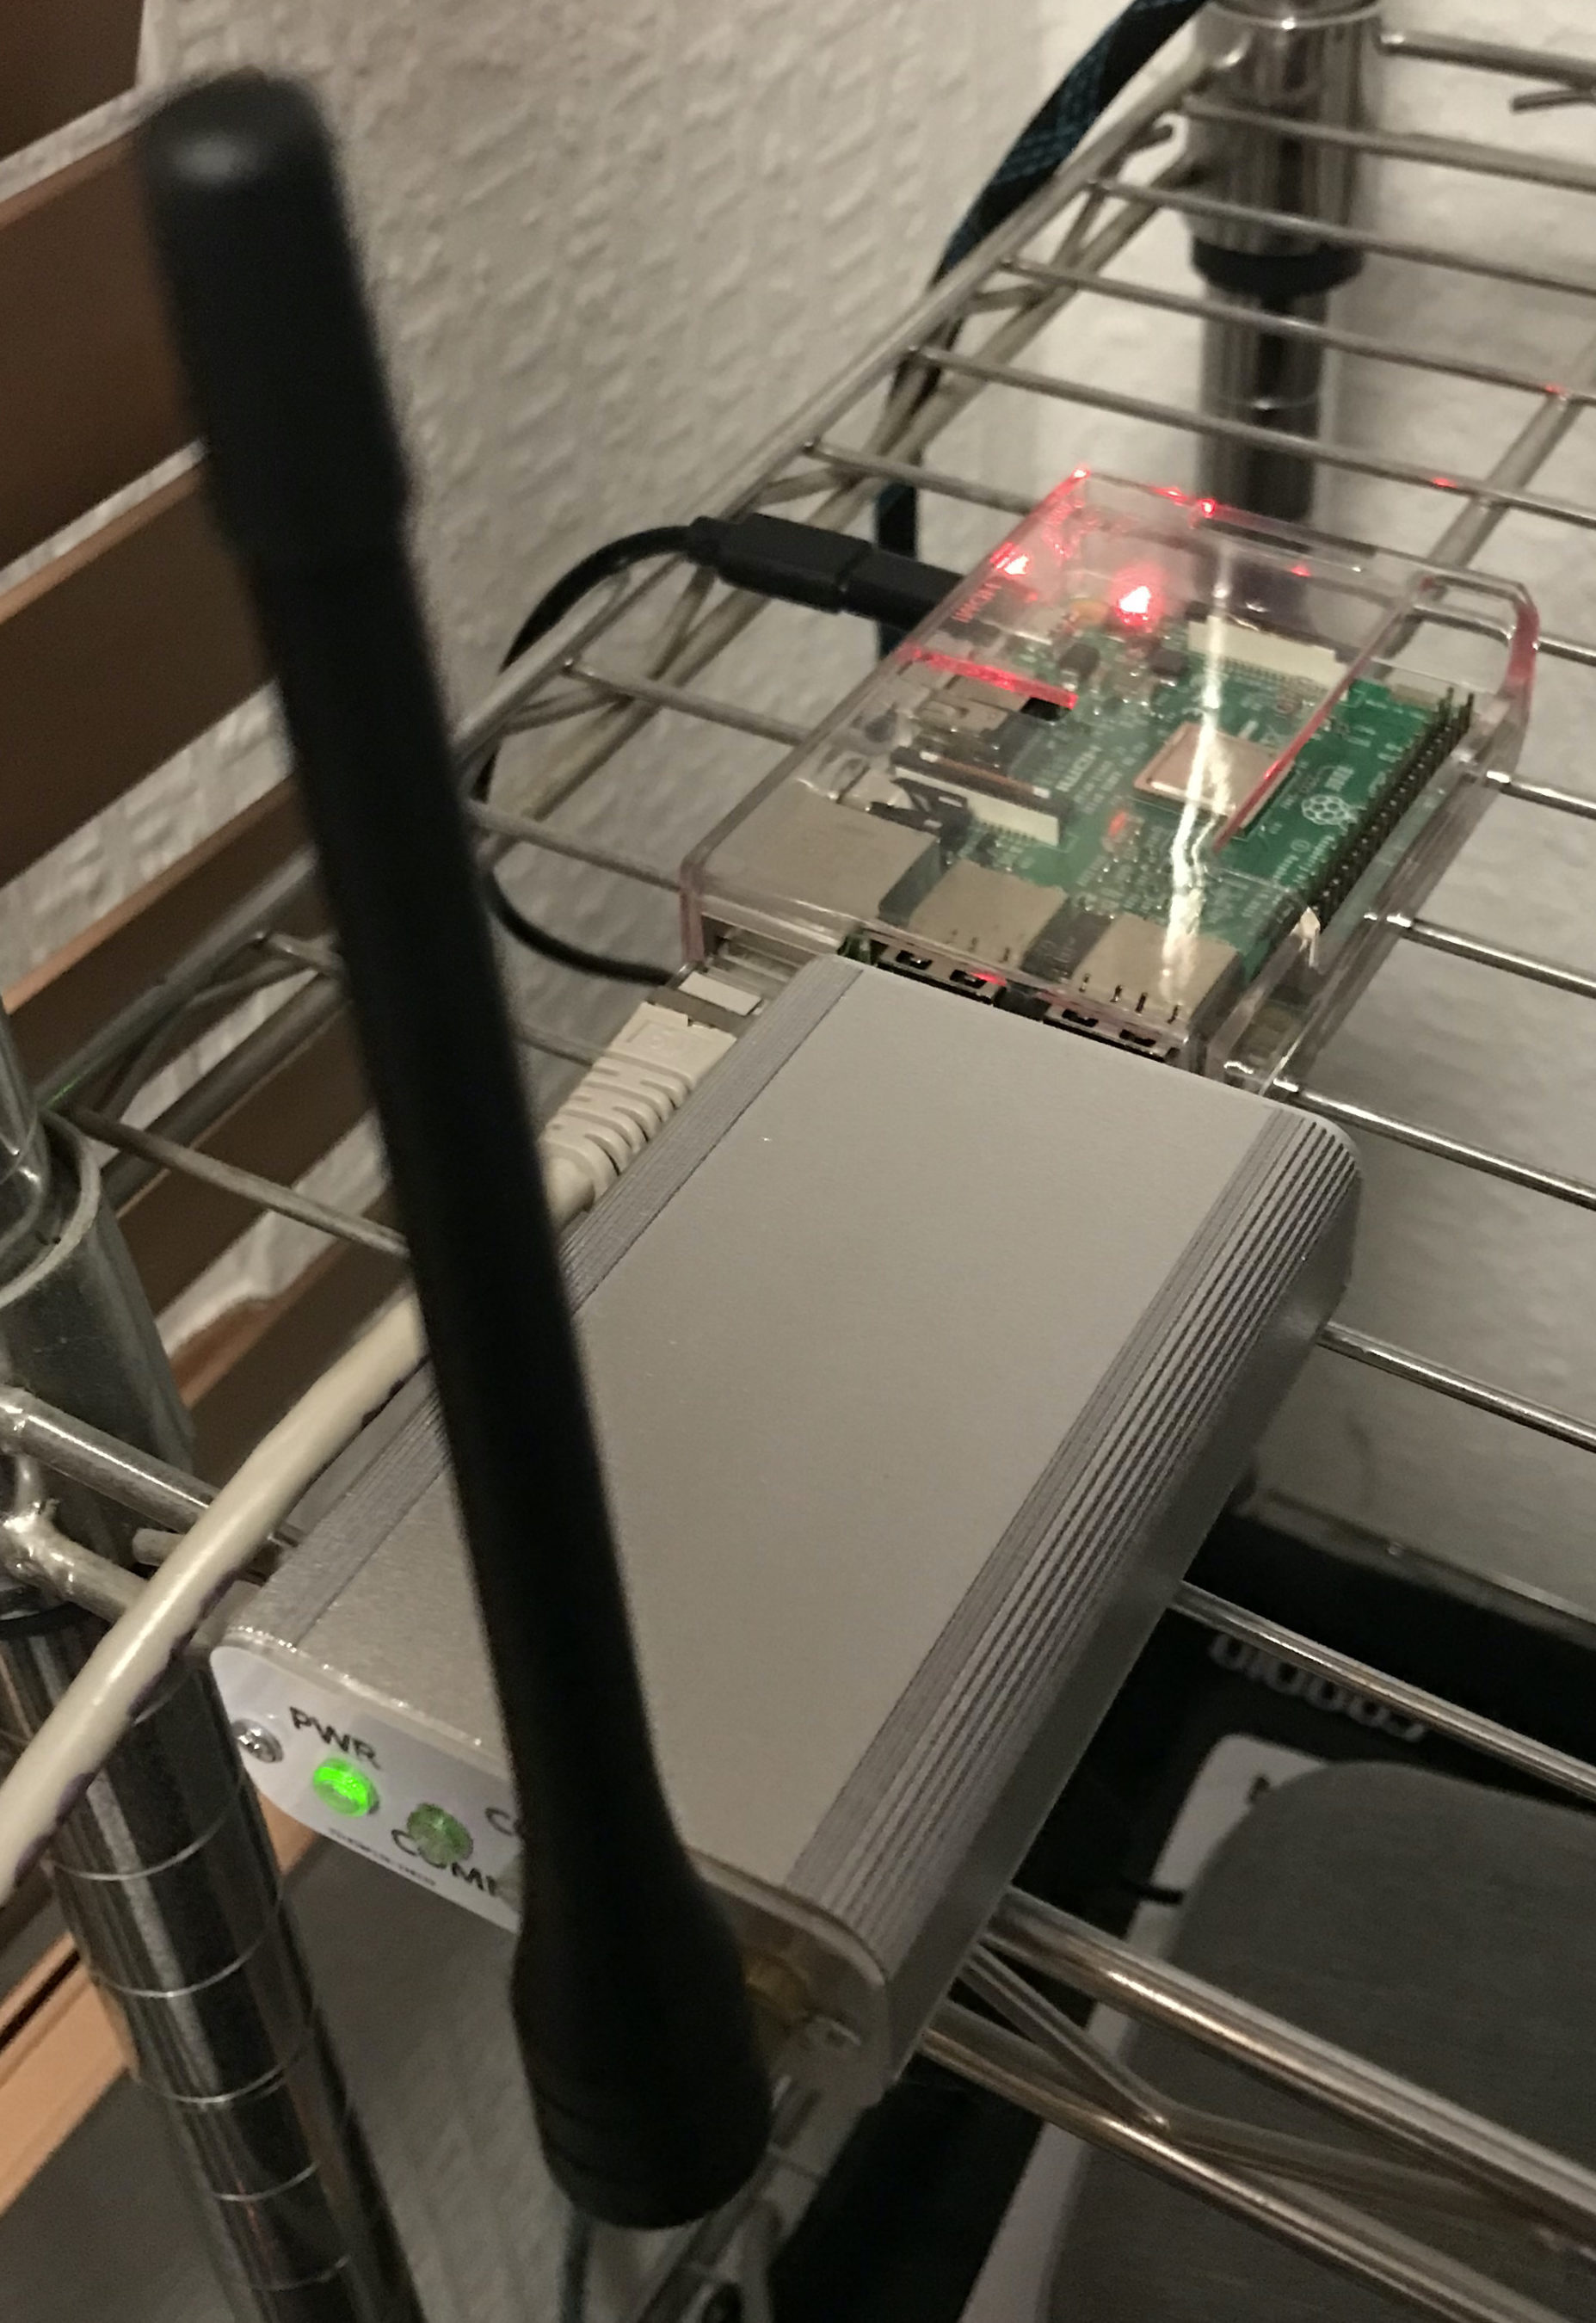
M0AW AllStarLink Node 61928 sitting on the equipment rack
Many people say that using VOIP over the internet isn’t real radio, I know because I used to be one of those people however, it has become an invaluable resource for keeping in touch with people all over the world.
Being part of an online HAM Radio Community it’s important that as a group we are able to talk to each other regardless of where we live, what bands we have access to and whether there is any propagation.
The AllStarLink (ASL) network gives global FM quality audio no matter where you are in the world. We use it daily for our breakfast net, general chatter throughout the day and even hold a weekly Matrix ASL Net on a Thursday evening.
Using our VHF/UHF handhelds (Real Radios!) and an easy to make AllStarLink Node we’re able to join in with the conversation regardless of propagation, licence type or distance, it really is great for bringing people together.
With devices like the SHARI and AIOC board now being readily available for minimal cost it really is very easy to get onto the AllStarLink network and talk to people even if you live in an antenna restricted location.
Why be alone when you can use the Matrix ASL node ( 642332 ) and join in the conversation.
4: Node-Red
M0AWS – Updated NodeRed QO-100 Dashboard with PTT button
Node-Red is a low-code programming tool for event-driven applications.
Node-RED’s goal is to enable anyone to build applications that collect, transform and visualise their data; building flows that can automate their world. Its low-code nature makes it accessible to users of any background, whether for home automation, industrial control systems or anything in between.
I’ve been using Node-Red for a number of years now and have developed a suite of web app’s that control and monitor just about every aspect of my Amateur Radio hobby and IT infrastructure.
Node-Red forms an integral part of my QO-100 Satellite Ground Station providing control of both the uplink and down link radios whilst synchronising the VFO’s, controlling filter selection and more, all from one simple to use interface using nothing more than a web browser.
It doesn’t stop there, my AllStarLink (ASL) nodes are also managed through a user friendly Node-Red Dashboard that removes all the need for technical know how and makes ASL node management as simple as clicking on a button to connect or disconnect to the many global networks.
Much of this functionality is achieved without writing a single line of code. If you can use a mouse, drag and drop objects on the screen you can develop Node-Red web app’s, it really is that easy.
M0AWS Interactive Log Flow
It doesn’t end there, Node-Red is great for presenting data in easy to digest formats.
Whether it be HAM Radio Log data presented on an interactive world map or monitoring of your server, RaspberryPi, virtual machine or UPS using gauges and graphs, this can all be achieved easily with nothing more than a mouse. There’s no need to spend hours writing thousands of lines of code, just drag and drop a few nodes onto the screen and join them up. You’ll be amazed how easy it is.
I believe every Amateur Radio enthusiast should have Node-Red available in their radio shack. It’s easy to install on your RaspberryPi 4 or 5, Linux or Windows PC and Apple Mac with the same great functionality available on all platforms.
Once you’ve developed your first web app you’ll suddenly find a million more ideas will come into your head and before you know it, you’ll be where I am today with Node-Red at the centre of your radio hobby.
5: A Hermes Lite 2 HF SDR Transceiver
For years I used black box HF radios from the big 3 manufacturers along with the odd radio from the smaller enterprises like TenTec but, they all had their foibles and there was often nothing I could do about it.
My last acquisition from the big 3 was a Yaesu FTDX10, a competent hybrid SDR radio with a good receiver however, the menu system is terrible, the button layout not much better and the user experience not as good as it could be. Of course the software is closed source so there is nothing you can do about it. The radio did its job but, it wasn’t fun to use, it wasn’t what I really wanted and it didn’t put a smile on my face.
I looked at moving to software defined radios (SDR) but, with prices in the many thousands of pounds bracket and the software being closed source I came to the conclusion that they wouldn’t give me what I really wanted either.
So what was it that I was searching for?
Thinking long and hard about it I came to the conclusion that what I really wanted was a radio that gave me the same satisfaction that OpenSource software has given me for decades, namely an HF radio that I have complete control over, from the hardware through to the software and everything in between.
I wanted something that I could tailor to my exact needs. Something that was built using open hardware and open software, something where if I wasn’t happy with it I could change it, improve it and do the things I wanted with it.
At this point my search for the ideal radio headed in a completely different direction.
Xiegu XPA125b Cooler with Hermes Lite 2 cradle – front view
The Hermes Lite 2 SDR HF Transceiver (HL2) has been around for a number of years. I was first introduced to it by Michael, DK1MI and then Roger, G8VLR via the Matrix. Both Michael and Roger use the HL2 on a regular basis and have often waxed lyrical about how good it is.
Being designed by radio amateurs for radio amateurs it’s based on an open architecture from the ground up. Being an OpenSource junky this really appealed to me and as I looked deeper into it from both a hardware and software point of view I soon realised that it had the potential to be exactly what I was looking for.
It wasn’t long before I found myself on the Makerfabs website placing an order for the HL2 mainboard, filter board, I/O board and case. A couple of weeks later it arrived and I dived head first into the SDR rabbit hole.
2 years later and the HL2 has become my main HF radio in the shack. Partnered with a Xiegu XPA125B amplifier and PiHPSDR software running on my Kubuntu Linux PC it is everything I have been looking for in an HF radio.
I’ve made modifications to the software to suit my operating style and needs with the user interface being exactly how I want it, no unnecessary buttons or knobs, just the controls that I use on a daily basis cleanly placed in a logical, easy to use layout, the way I want it.
My understanding of software defined radio and how it works has improved a hundred fold. Having access to the software and being able to go through the code and understand the architecture has been an interesting journey and one that has enhanced my radio enjoyment considerably. I now have a smile on my face every time I go on air.
Do I miss the FTDX10?
No, not in the slightest!
So, those are the 5 things that I feel have revolutionised my radio amateur hobby and made it a more enjoyable experience. I’m sure over time I will add to this list as I venture down future rabbit holes in our wonderful radio hobby.
Living in a rural area we have a very unreliable mains power supply and so I have to protect all the IT equipment in my home lab with an uninterruptible power supply (UPS).
Over the years I’ve found APC UPSs to be super reliable and use them extensively around the house to keep important services running during power outages.
Running a combination of Debian and Ubuntu operating systems on my servers and virtual machines (VMs) I’ve always used the apcupsd daemon to interface with the UPS for automated shutdowns etc.
The apcupsd daemon does have a very simple web interface that can display 3 items of information at a time but, I decided it would be nice to have a view showing all the information on one dashboard.
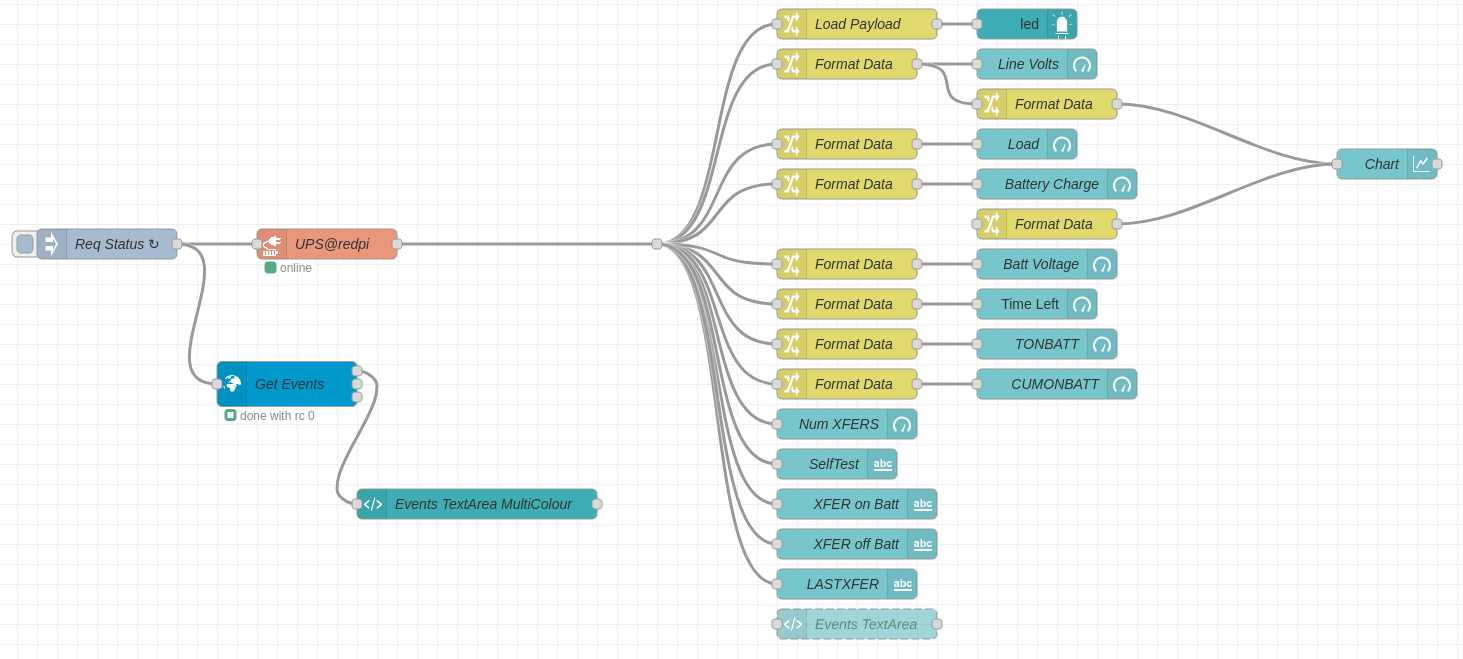
Node-Red APC UPS Flow
The Node-Red flow is pretty simple and is based around the apcrequest node that connects directly to the apcupsd service on port 3551.
Note: You must configure the apcupsd service as a NIS server in the /etc/apcupsd/apcupsd.conf config file.
Most of the info is collected via the apcrequest node however, I found that getting the events information via the node to be unreliable and so I used a BigSSH node to connect to the computer to get the UPS events information directly from the log file.
The simple flow collects the data, formats it into a useable format and then passes the data on to the dashboard GUI objects for display, it really is very simple.
Node-Red APC UPS Dashboard
The resultant dashboard clearly displays all the information needed including line voltage over time. I was surprised to see such a swing in the incoming voltage but, now understand why I get so many low line voltage and over voltage events on the UPS.
The events log is displayed in a scrolling text area on the dashboard with colour highlighting.
If you’d like to create a dashboard for your APC UPS then the flow can be downloaded below.
Following on from my previous article on using Node-Red to build interactive log maps I’ve now reworked the flow to make it more efficient with less Javascript.
The original flow had a function that handled the issue of FT4 contacts being recorded in two different ways depending on which app you use for your FT4/8 operations.
<mode:4>MFSK <submode:3>FT4
or
<mode:8>MFSK FT4
The code I wrote to handle this wasn’t particularly elegant and so I decided to remove the code entirely and just use a simple change node.
M0AWS New node to handle FT4 more efficiently
This is the great thing about Node-Red, there’s always more than one way to do something.
With this fix in place and the old code stripped out of the format generic payload function, the new flow is much tidier and easier to comprehend.
M0AWs Updated ADI Log Map flow
With testing complete and the two maps now live on my website the flow is finally ready for release into the wild.
If you fancy presenting your ADIF logs in a more visual, interactive format then just download the flow below and import it into your Node-Red flow editor.
Don’t forget that you will need to change the path to the log files in the file read nodes to suit your setup and change the location data in the My QTH trigger to match your callsign and location. Other than this the flow should just work.
I’ve not been on the radio much over the last few weeks as I’ve had my head down other radio related rabbit holes.
One of the rabbit holes is a Node-Red project to make my online logs a little more interactive. For sometime now my logs have been displayed on my website as nicely formatted, searchable HTML pages however, they don’t really allow the viewer (myself included) to see the global coverage of all the contacts so, I decided to write a Node-Red flow that would do just that.
M0AWS Interactive Log Flow
The flow itself isn’t too complicated and basically consists of reading in the individual ADIF formatted log files, processing the data and then sending the data in the correct format to the map node for display.
I’ve had to write a few functions to handle the processing of the ADIF formatted data but, these aren’t particularly complex and are fairly easy to understand even if like me, you’re not a Javascript programmer.
The flow is working perfectly however, I’m in the process of reworking the format generic payload function to reduce the amount of code and make it more efficient.
M0AWS SSB / CW / FreeDV Interactive Log World Map
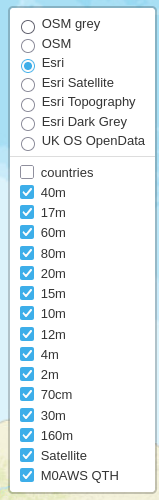
M0AWS Interactive Log Map Layers Menu
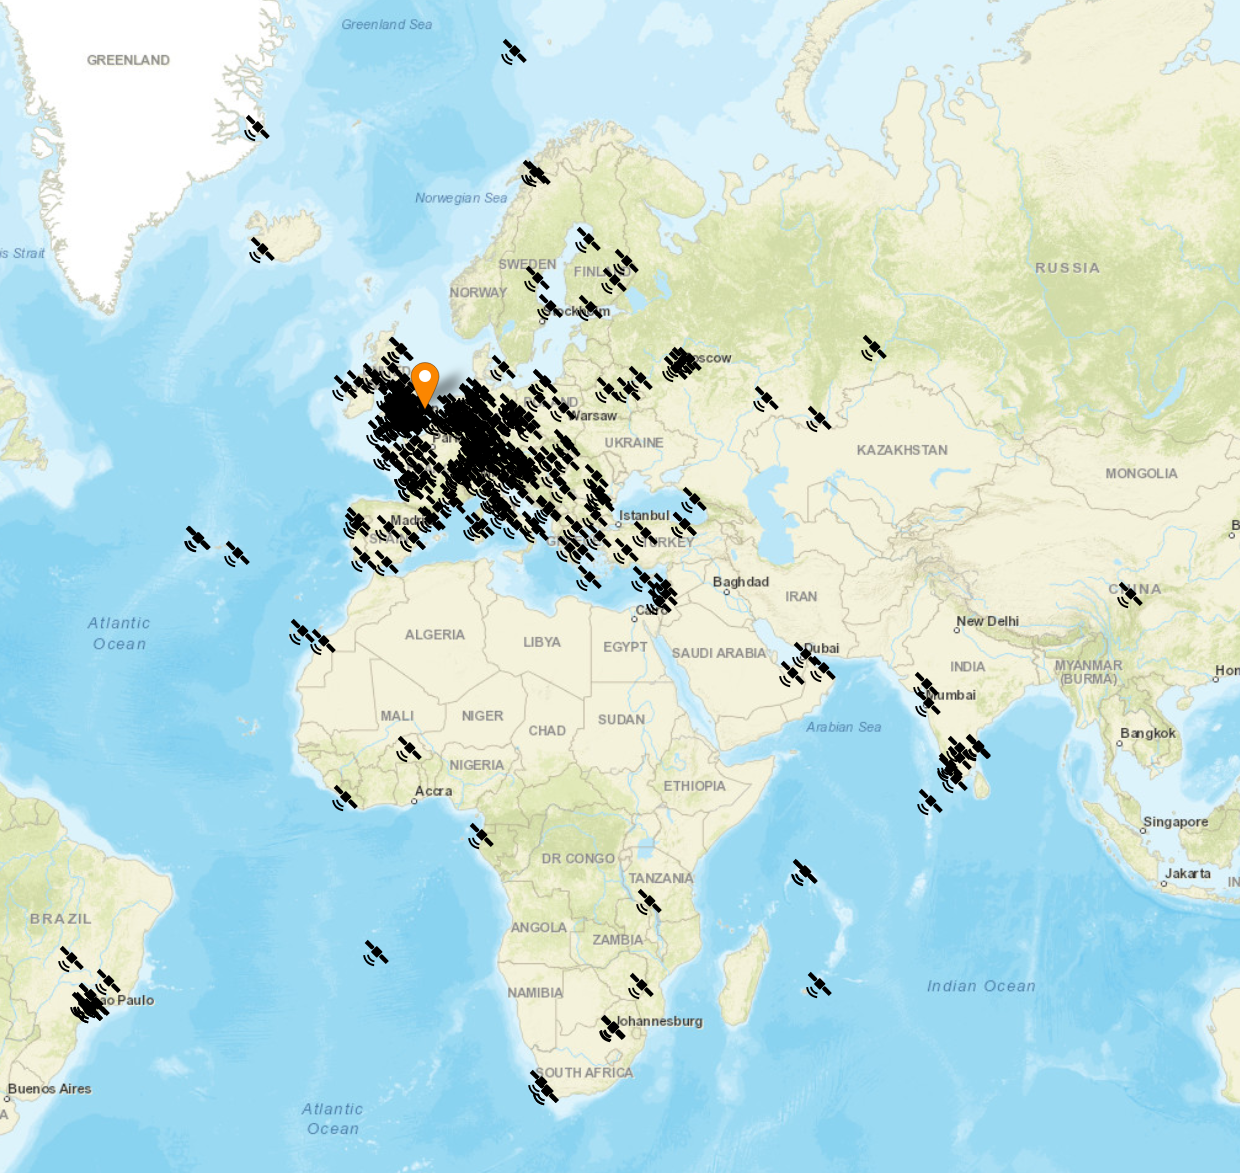
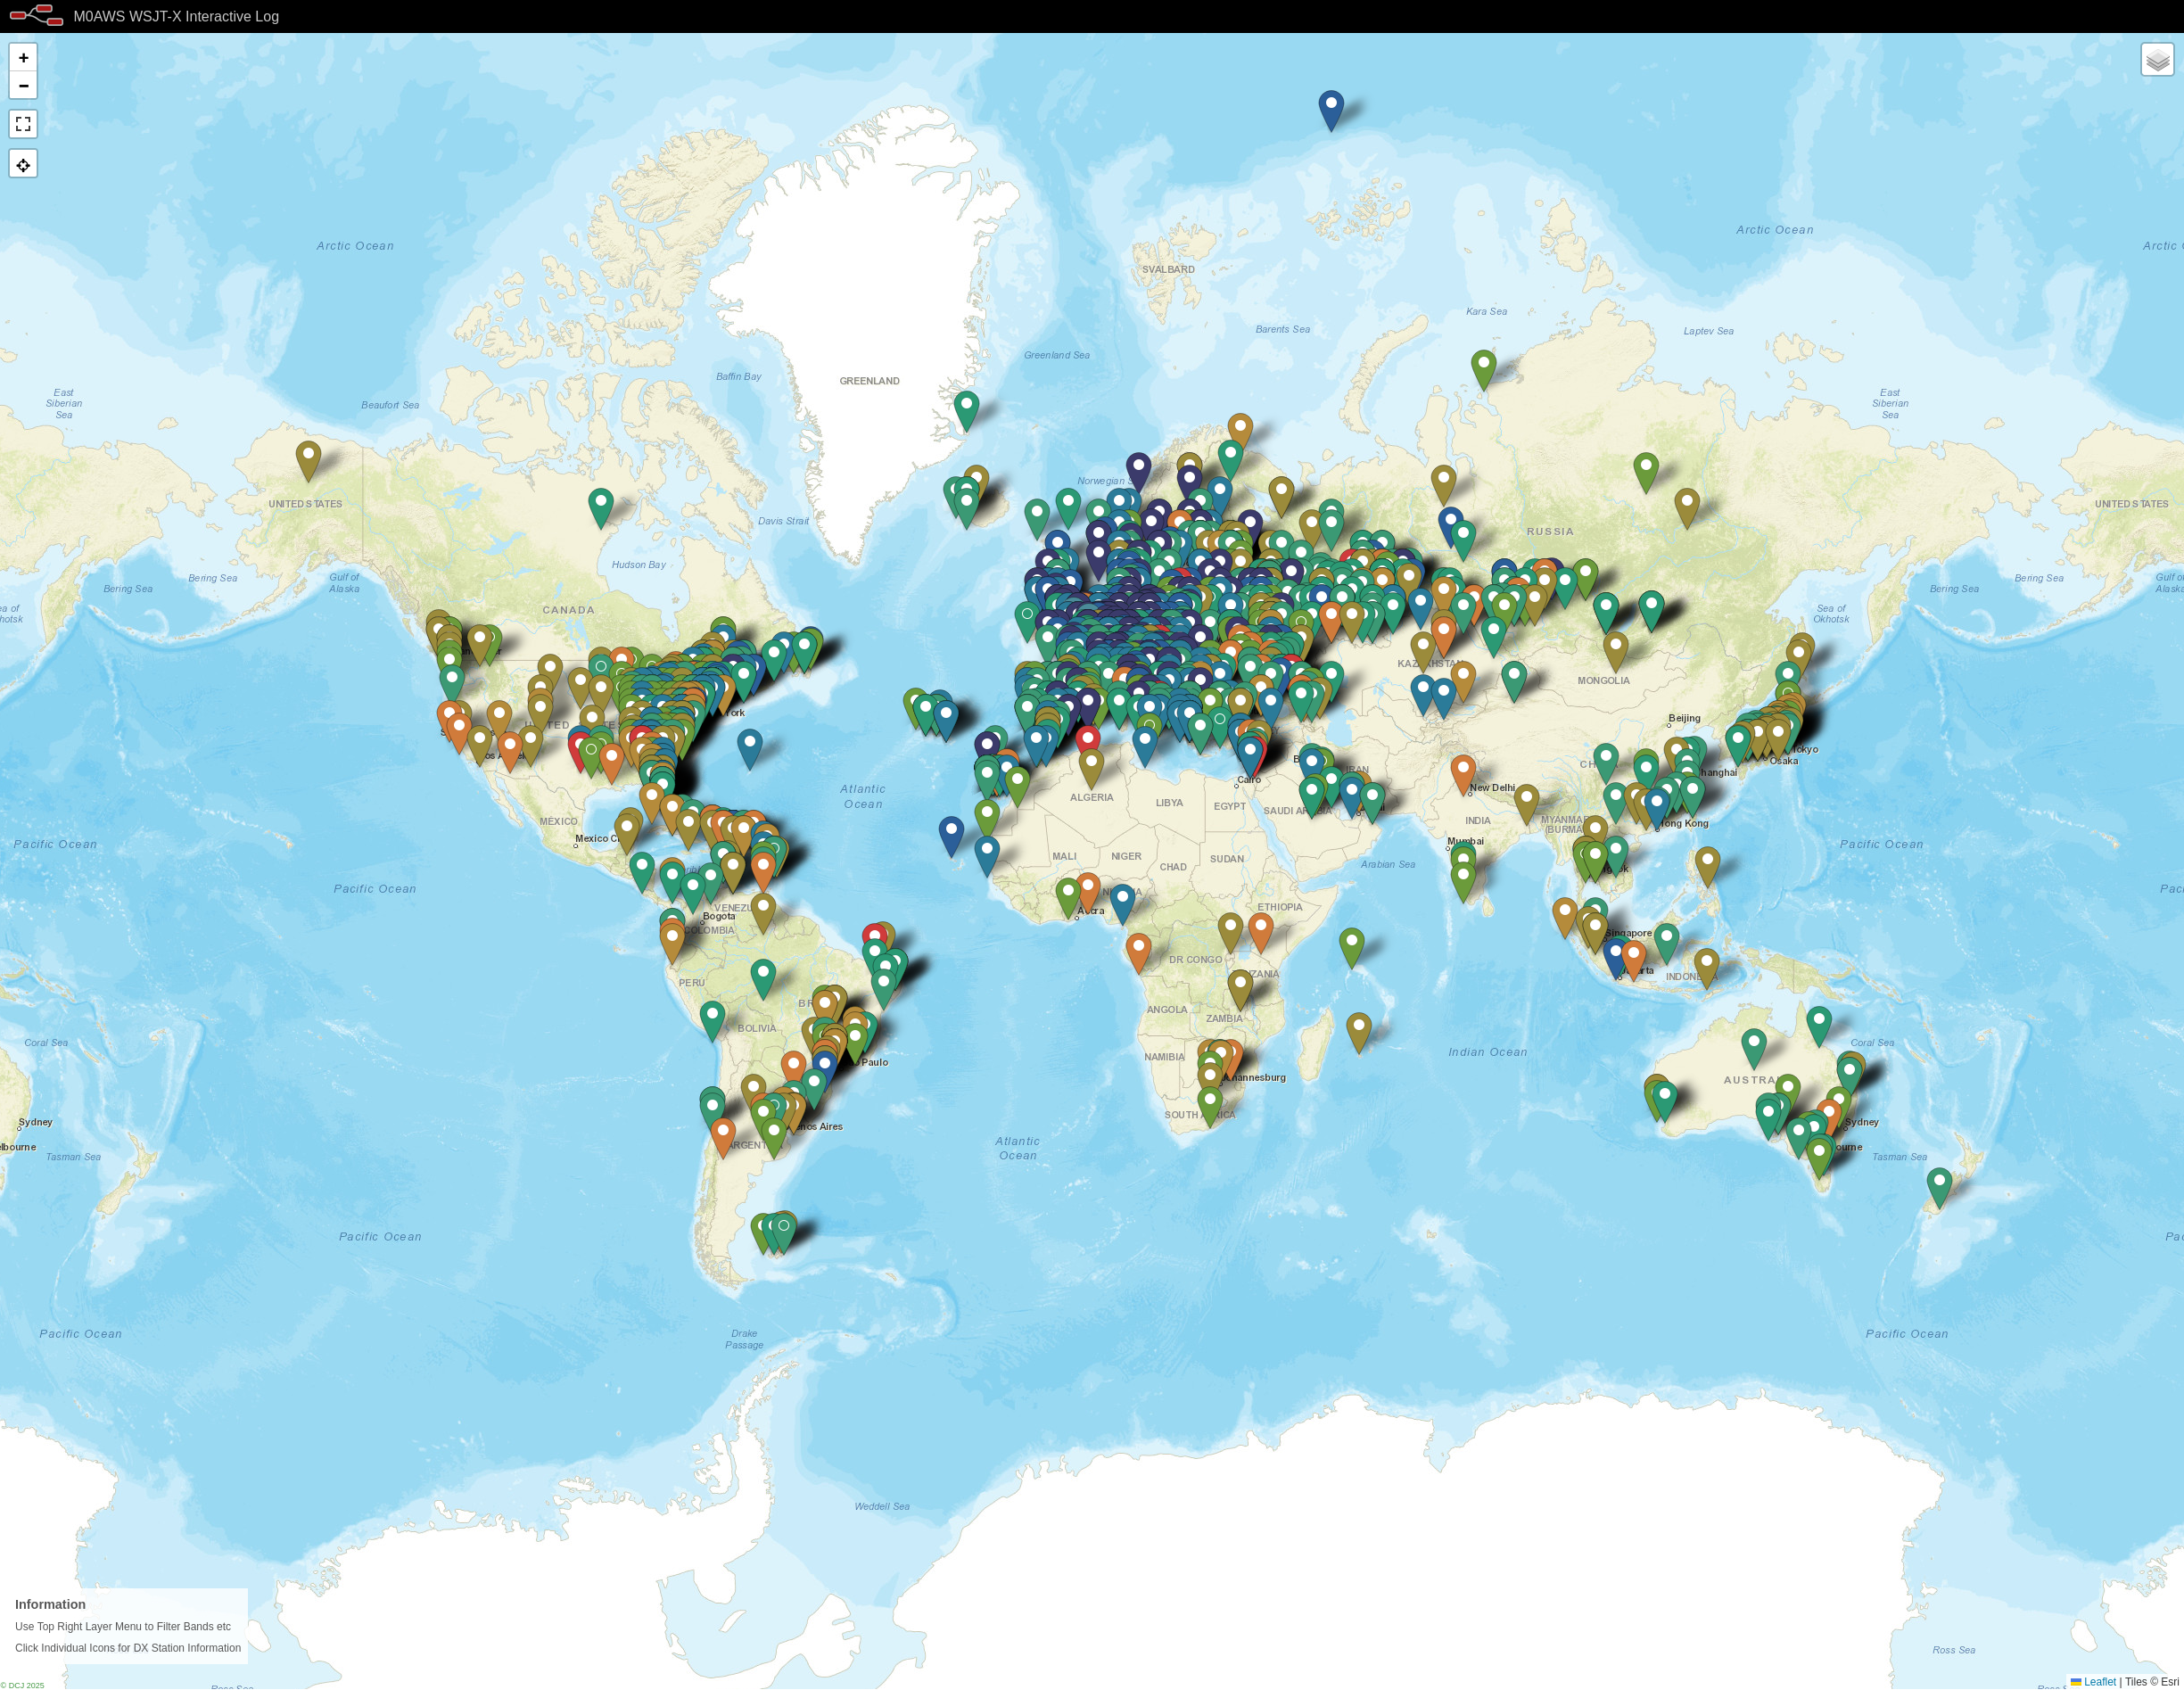
The flow generates two maps, one for voice / CW /Satellite contacts and the other for WSJT-X FT4/8 contacts. Every pin on the map is colour coded by band with satellite contacts being denoted by a satellite icon.
Each pin / icon on the map is clickable and reveals the data of the QSO being displayed.
In the top right-hand corner of the map there is a drop down layermenu that allows the viewer to filter by band thus reducing the number of icons on the screen at any one time.
Seeing the data presented on a map really brings my logs alive. An example of this is that I had no idea I’d worked so many stations in India on the QO-100 Satellite.
The small icons in the pins show a microphone for SSB/FM/FreeDV contacts and a downwards pointing triangle in a box for CW contacts. Sadly I couldn’t find a Morse key icon in the collection available.
M0AWS filtered view of QO-100 Satellite contacts
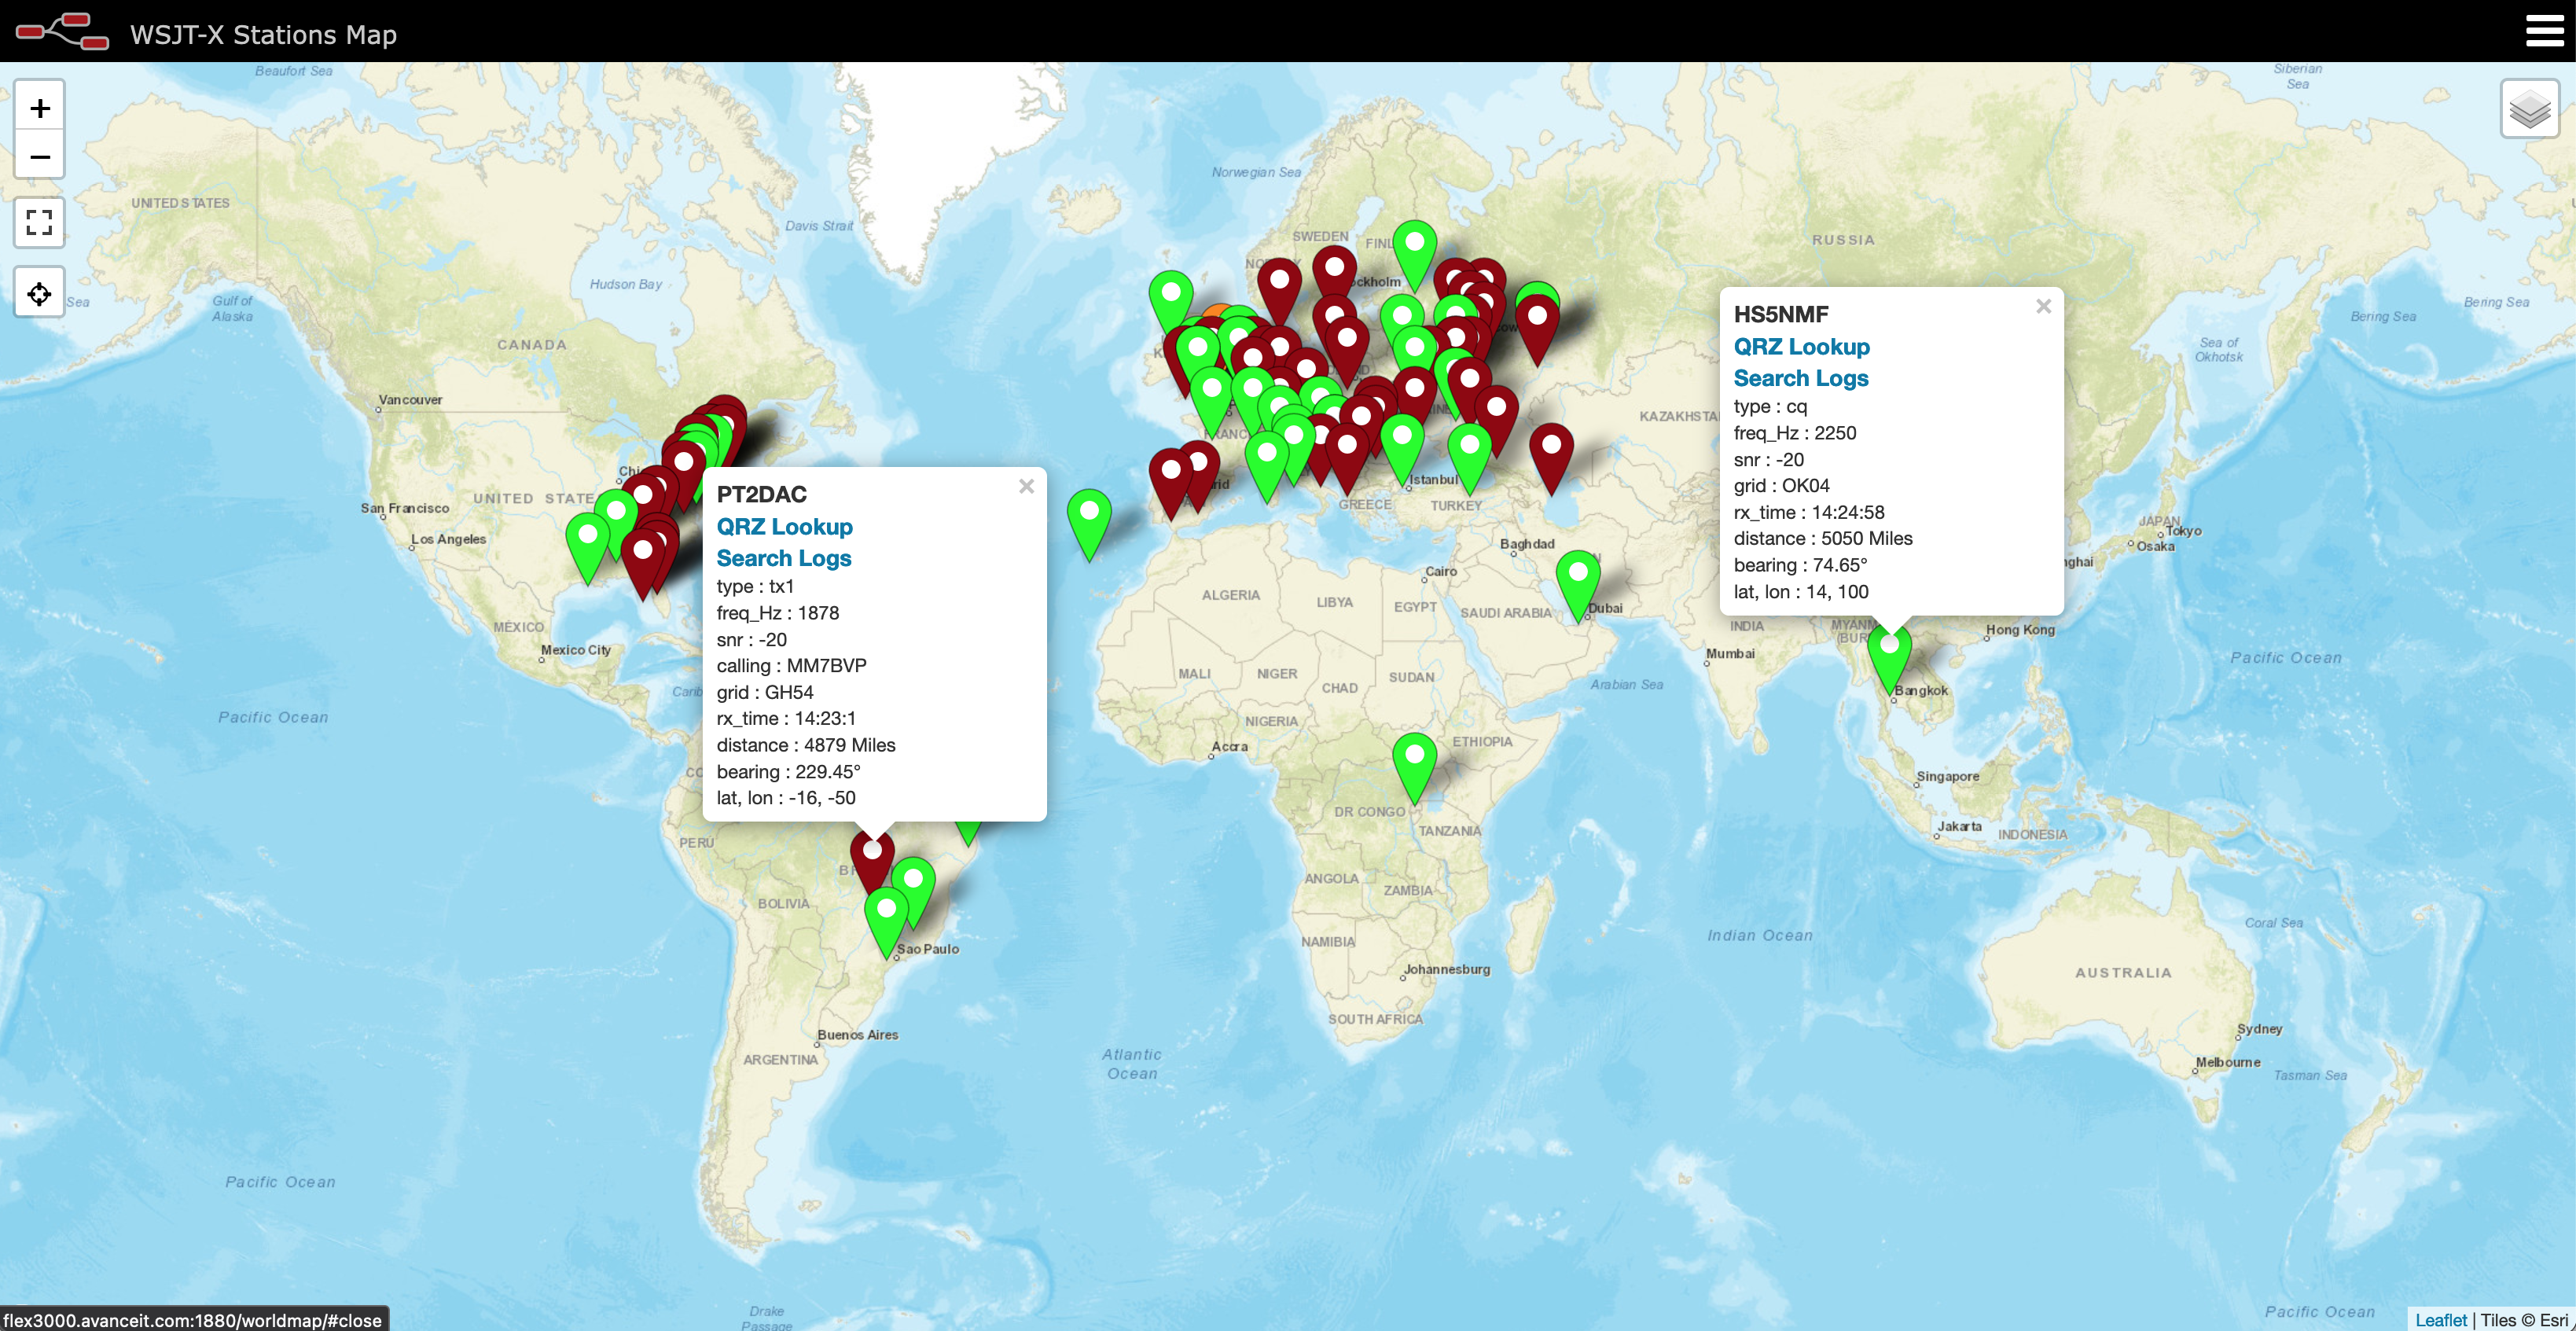
I only use FT4/8 for testing new antenna designs however, it’s interesting to see the global coverage accomplished with this weak signal mode.
M0AWS WSJT-X FT4/8 Interactive Log World Map
Once I’ve finished rewriting the format generic payload function I will make the flow available for download here so that others can also create an interactive view of their radio logs.
If you want to have a look at the maps and try them out for yourself, they are available under the Logs menu above.
This Node-Red instance is running in a virtual machine (VM) on a 16GB RAM RaspberryPi 5 that is also running a number of other VMs at the same time so, it’s safe to say it’s not heavy on CPU and will run on the older Pi4 as well.
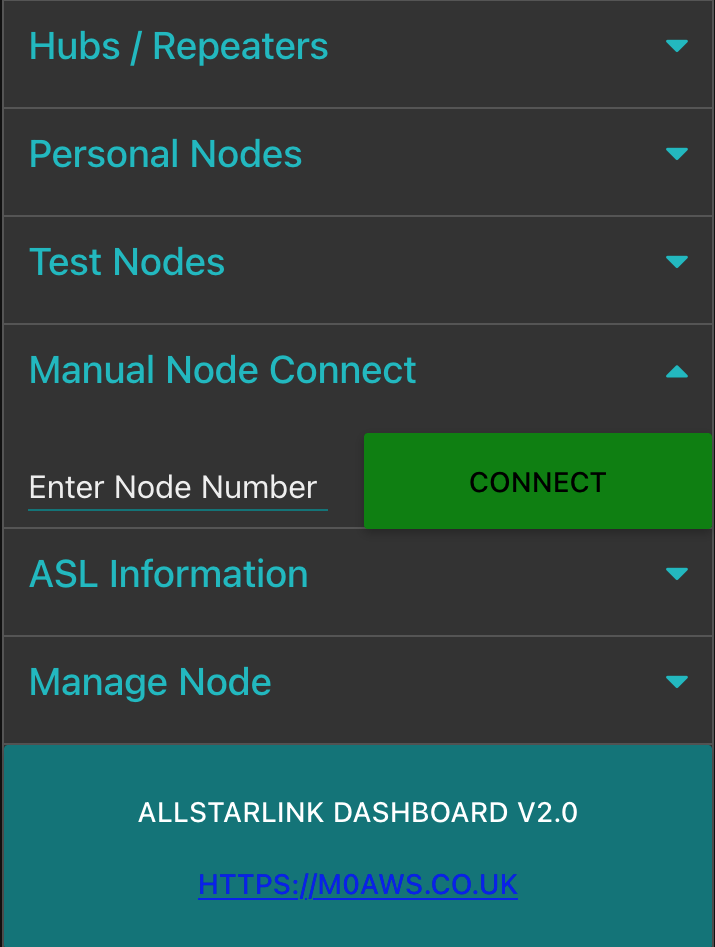
v2.0 comes with a bunch of new functionality that I think many will find useful. I’ve added a Manual Node Connect section that provides the functionality to enter a node number and connect to it, something I wanted to have from the outset but, saved for the second release.
M0AWS AllStarLink Control Dashboard v2.0 Manual Node Connect View
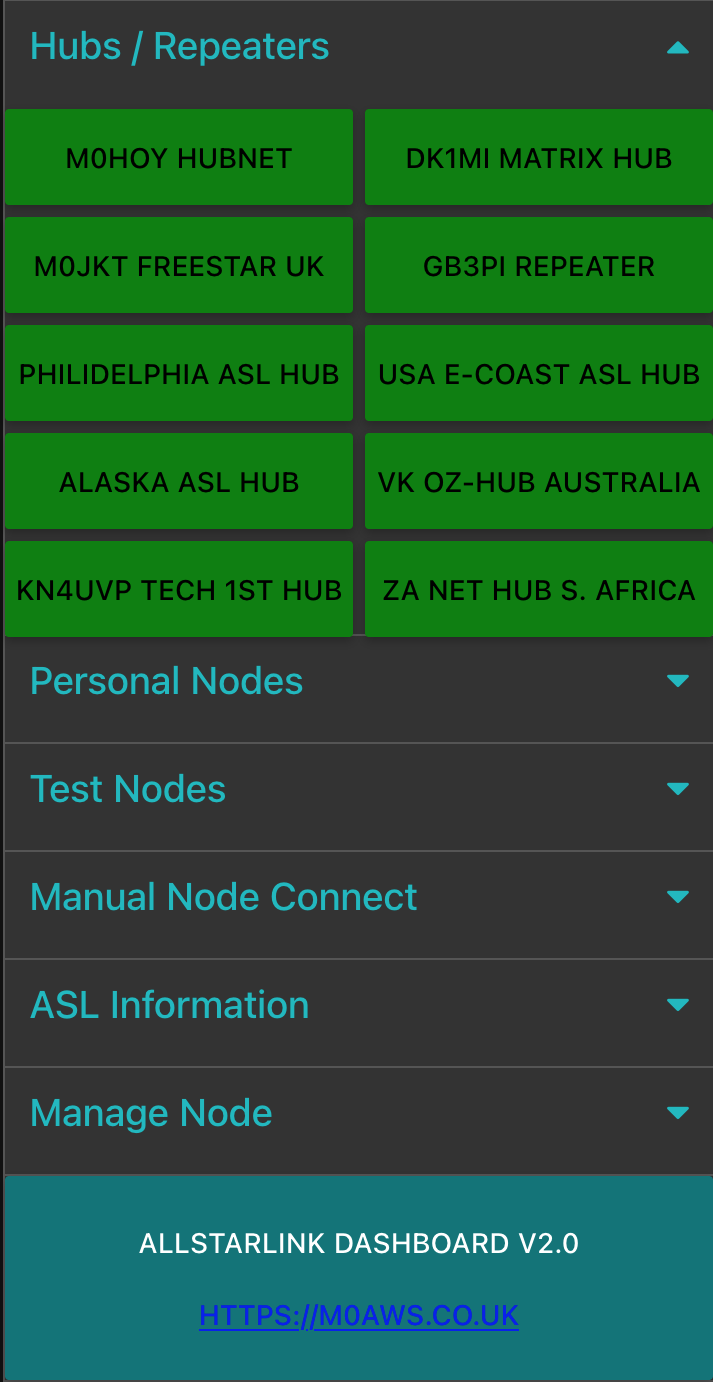
I’ve also updated the the Hubs/Repeaters section so that it provides better global coverage of the AllStarLink network with new nodes in Australia, South Africa and the USA added to the default set.
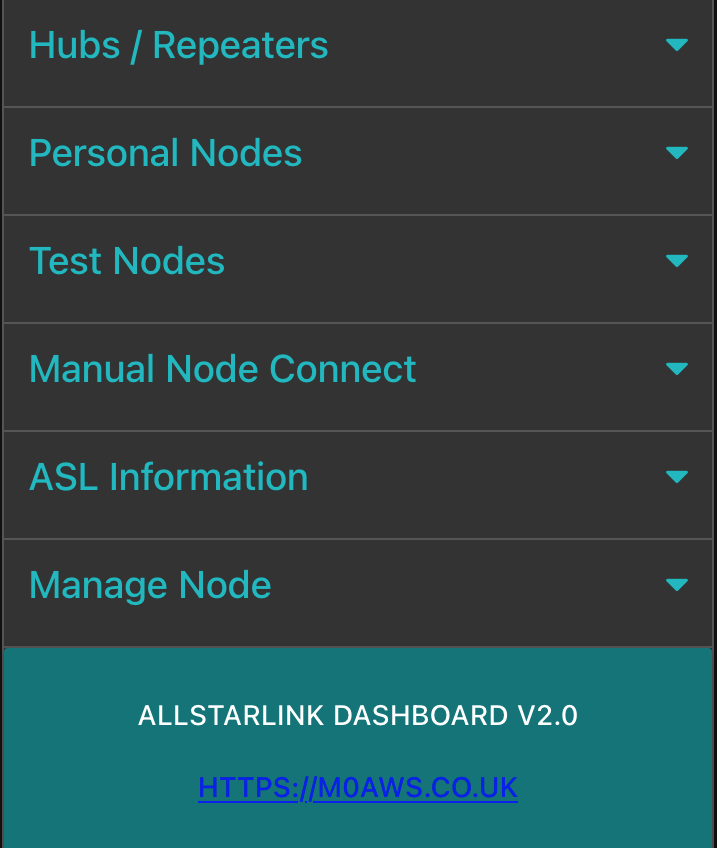
M0AWS AllStarLink Control Dashboard v2.0 Hubs/Repeaters View
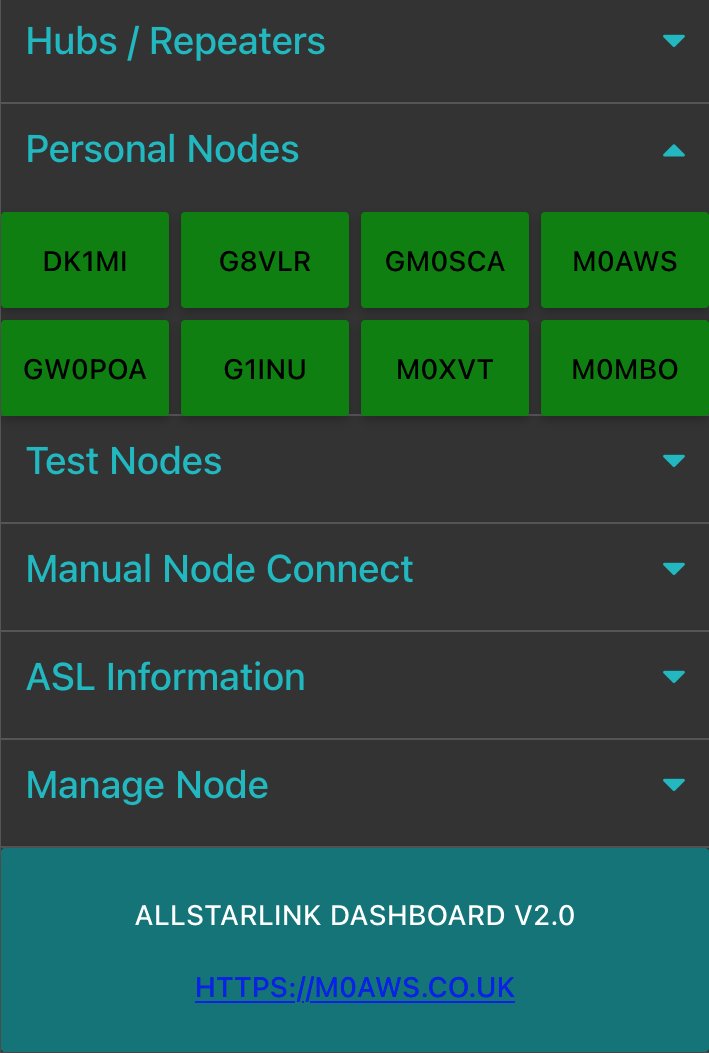
In the Personal Nodes section of the app I’ve added my own node so, if you do download the app and use it, please connect to my node and say hello! I’d love to hear from people that are using the app and get your feedback.
M0AWS AllStarLink Control Dashboard v2.0 Personal Nodes View
In the Test Nodes section there are now two parrot nodes for audio testing. iParrott is still my favourite however, I’ve also added the HubNet parrot as a second option.
M0AWS AllStarLink Control Dashboard v2.0 Test Nodes View
There’s now a new ASL Information section that provides direct access to the network bubble map for your node, a keyed nodes list (Useful for finding nodes that are being used right now), an Active Nodes List and the Full Nodes List for the ASL network. Having access to this information means there really is no need to access Allmon/Supermon to find this information as it’s all available via the app.
M0AWS AllStarLink Control Dashboard v2.0 Information View
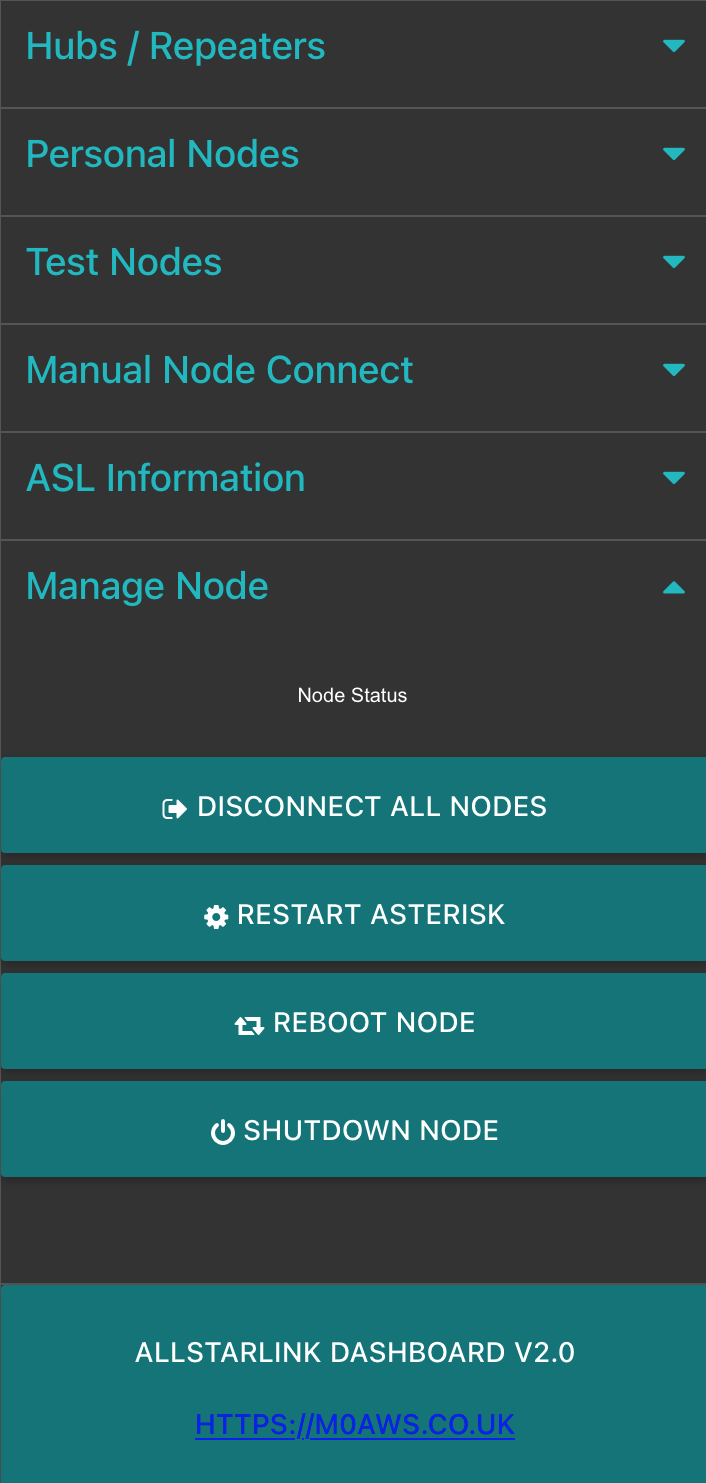
Finally, the Manage Node section of the app also gets an update with the addition of a Disconnect All Nodes button. This comes in handy when you’re connected to a bunch of nodes and need to clear down quickly.
M0AWS AllStarLink Control Dashboard v2.0 Manage Node View
As you can see there’s been quite a few changes to the app providing some new functionality whilst updating the previous version to make it even more useful. You can download the AllStarLink Control Dashboard v2.0 flow below.
To import the flow, open the Node-RED flow editor and import the flow from the burger menu. Once imported, double click the Get ASL Node Number node at the top of the flow, delete the credentials and then create new credentials for connecting to your RaspberryPi/SHARI AllStarLink node. Then go to each blue BigSSH Node in the flow and select your new credentials entry in the drop down list. Once this is done deploy the flow and you’re ready to go.
Note: If you have a v1.x version of the app already running you will need to either delete the flow or disable it by disabling all the trigger (inject) nodes and deploying so that the old and new apps aren’t trying to control the ASL node at the same time.
For more detailed information on how to deploy the app (v1.x/v2.0) from scratch please see my original article for the v1.0 deployment as it covers everything you will need to know.
Thanks to Steve, M0XVT for his help testing v2.0 of the AllStarLink Control Dashboard and getting it out into the wild so quickly.
I’ve been working on squashing some bugs in my Node-RED AllStarLink Control Dashboard with the help of Steve, M0XVT which has resulted in a new version of the flow now being available for download below.
If you’re reading this and aren’t too sure what it is all about then, have a look at my original article detailing the Node-RED AllStarLink Control Dashboard that I developed and wrote about back in September 2024 and hopefully it’ll all make sense.
This new version of the flow resolves an issue whereby the dashboard used an incorrect node number for the node it connects to resulting in it not working unless a piece of code was changed. The update was a simple change to add a couple of nodes that connect to the RaspberryPi and read the Asterisk/AllStarLink node number from the asterisk configuration files at startup.
Node-RED AllStarLink Control Dashboard v1.2 additional sub flow
I also fixed another bug whereby the buttons could show a false connect on a button when the user connects to another node via AllMon2/Supermon instead.
This flow no longer has the blue spare button as it now connects to a node in Melbourne Australia.
Node-RED AllStarLink Control Dashboard v1.2
You can download the new, v1.2 updated flow below and import it to your Node-RED flow editor using the standard import tool from the burger menu in the flow editor.
Ever since I started using Node-RED I’ve been using the standard node-red-dashboard set of user interface (UI) nodes to build my numerous dashboards to enhance my radio hobby and add new functionality to the operating of the station. The series of UI nodes are very simple to use and have served me well however, they are no longer being developed and are now deprecated in the overall Node-RED project.
To this end flowfuse.com have stepped up to the mark and developed Dashboard 2.0. This new series of UI nodes brings a new, more modern look and feel to the Node-RED dashboard along with some new functionality.
Short video showing the new Node-RED Dashboard 2.0 Linear gauge
I’ve only just started investigating Dashboard 2.0 but, it’s proving to be fairly easy to use. The short video clip above shows an S-Meter display developed using Dashboard 2.0 for my FTDX10 transceiver.
Full instructions on how to install and configure Node-RED Dashboard 2.0 can be found on the flowfuse.com website.
Be aware though, Node-RED dashboards developed using Dashboard 1.0 will not work under Dashboard 2.0, you will have to import the old v1.0 flow(s) and manually go through them and change all the UI nodes to new Dashboard 2.0 nodes. Since some of the new nodes work differently to the old nodes you’ll also find you will need to make code changes to get the same/similar functionality.
I’m finding it easier not to import old flows but to recreate them afresh under Dashboard 2.0 using the old flow version for reference.
Overtime I will migrate my dashboards over to the new 2.0 version however, this is going to be a lot of work, especially in the case of my QO-100 Ground Station Dashboard as it contains a considerable number of UI nodes, and will take a fair amount of time to migrate.
I’ll document my findings as I go as I’m sure there will be a few trials and tribulations along the way.
Thanks to Neil, G7UFO for pointing me to the new Dashboard 2.0 information.
Ever since I built my RaspberryPi/SHARI AllStarLink node I’ve had to manage connecting/disconnecting to/from other nodes using the Allmon2 or Supermon web admin interfaces. These work fairly well albeit, a bit clunky and buggy. It’s impossible to use from a mobile device though and so I have to get my Macbook out each time I want to connect/disconnect nodes.
Being a Node-RED fanatic I decided that I should put something together that was more portable, mobile friendly and much easier to use. A simple user interface is all that is required and can be achieved very easily using the standard Node-RED dashboard nodes.
Initially I started investigating the Linux command-line interface for Asterisk, the VOIP system that underpins AllStarLink (ASL). I very quickly discovered that the ASL node can be very easily controlled directly from the command-line and that this would be an ideal interface to use to enable node management via a Node-RED dashboard.
In very little time at all I had an experimental control dashboard working with the ASL node and was able to connect/disconnect to/from a single node. All that was required now was to extend this so that I could connect to a number of nodes with nothing more than a push of a button.
Completed v1.0 AllStarLink Control Dashboard – Node-RED Flow
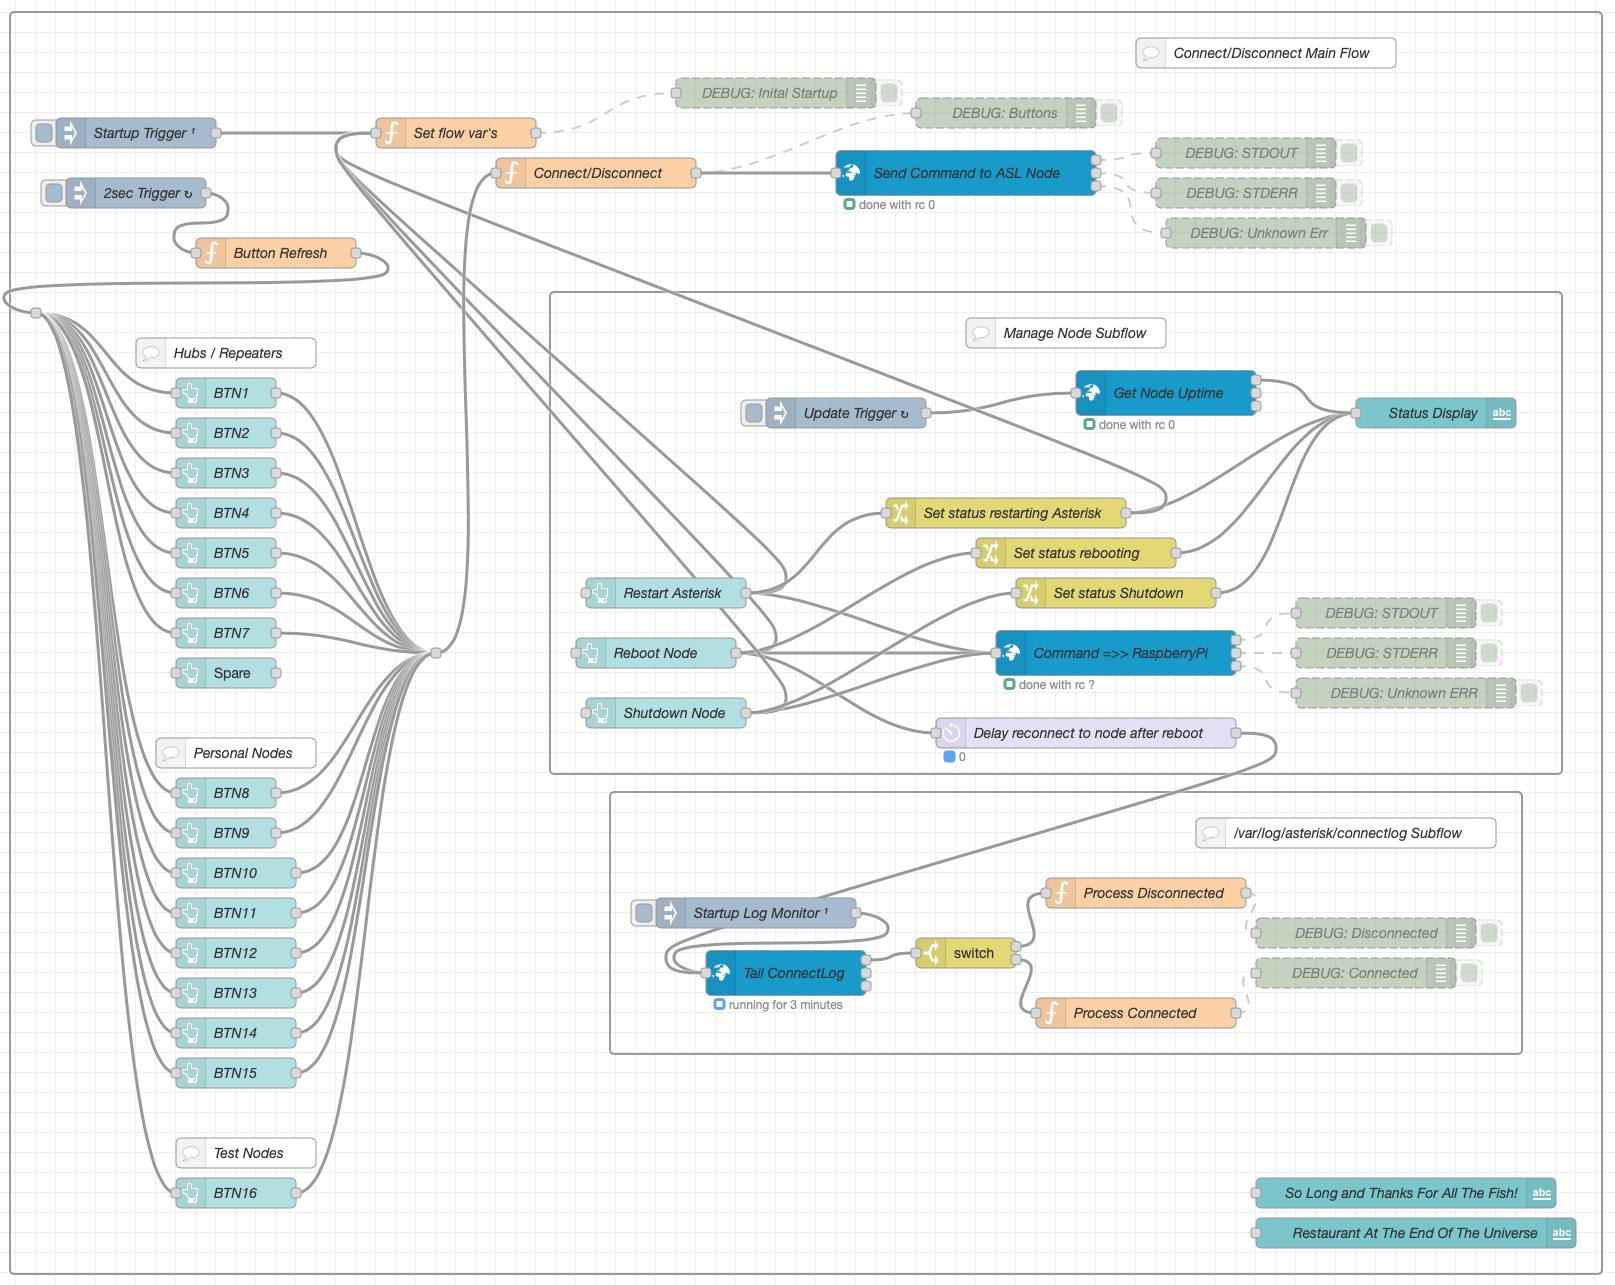
The resultant flow consists of 3 sections, Connect/Disconnect Main Flow, Manage Node Subflow and /var/log/asterisk/connectlog Subflow.
The Connect/Disconnect Main Flow handles all the input from the buttons on the dashboard and the communication to the underlying Asterisk VOIP system.
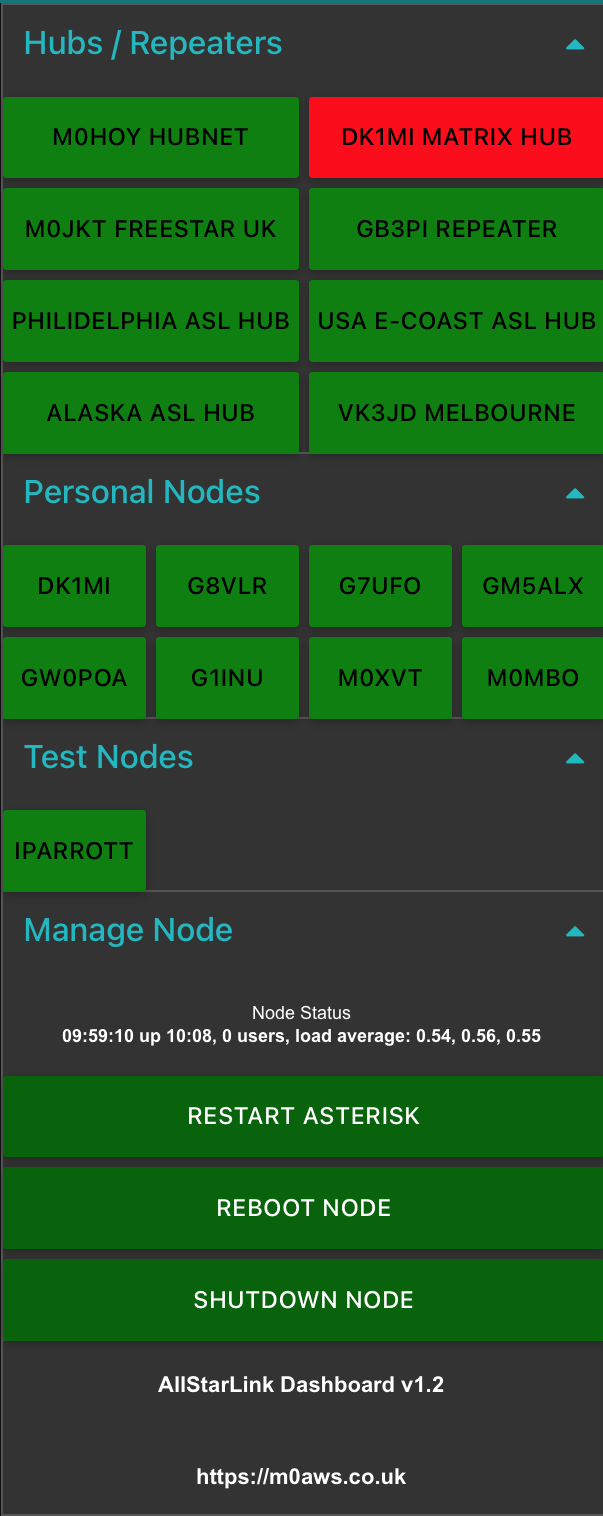
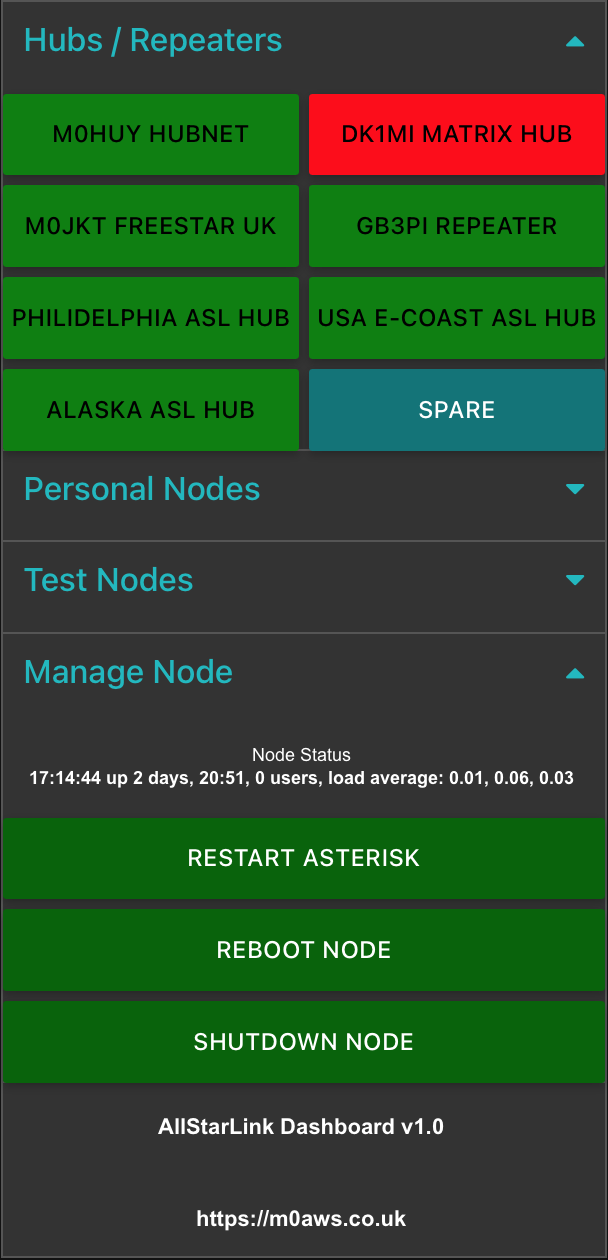
The button status is denoted by 3 colours, green (Ready to connect), orange (Transitioning to/from connect) and red (Connected). Each button is updated automatically by the button refresh function that is triggered every 2 seconds.
The Manage Node Subflow provides a simple interface to restart the Asterisk VOIP system, reboot the RaspberryPi and shutdown the RaspberryPi. The node status is automatically updated every 45 seconds and will show when the Asterisk subsystem is being restarted or the node is being rebooted or shutdown.
Finally the var/log/asterisk/connectlog Subflow monitors the Asterisk connectlog looking for connect/disconnect messages so that it can signal to update each button status.
Node-RED AllStarLink Dashboard
Each section of the dashboard can be collapsed/opened by touching/clicking the little blue arrows on the right of the dashboard. The dashboard works fine on Android, iOS, Windows, MacOS and Linux.
If you’re not familiar with Node-RED and haven’t yet installed it to your PC, take a look at the Node-RED Getting Started Page. The information takes you through installing Node-RED onto a multitude of devices including PC and RaspberryPi devices.
Once you have Node-RED installed all you need to do is download the AllStarLink Control Dashboard Flow and import it to your Node-RED flow editor.
Note: The link above is now for v1.2 of the flow which includes some critical bug fixes. You can read about the bug fixes in the v1.2 release article.
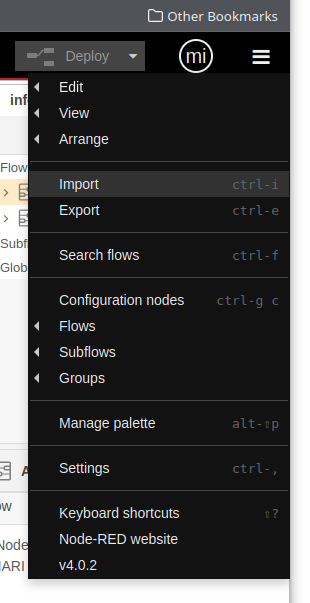
Once downloaded, select Import from the burger menu icon on the right-hand side of the flow editor as shown below and import the flow file.
Node-RED Flow Editor import Menu Item
Once imported you will find that some of the nodes in the flow are not available. This is because you need to add them to the flow editor palette before being able to deploy the flow.
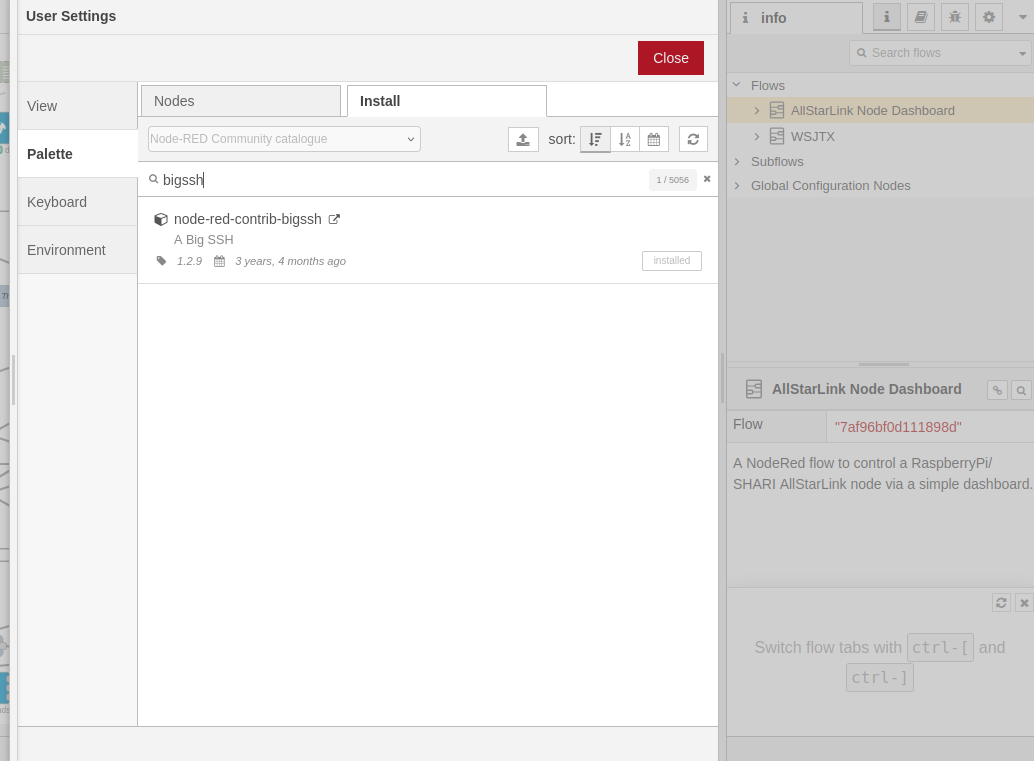
Drop down the same menu as shown above but, this time select Manage Palette. This will open another window where you will need to select the Install tab as shown below.
Node-RED Flow Editor Palette Install Tab
You need to install two node sets to complete the flow, node-red-contrib-bigssh and node-red-dashboard. Type in the name of each package one at a time in the search bar and then click the Install button. Once the two packages are installed you then need to configure the credentials for logging into your RaspberryPi. This is simply done by double clicking the blue Send Command to ASL node at the top of the main flow and then clicking the Pencil button at the end of the Credentials field. This will open another window where you will need to type in the IP Address of your ASL RaspberryPi into the Host field, then enter 22 into the port field, add repeater into the Username field (repeater is the default username, if you have changed this then you will need to add the new username name in instead) and then the password associated with the repeater login into the Password field. (Normally allstarlink)
Once this is done, do the same on the other blue nodes, namely “Get Node Uptime“, “Command =>> RaspberryPi” and “Tail ConnectLog”.
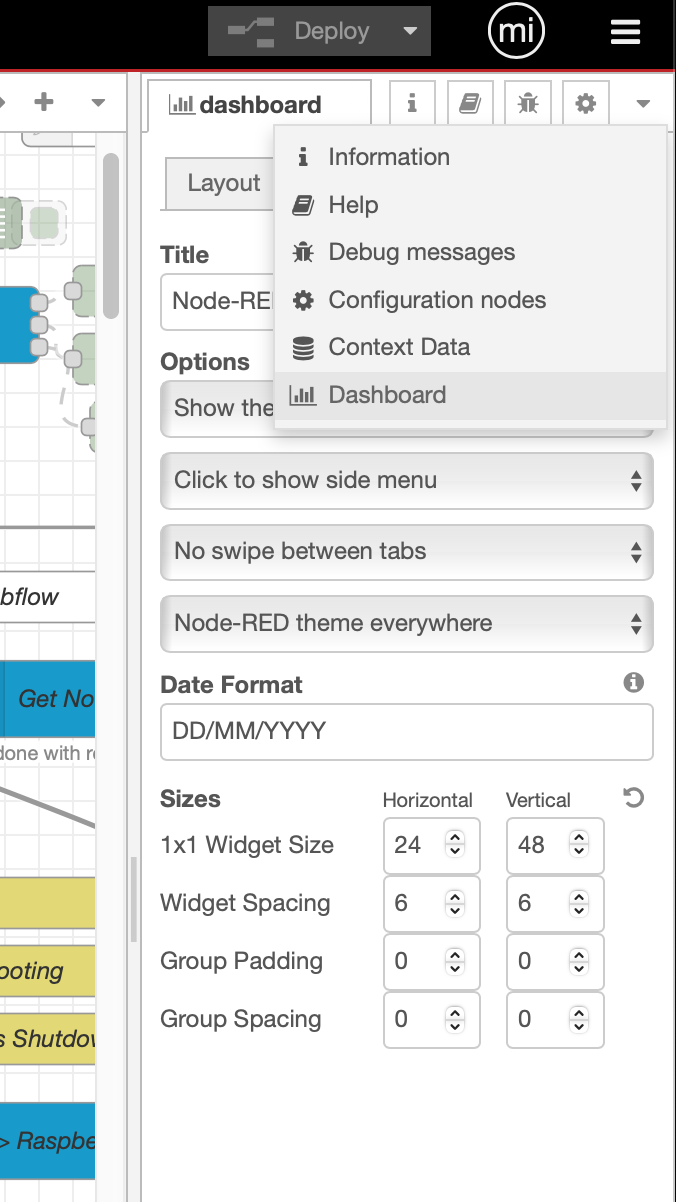
The final thing to setup is the dashboard size. Click on the downward pointing triangle at the top right of the menu bar (under the burger menu) and select dashboard. Check that the sizes are set the same as in the image below. For some reason, these settings aren’t always imported (Possible bug?) so, if your dashboard layout isn’t like shown above it will be because these settings failed to import.
ASL Dashboard Settings
You are now ready to deploy your AllStarLink Control Dashboard! Press the red Deploy button at the top of the flow editor window.
Finally, if you want to change the nodes that each button connects/disconnects you will need to edit the set flow var’s function at the top of the main flow. All you will need to do is replace the existing node numbers taking care not to alter the rest of the code in any way otherwise, it could stop the flow from working.
Once you’ve edited the node numbers, double click on the associated button node and change its Label to show the new node name.
Once your changes are complete, Deploy the flow again and your changes will be live.
This is version 1 of the ASL Dashboard, I already have ideas for version 2 that will also have the ability to enter a node number into a field and connect to it without the need to program it into a button.
More soon …
We use cookies to ensure that we give you the best experience on our website. If you continue to use this site we will assume that you are happy with it.