
piHPSDR-Improved – Our First Release

piHPSDR-Improved Logo from The Three Amigos development team
piHPSDR-Improved Logo from The Three Amigos Development Team

For some time now Steve (M0XVT), Alan (G1SQB) and I have been working on a version of piHPSDR to use with our Hermes Lite 2, Anan 200D, Adalm Pluto, Pluto+ and LibreSDR transceivers. The biggest problem we’ve had is the constantly changing code on github that often would stop the software from working on one device or more each time we updated and then we’d have to spend hours finding the issue and fixing it.

Eventually we got tired of this and decided to build our own stable version that doesn’t get anything from github and is made up of all the parts necessary to create a version that just works on the devices that we use on a daily basis.

Using piHPSDR on the QO-100 satellite and the HF bands across a number of very different types of hardware is a challenge in itself, especially when the devices use different protocols and only certain library sets work with certain firmware on some devices, the combinations get complicated to say the least.

To differentiate our build of piHPSDR from all the others available on the internet today we decided to call it piHPSDR-Improved.

So what is piHPSDR-Improved?

piHPSDR-Improved is a version of piHPSDR that has the fixes and enhancements in it that we’ve dreamt of having over the last couple of years. Some of the fixes are simple things like being able to detach the toolbar from the main window thus giving more space for the two panadapter/waterfall displays and have all the toolbar buttons on another screen in a floating toolbar. Other enhancements were more involved and addressed some of the most annoying issues like none of the settings for VFOB (RX2) were saved and so, every time you started the program you had to setup the RX2 all over again from scratch. These sound like simple fixes but, believe me, they’re not.


Another thing we wanted to do was make piHPSDR-Improved easy to install. Many Windows users transitioning from Windows to Linux often regret it the moment they have to use the Linux command line to install piHPSDR.

We’ve committed to having GUI installers for all the applications that we develop and release, regardless of how much extra work this entails.

It’s time installing software on Linux desktop PCs was as easy as it has been on Windows PCs for decades.
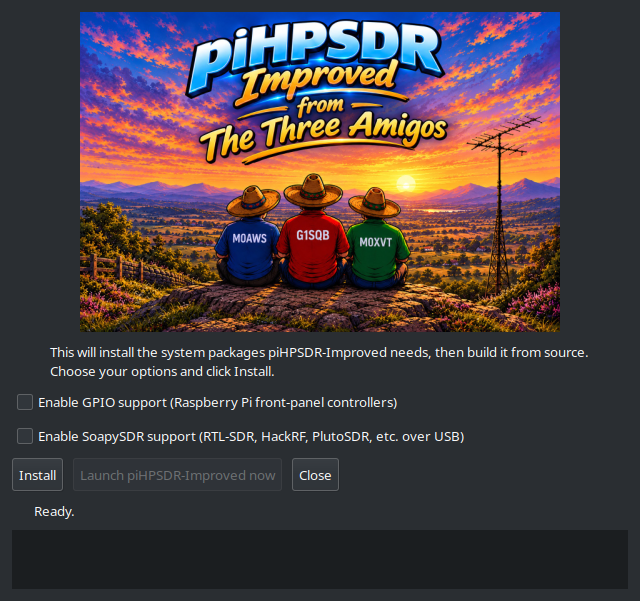
piHPSDR-Improved GUI Installer

We’ve taken a modular approach to building piHPSDR-improved. Rather than putting everything into the one application, we’re going to be releasing add on modules that will bring new functionality over time. This way we can build on a structured, stable base keeping everything operational all of the time.

The first module we’re releasing is piSync and we’ve included it in the zip file that you’ll download to install piHPSDR-Improved.

piSync Logo
piSync Logo

piSync adds functionality to piHPSDR-Improved that Windows Thetis users have had for a long time, namely the ability to use an online WebSDR along side their own SDR transceiver and have it track the frequency, band and mode automatically. This functionality has proven to be incredibly useful when you are struggling to hear a weak DX or QRP station.

With piSync you can now use an online WebSDR receiver closer to the DX station to aid getting that QSO in the log. It’s like having another receiver in your radio that is located anywhere in the world, for free!

We believe this is a first for the Linux platform and we’re really pleased to be able to share it with the Linux community.

We’ve had great fun with piSync during testing and we think you’re all going to find it extremely useful too.

We’re also planning on adding support for FLRig in the next version of piSync so that you’ll be able to use a WebSDR with any transceiver that is supported by FLRig.

Of course it goes without saying, all of our software is Opensource. When you download and install piHPSDR-Improved or any of the new modules you will get the full source code every time and be free to do whatever you like with it. Every module will also have it’s own GUI installer, no more command line, just double click and go.

Both piHPSDR-Improved and piSync have been tested on RaspberryPi 5/500+, Linuxmint Cinnamon, Kubuntu, Debian 12 (Bookworm) and Debian 13 (Trixie) so, we’re pretty confident it’ll work on most Debian/Ubuntu based Linux distro’s on Intel/AMD PCs and the current versions of the RaspberryPi SBCs.
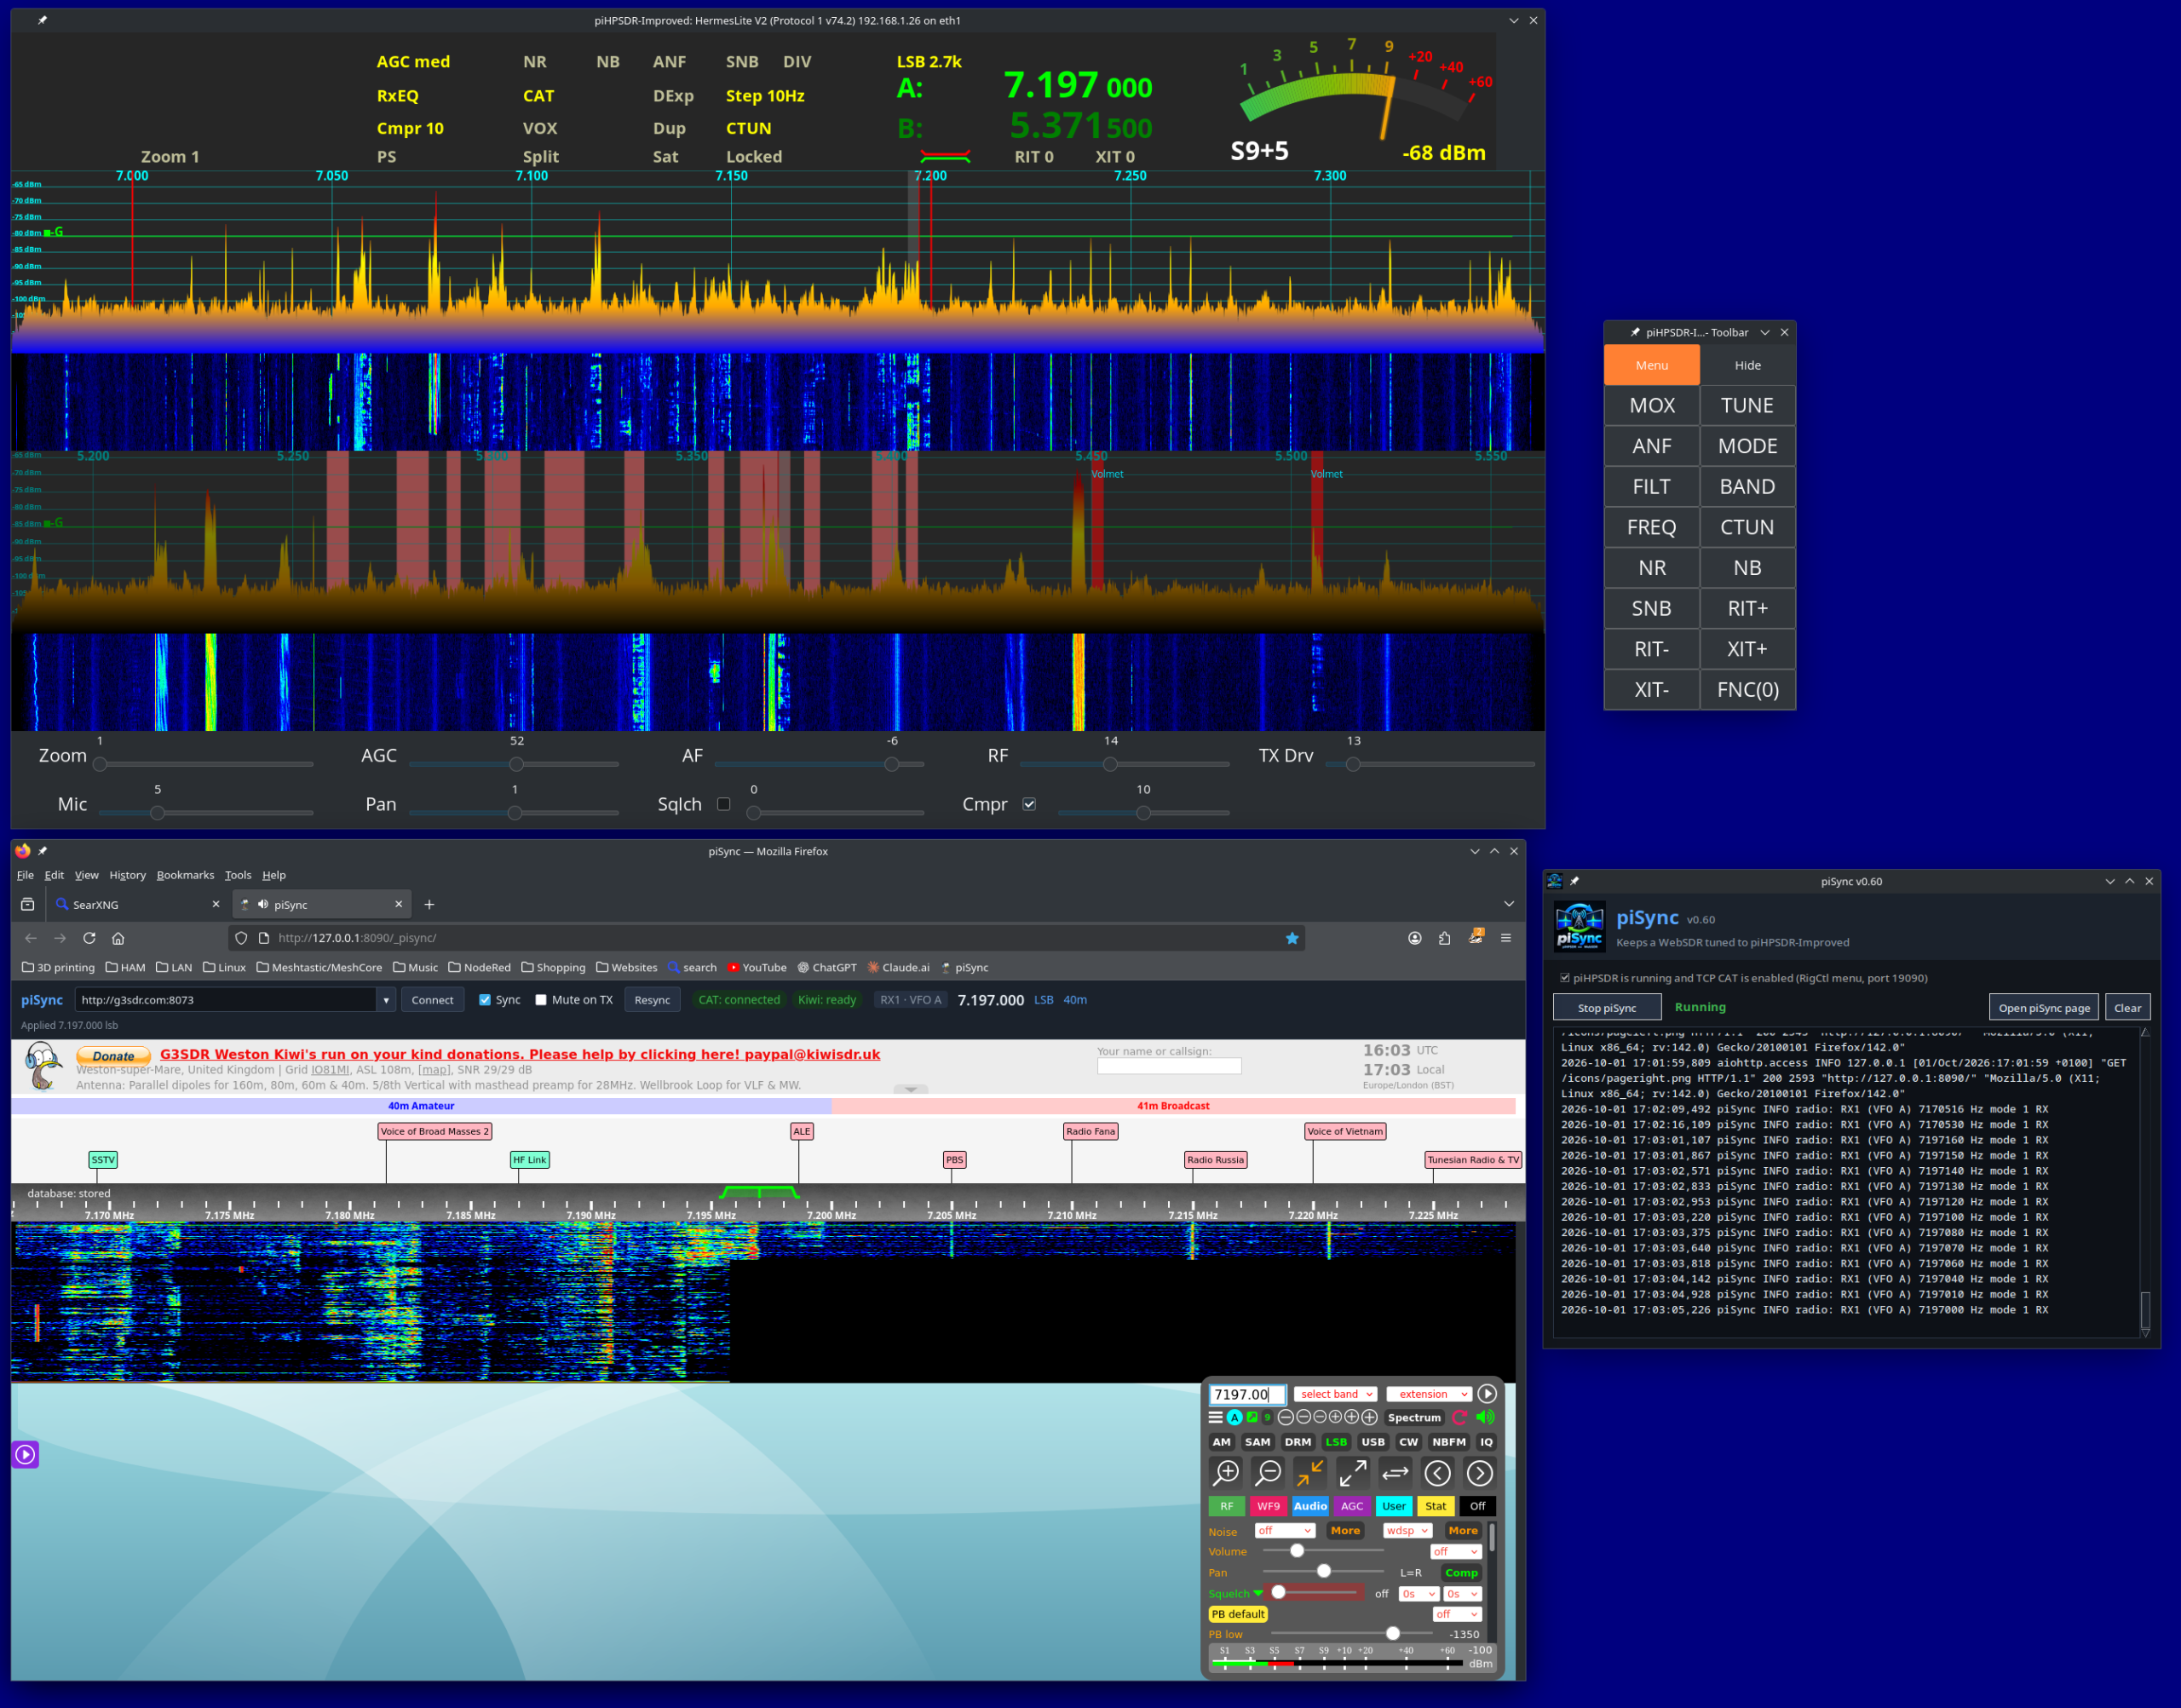
piHPSDR-Improved, piSync and a WebSDR running on a pi 500+

Inside the zip file you’ll find a file called README.1st, do make sure you read this before installing any of the software as it contains some important information that’ll make installation as easy as possible.

To download both piHPSDR-Improved and piSync in an easy to use zip file, just click the Download button below.


We’ve got lots of ideas for new features, modules and bug fixes (Yes there are still some bugs in there!) which we will be releasing over time. Don’t expect this to happen overnight as Steve still works full time and Alan and I are both enjoying our retirement.

This is just another facet of our hobby and we don’t like to rush things. We do like to use our radios on air, pretty much daily and so we do this software development in between all the other fun things that Amateur Radio has to offer.

To be clear and open we do use Claude Code to help with development. I go through as much of the code as I can without spending days and days just reading code. I am retired after all and have spent enough of my life professionally writing and debugging both my own code and other people’s code. We do a lot of testing on a good number of Linux distros before we even consider releasing the software to the wider world and use it on air as part of the testing process, so we’ve done as much as we can to ensure we’ve not introduced new bugs to the software. Keep in mind we do this as part of our Amateur Radio hobby and so, it needs to be fun and enjoyable.

We hope you enjoy using the software and find it useful. If you’ve got ideas for new things you’d like to see in future versions then please feel free to contact any of us via our contact details on QRZ.

UPDATE: We’ve fixed a little bug in piSync and released an updated version. You can download it from this article.

More soon …
Realtime WSJT-X decode data map

Following on from my previous article on Enhancing Digital modes with Node Red I’ve now got to a point where I have realtime decode information from the WSJT-X digital application being plotted on a Node Red world map not just for CQ calls but, for stations in conversation too.

The flow has become somewhat more complex than it was originally as more and more functionality has been added. I have deliberately split out the flow process into more nodes than are really necessary so that the flow is easier to understand. Anyone from a programming background like myself will soon realise that a lot of the nodes could actually be combined into one big node however, the overall flow process wouldn’t be so easy to understand for the Node Red newcomer and would possibly put people off from trying it out.

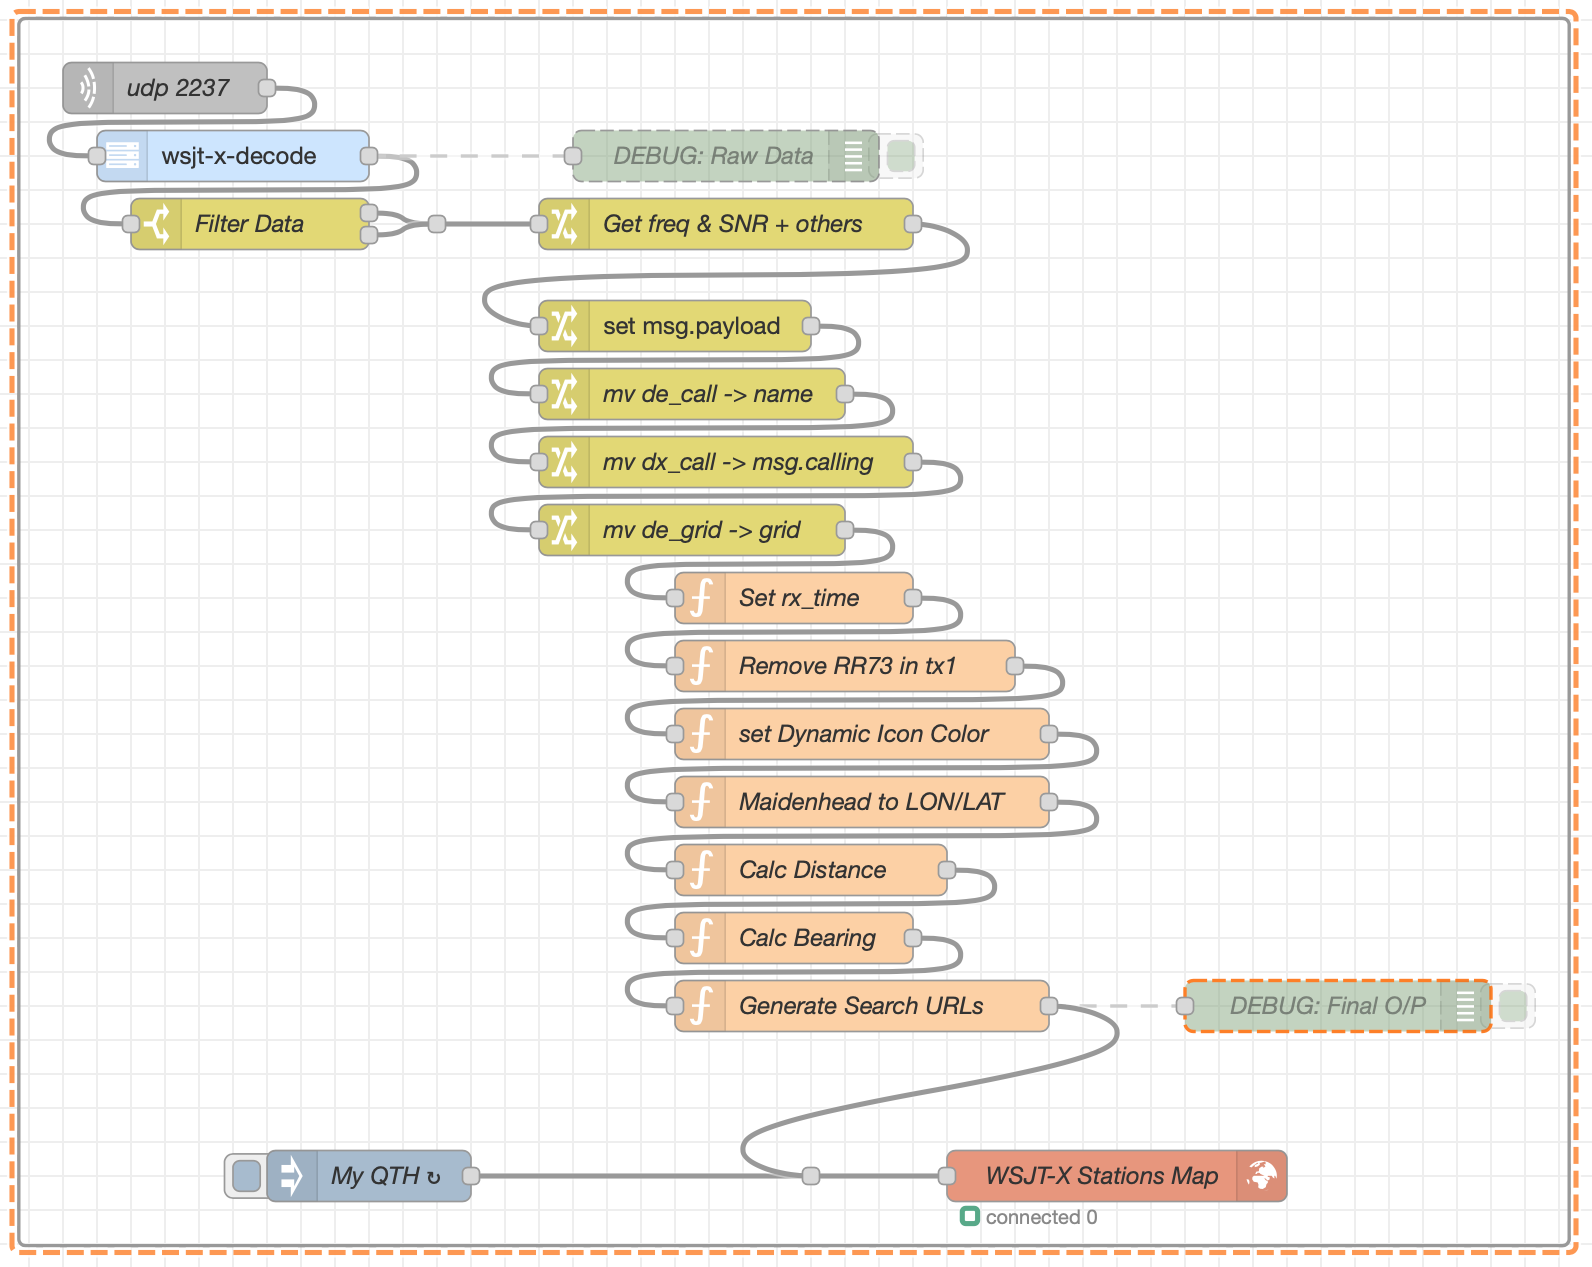
Current WSJT-X Node Red flow

Above is a screenshot of the flow as it currently stands. It’s pretty easy to understand what is happening in the flow due to the fact that the processes are broken out into small, easy to digest blocks.

From the top down we connect to WSJT-X via UDP port 2237 and listen for the data stream. As the data is received it’s passed directly into the WSJT-X-Decode node that converts the information into a Node Red compatible format. The data is then filtered with only the information required being passed onto the next node. There are two outputs from the filter node as we require two different streams of information, namely “CQ” and “TX1” data. All the rest of the data from WSJT-X is ignored as it’s not required at this time.

The “Get freq & SNR + Others” node builds a decode message payload with all the correct data, in the right format ready to be passed on along the flow. This node also sets a number of parameters required by the map node to be able to control the display of the data.

The next node along is “Set msg.payload”, this brings together all the necessary data into a single message payload that is then worked on by all the nodes further along the flow.

The next 3 nodes perform the simple task of moving some of the data into the objects defined by the world map node, if the data isn’t moved into these specific objects the map will not plot anything.

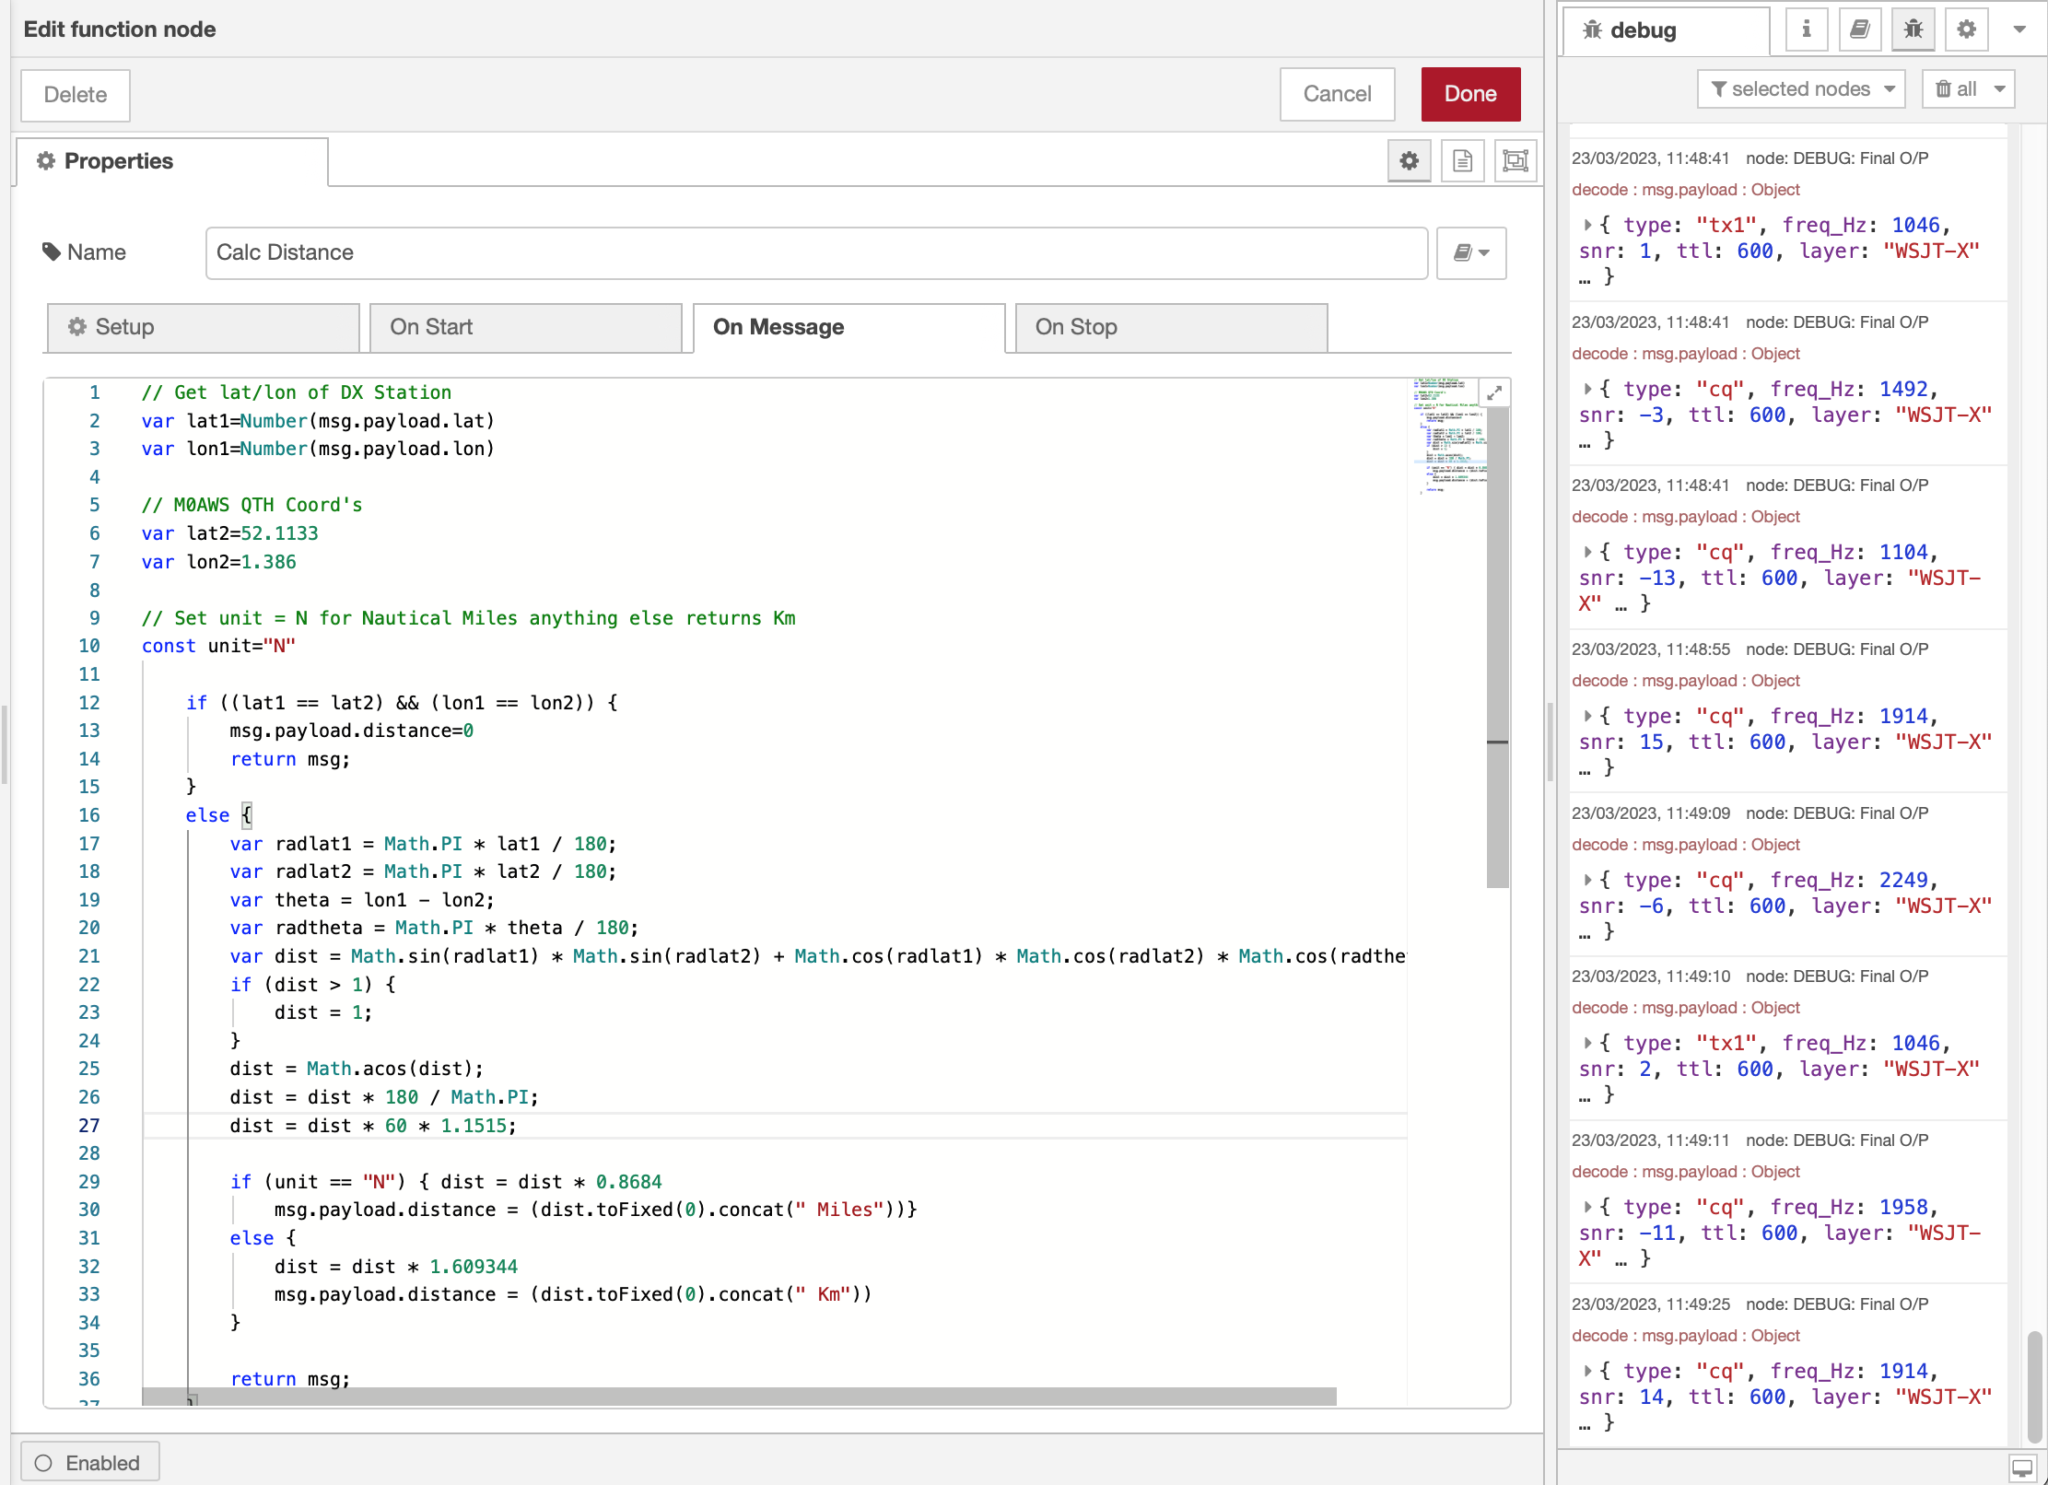
Now we get onto the slightly more difficult bit that might put off those who aren’t from a programming background. The next 7 nodes are all javascript functions which I have created to perform tasks that cannot be done via the standard Node Red pallet.

At this point it’s worth noting that I’m not a javascript programmer, I’ve used Python, Rust, Go, C and many other languages during my 40 plus year career but, javascript has never been one of them. I’m sure any seasoned javascript programmer will most likely raise an eyebrow at my attempt at javascript programming but, you need to remember that I’m doing this in my retirement and my enthusiasm for learning yet another programming language has wained somewhat!

So, getting back to the flow, each javascript function does just one task each of which is as follows:

  • Set rx_time – Sets the time the data was received/processed
  • Remove RR73 in tx1 – Remove decodes where RR73 is in TX1 instead of a valid callsign
  • Set Dynamic Icon Colour – Sets the icon colour depending on what type of call is decoded
  • Maidenhead to LON/LAT – Converts Maidenhead locator codes into LAT/LON Coordinates
  • Calc Distance – Calculates the distance between “My QTH” and the DX station
  • Calc Bearing – Calculates the bearing/beam heading to the DX Station from “My QTH”
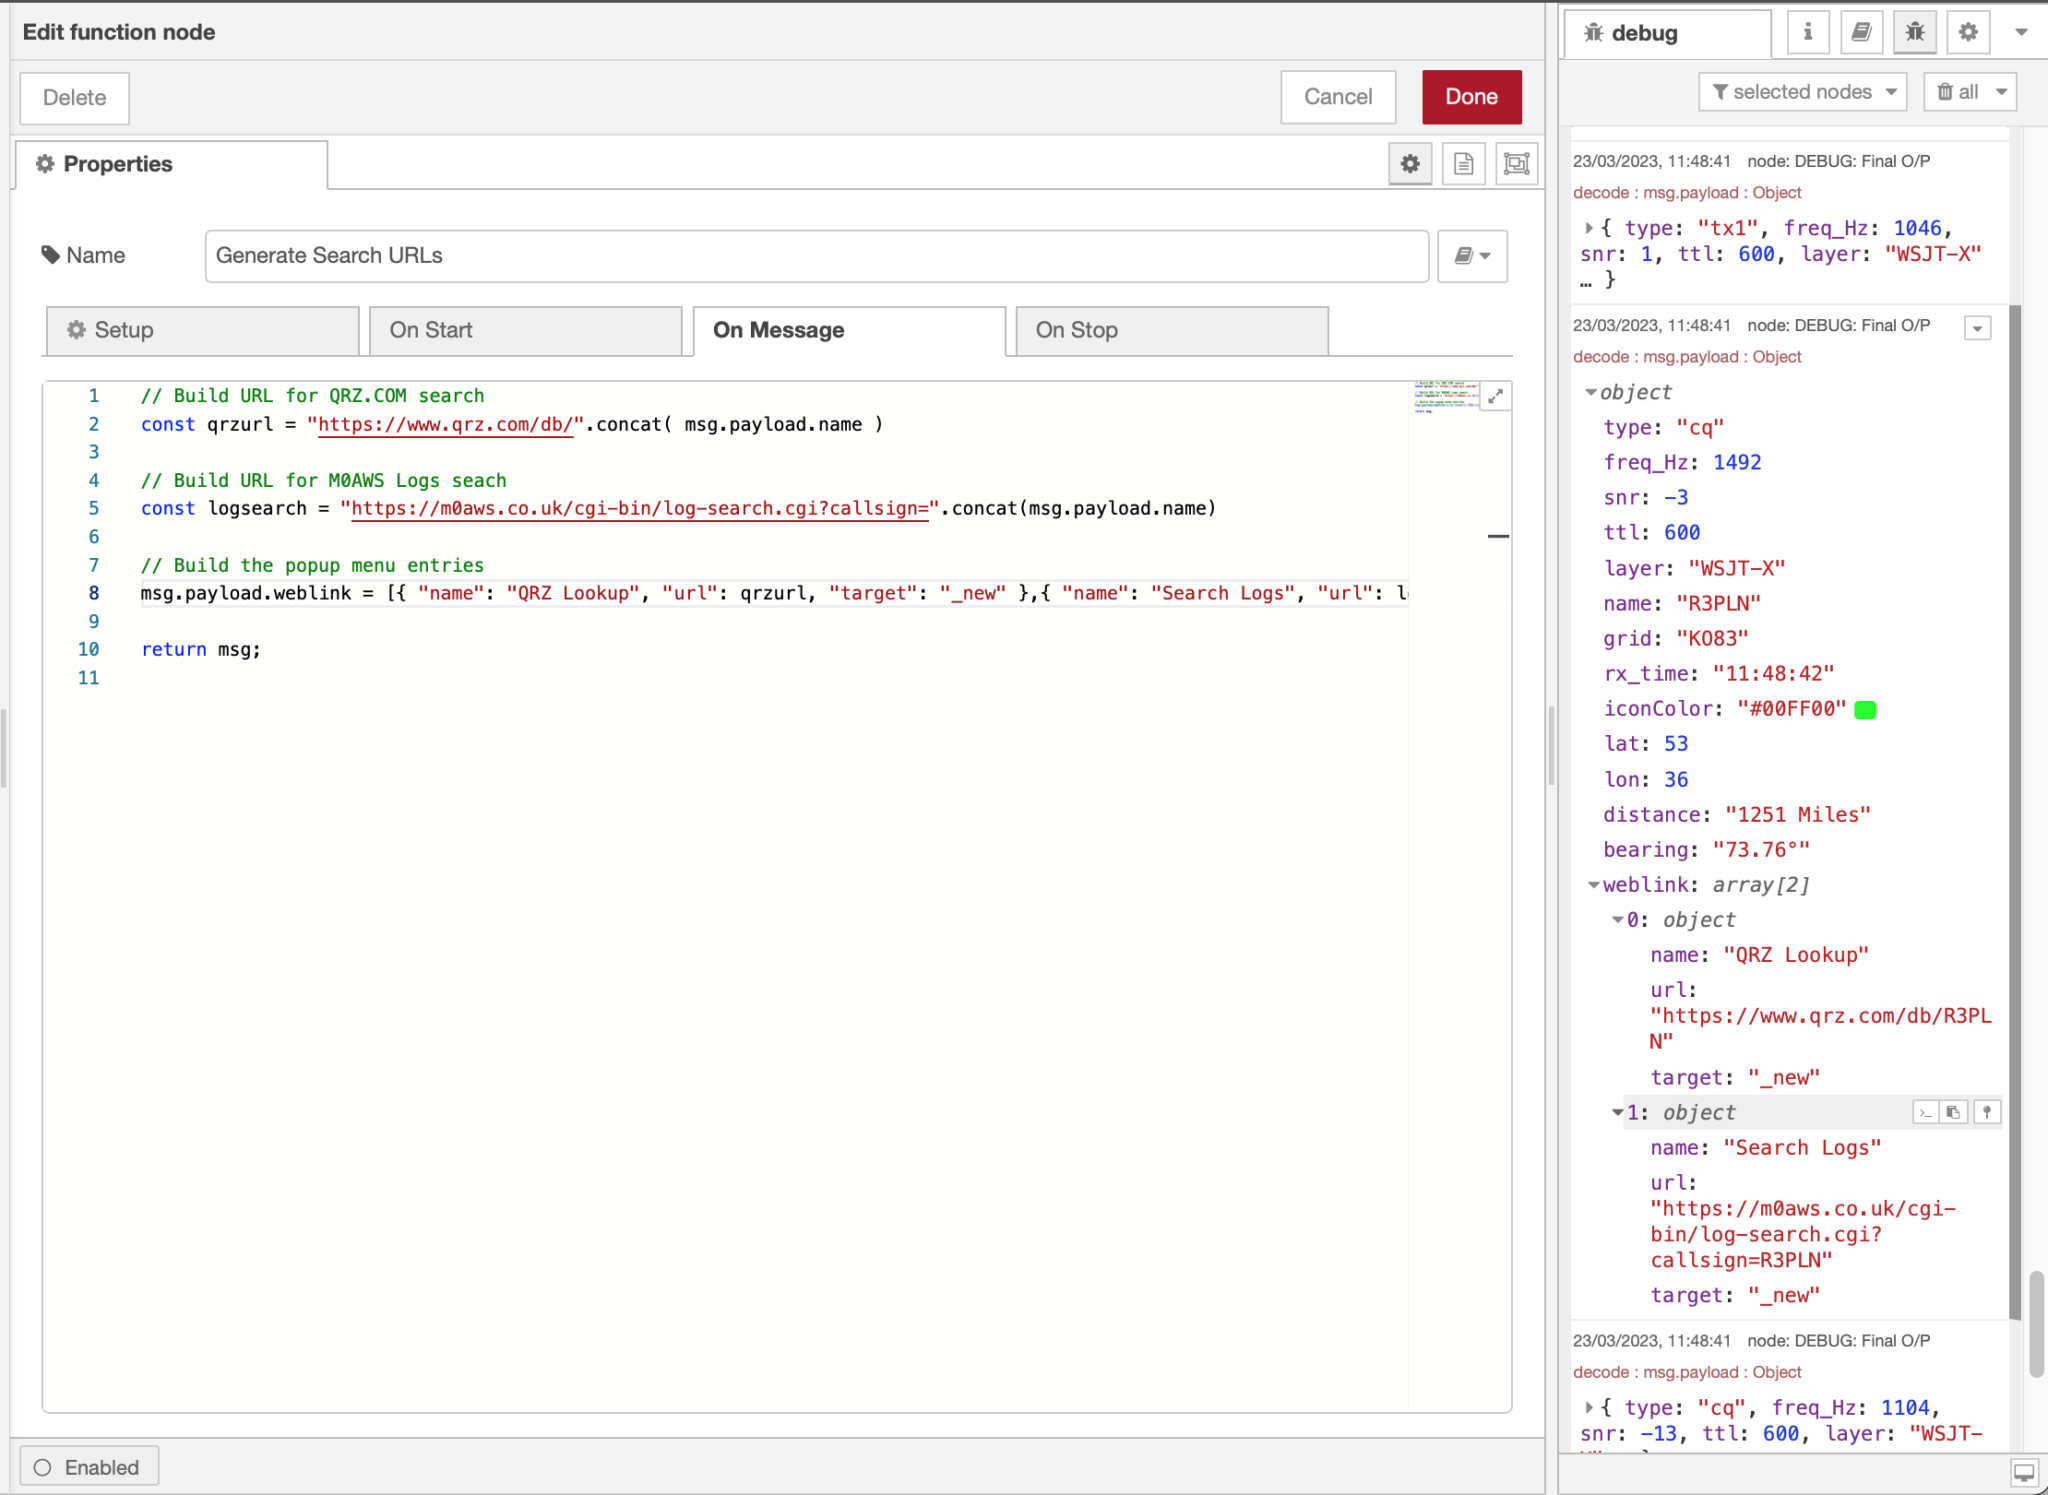
  • Generate Search URLs – Generates the URLs for QRZ and my own online log lookups
Editing the Calc Distance function with debug info in the far right panel

Once all the functions have run the resultant data set is forwarded on to the WSJT-X Stations Map node where it is plotted real time on a world map.

To view the map point your web browser at your PC running Node Red as follows:

http://radiopc.your.domain:1880/worldmap/

Or if you haven’t got a DNS setup at home then just use the IP Address of the PC instead:

http://192.168.100.10:1880/worldmap/

Don’t forget that for all of this to work you must configure WSJT-X to send data via UDP on port 2237 otherwise the flow won’t be able to connect and listen for the decode data.

You may have noticed that there are 3 other nodes that I haven’t mentioned yet. The two green greyed out nodes are Debug nodes that can be enabled when required to help see what is going on in the flow. These debug nodes will display data in the debug panel on the right of the flow editor screen when they are enabled, they are extremely useful for debugging!

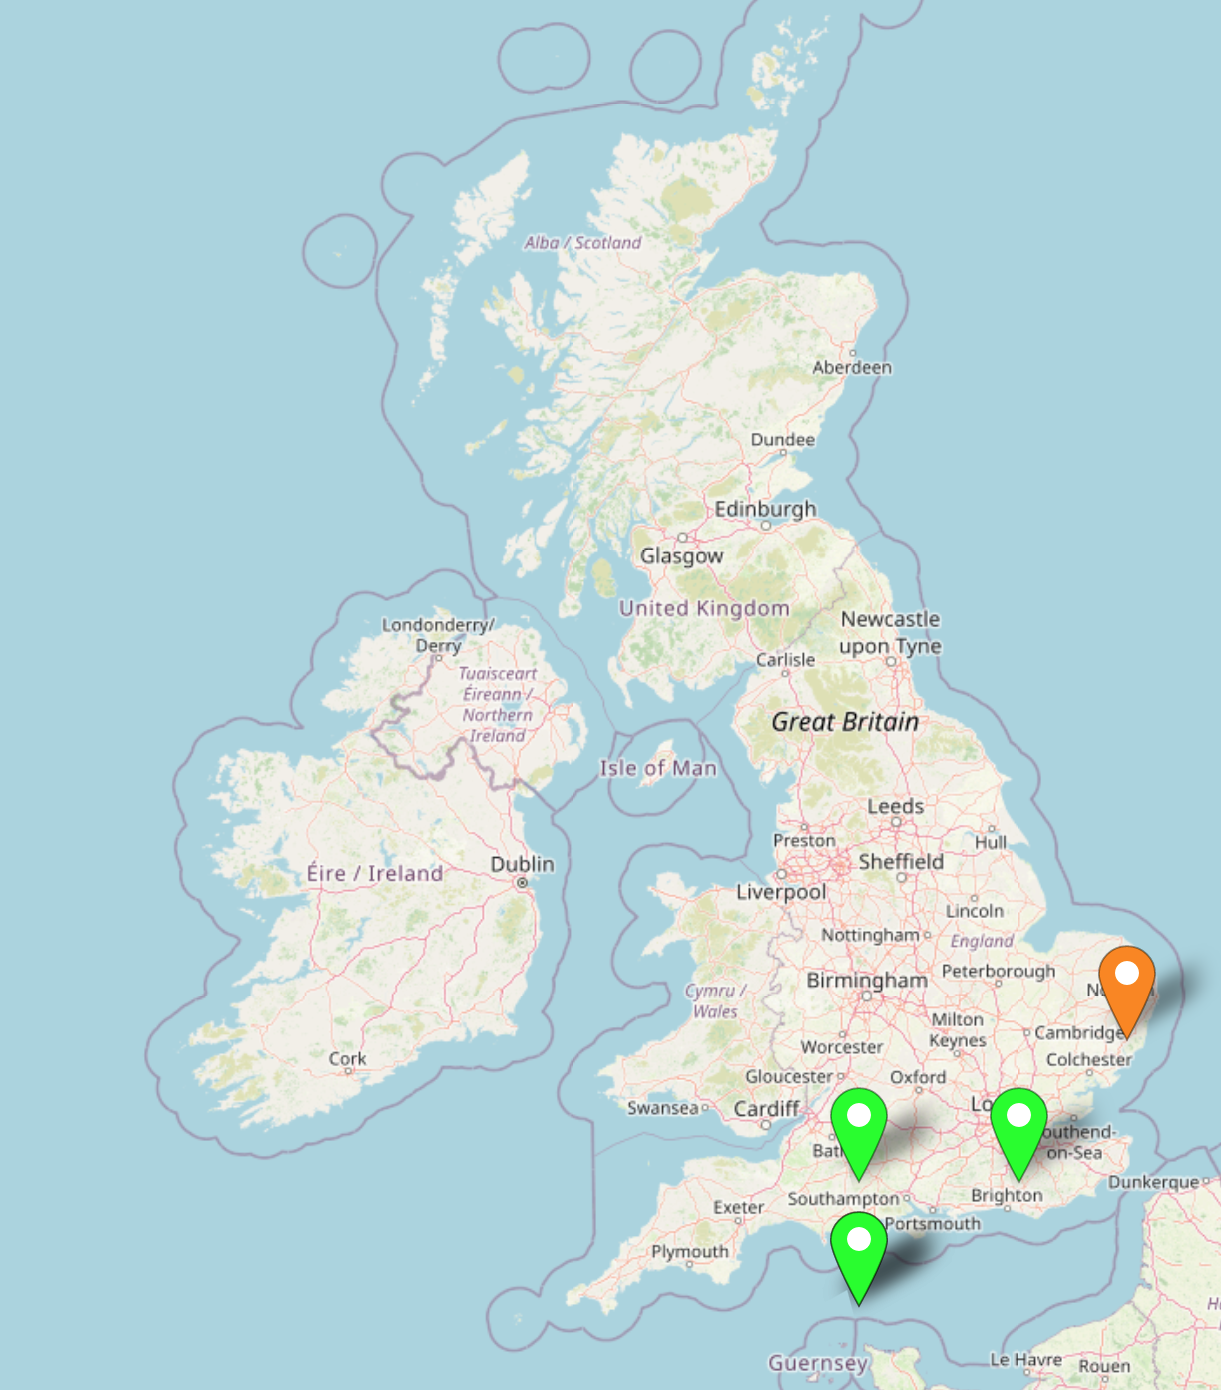
The third is the blue My QTH node, this contains data pertaining to my QTH that is plotted on the map using an orange icon. You can easily edit this node to point to your QTH instead.

WSJT-X Node Red map showing orange icon denoting my QTH

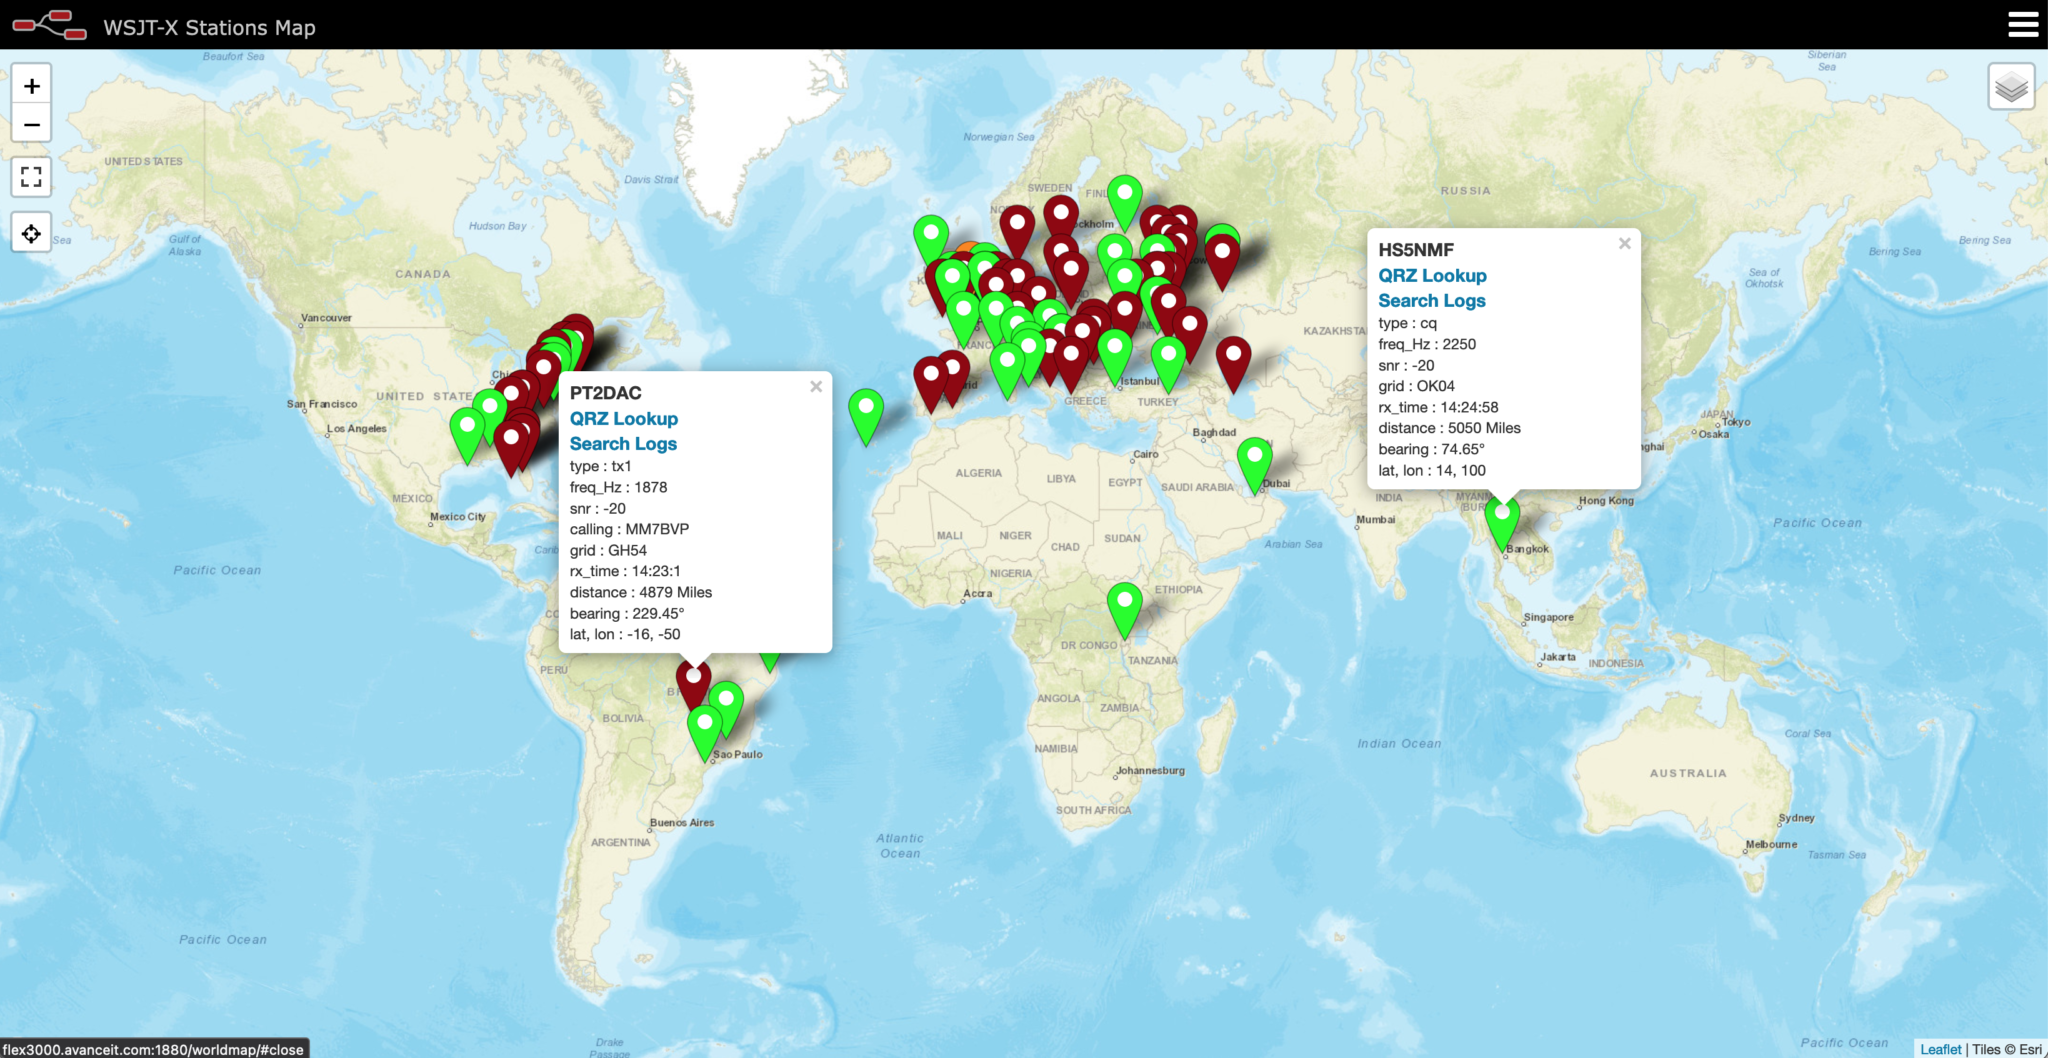
Once the flow is deployed you’ll be surprised how quickly the data starts to be plotted on the map. Stations calling “CQ” are shown by Green icons and stations that are in a QSO with another station are denoted by the Red icons.

Each icon is clickable and will present all the information collected by WSJT-X for each station viewed.

WSJT-X Node Red World Map showing FT8 stations realtime on the 12m Band

The popup also has two clickable entries, one will take you to the qrz.com page for the station being viewed and the other will search my logs to see if I have worked that station already and if so it will open a new tab showing the information.

Node Red Function Editor showing the Generate Search URLs function

You can edit the “Generate Search URLs” node so that it points to your online logs search engine so that you can view your own log data instead of mine.

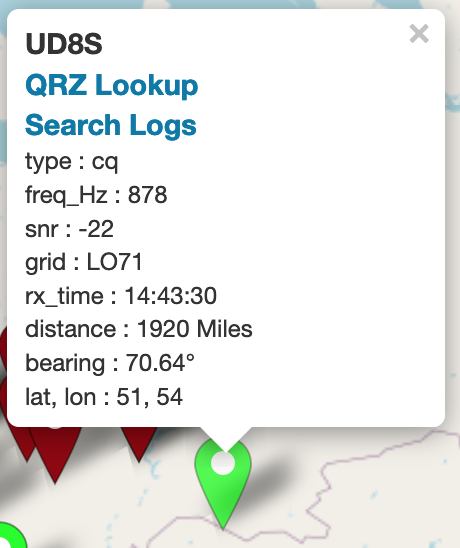
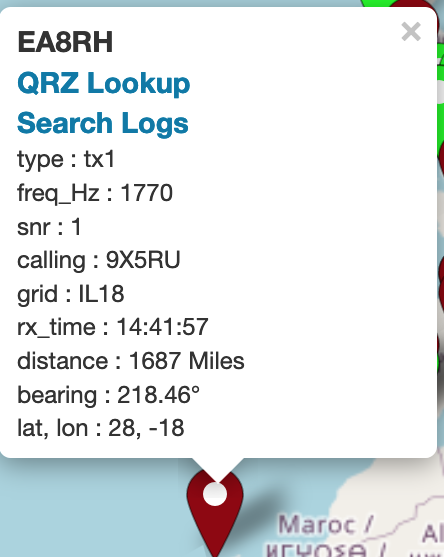
Below is a close up of the popups that are displayed when each icon on the map is clicked. The popups show the information collected from WSJT-X for each station plotted on the map.

Left – Green “CQ” Popup and Right – Red “TX1” in QSO popup

If you fancy trying this out for yourself but, don’t fancy creating all the nodes in the flow manually then I have made an export of the flow available for download. All you have to do is download the file, unzip it and then import it to Node Red and you’ll have everything built ready to play with.


I’ll probably be adding more functionality to this flow as time goes on and will post further articles about it in the future.

More soon …