Living in a rural area we have a very unreliable mains power supply and so I have to protect all the IT equipment in my home lab with an uninterruptible power supply (UPS).
Over the years I’ve found APC UPSs to be super reliable and use them extensively around the house to keep important services running during power outages.
Running a combination of Debian and Ubuntu operating systems on my servers and virtual machines (VMs) I’ve always used the apcupsd daemon to interface with the UPS for automated shutdowns etc.
The apcupsd daemon does have a very simple web interface that can display 3 items of information at a time but, I decided it would be nice to have a view showing all the information on one dashboard.
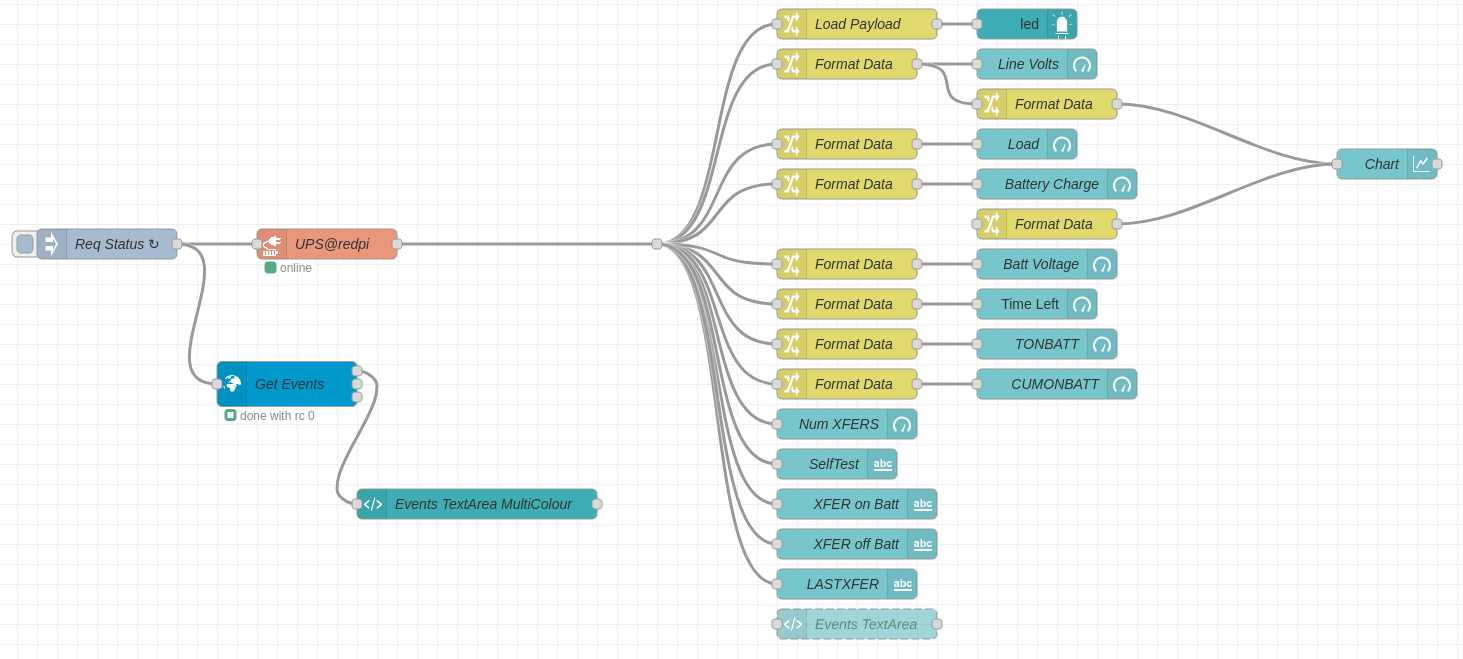
The Node-Red flow is pretty simple and is based around the apcrequest node that connects directly to the apcupsd service on port 3551.
Note: You must configure the apcupsd service as a NIS server in the
/etc/apcupsd/apcupsd.conf config file.
Most of the info is collected via the apcrequest node however, I found that getting the events information via the node to be unreliable and so I used a BigSSH node to connect to the computer to get the UPS events information directly from the log file.
The simple flow collects the data, formats it into a useable format and then passes the data on to the dashboard GUI objects for display, it really is very simple.

The resultant dashboard clearly displays all the information needed including line voltage over time. I was surprised to see such a swing in the incoming voltage but, now understand why I get so many low line voltage and over voltage events on the UPS.
The events log is displayed in a scrolling text area on the dashboard with colour highlighting.
If you’d like to create a dashboard for your APC UPS then the flow can be downloaded below.
More soon …