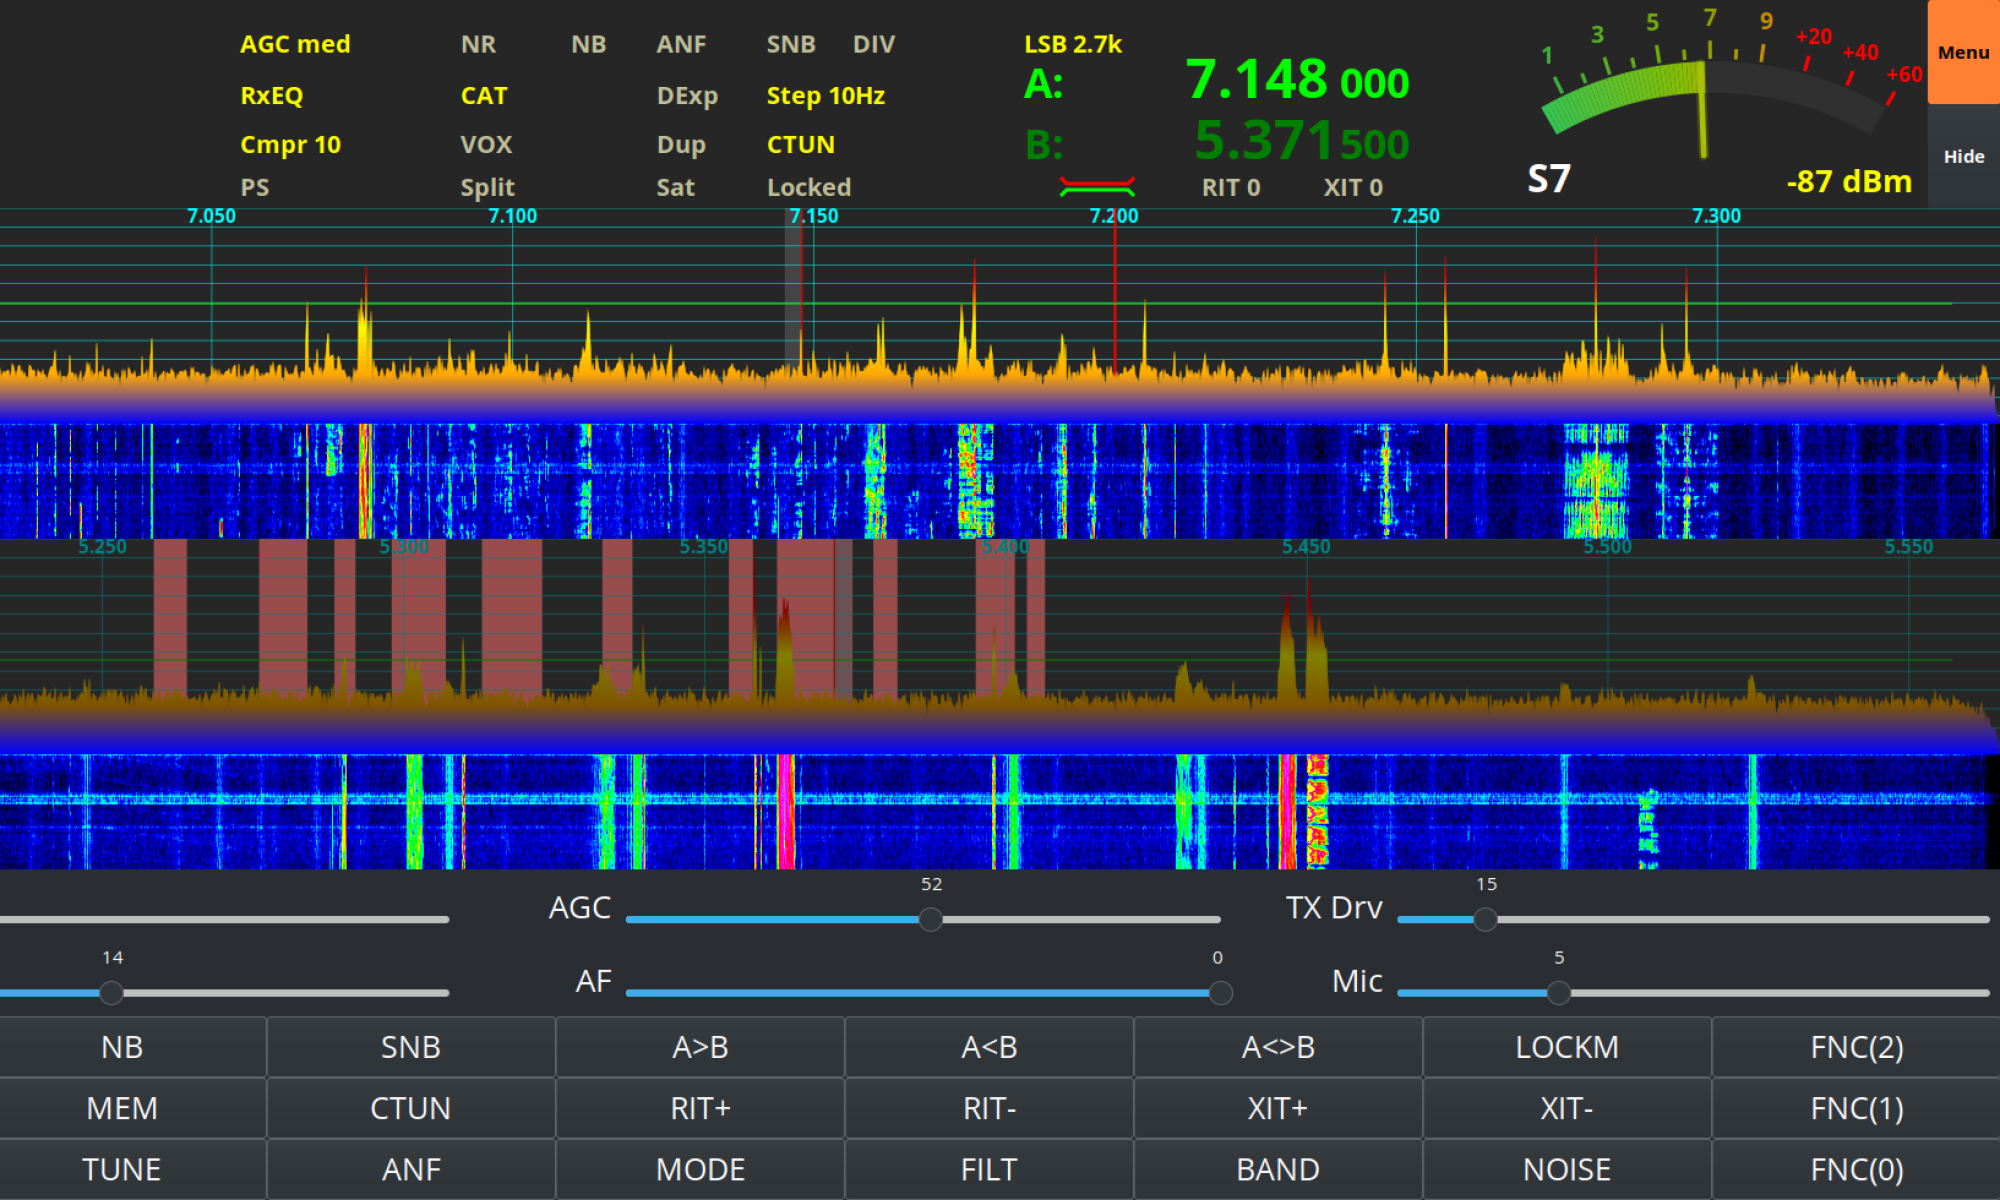
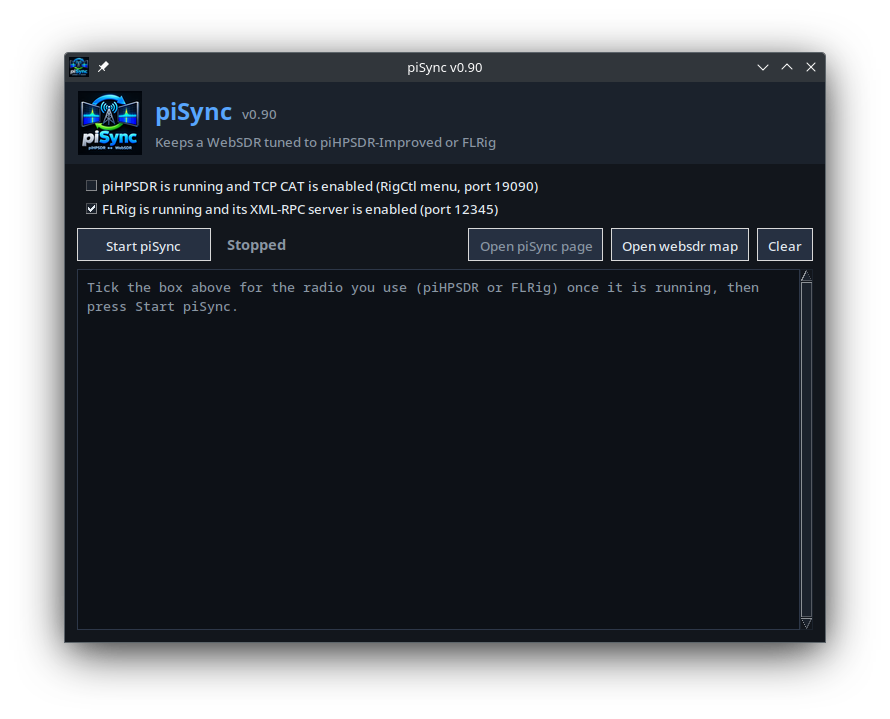
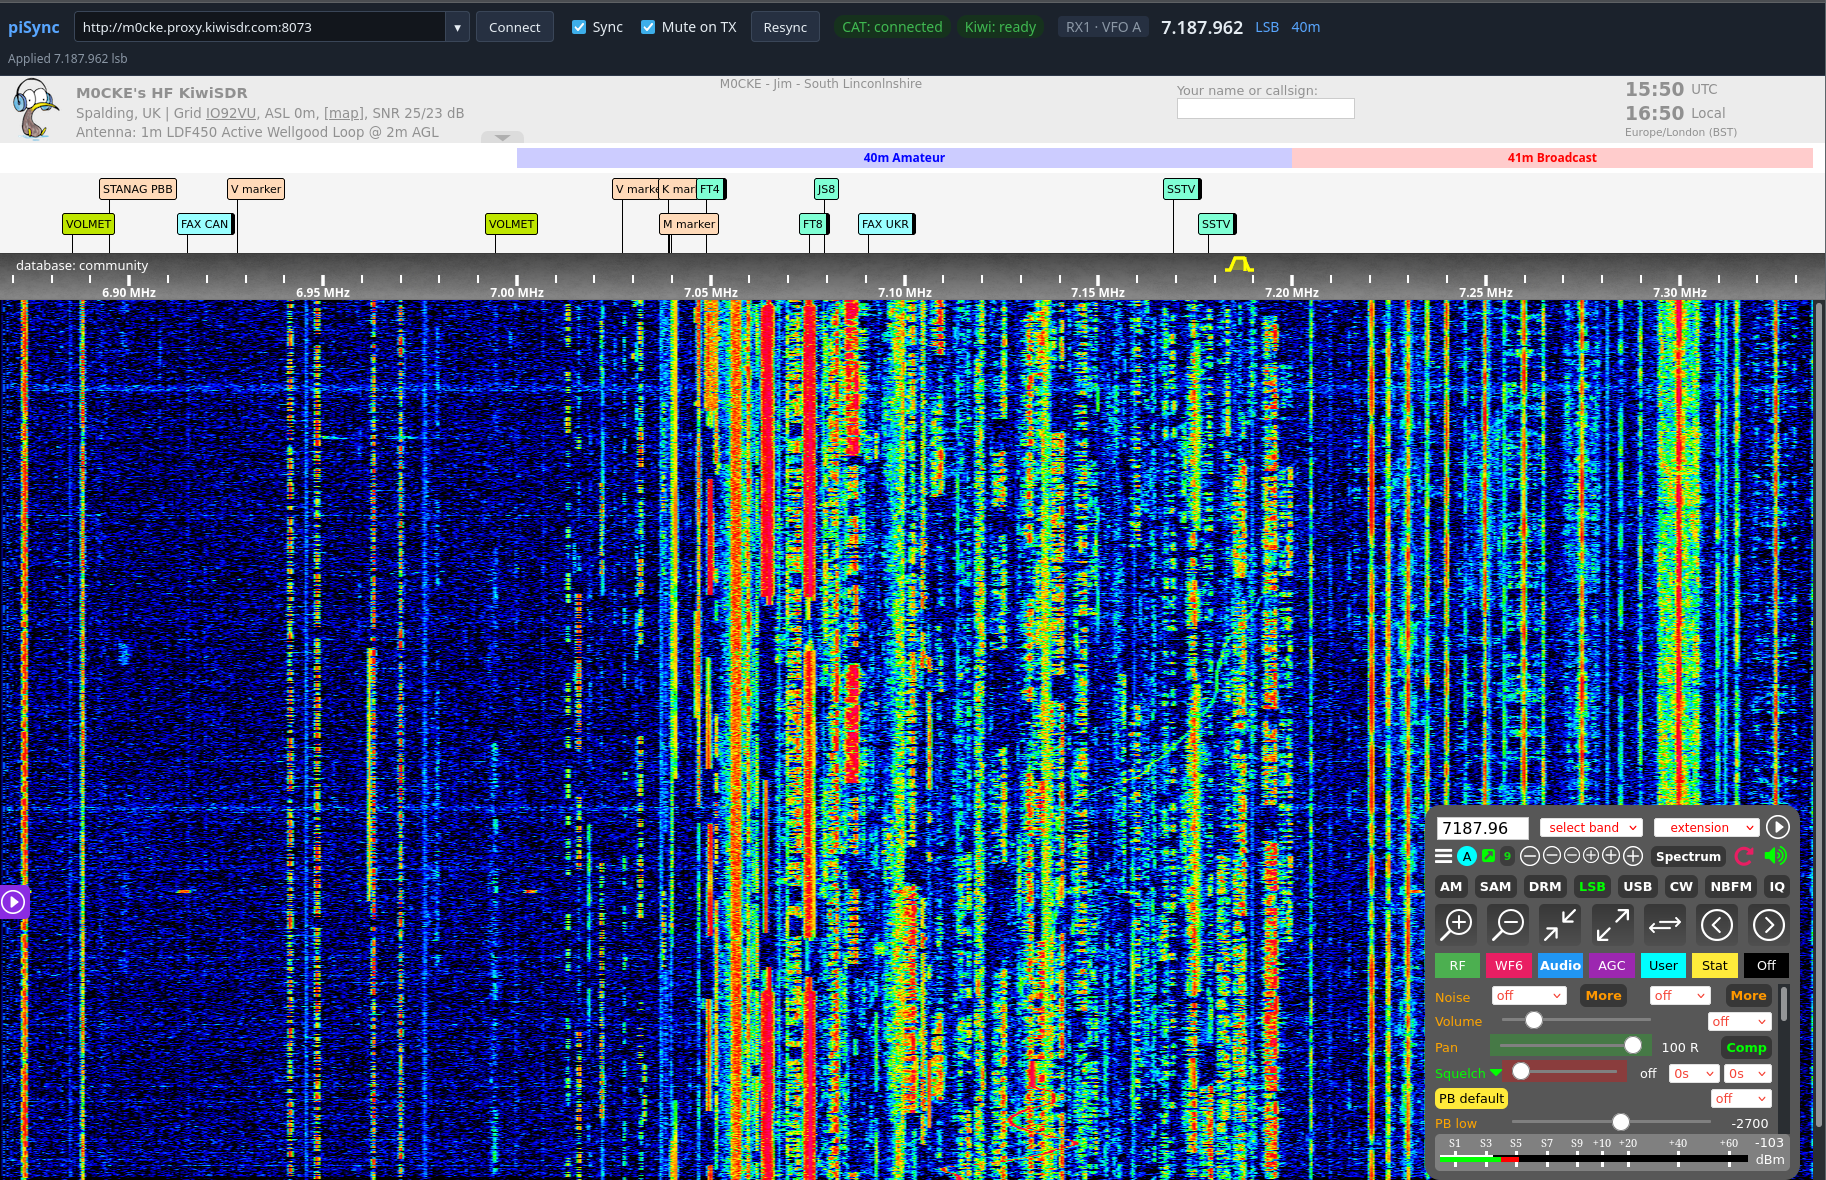
Steve (M0XVT), Alan (G1SQB) and I are pleased to announce piSync v0.9, bringing synchronised WebSDR access to Linux users running piHPSDR-Improved and now, a much wider range of transceivers through FLRig.
Windows users have enjoyed this kind of functionality through applications such as CatSync for some time. To the best of our knowledge, piSync may be the first Linux application to offer an equivalent solution for both piHPSDR-Improved and the huge range of transceivers supported by FLRig.
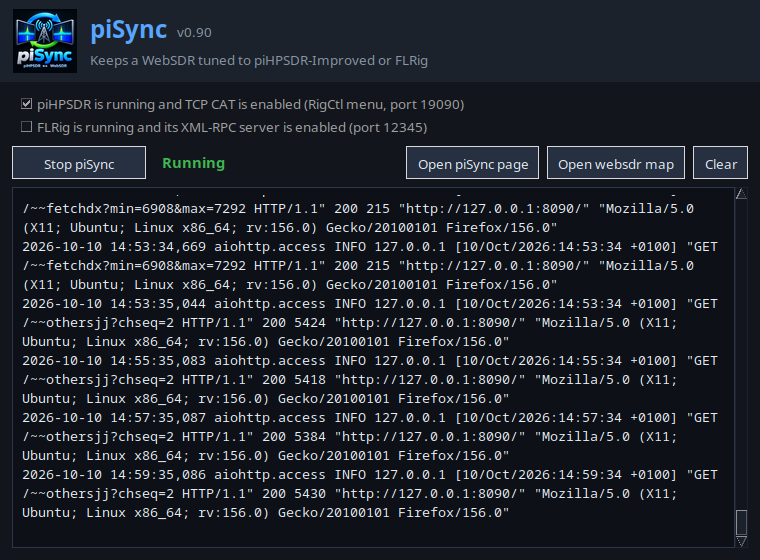
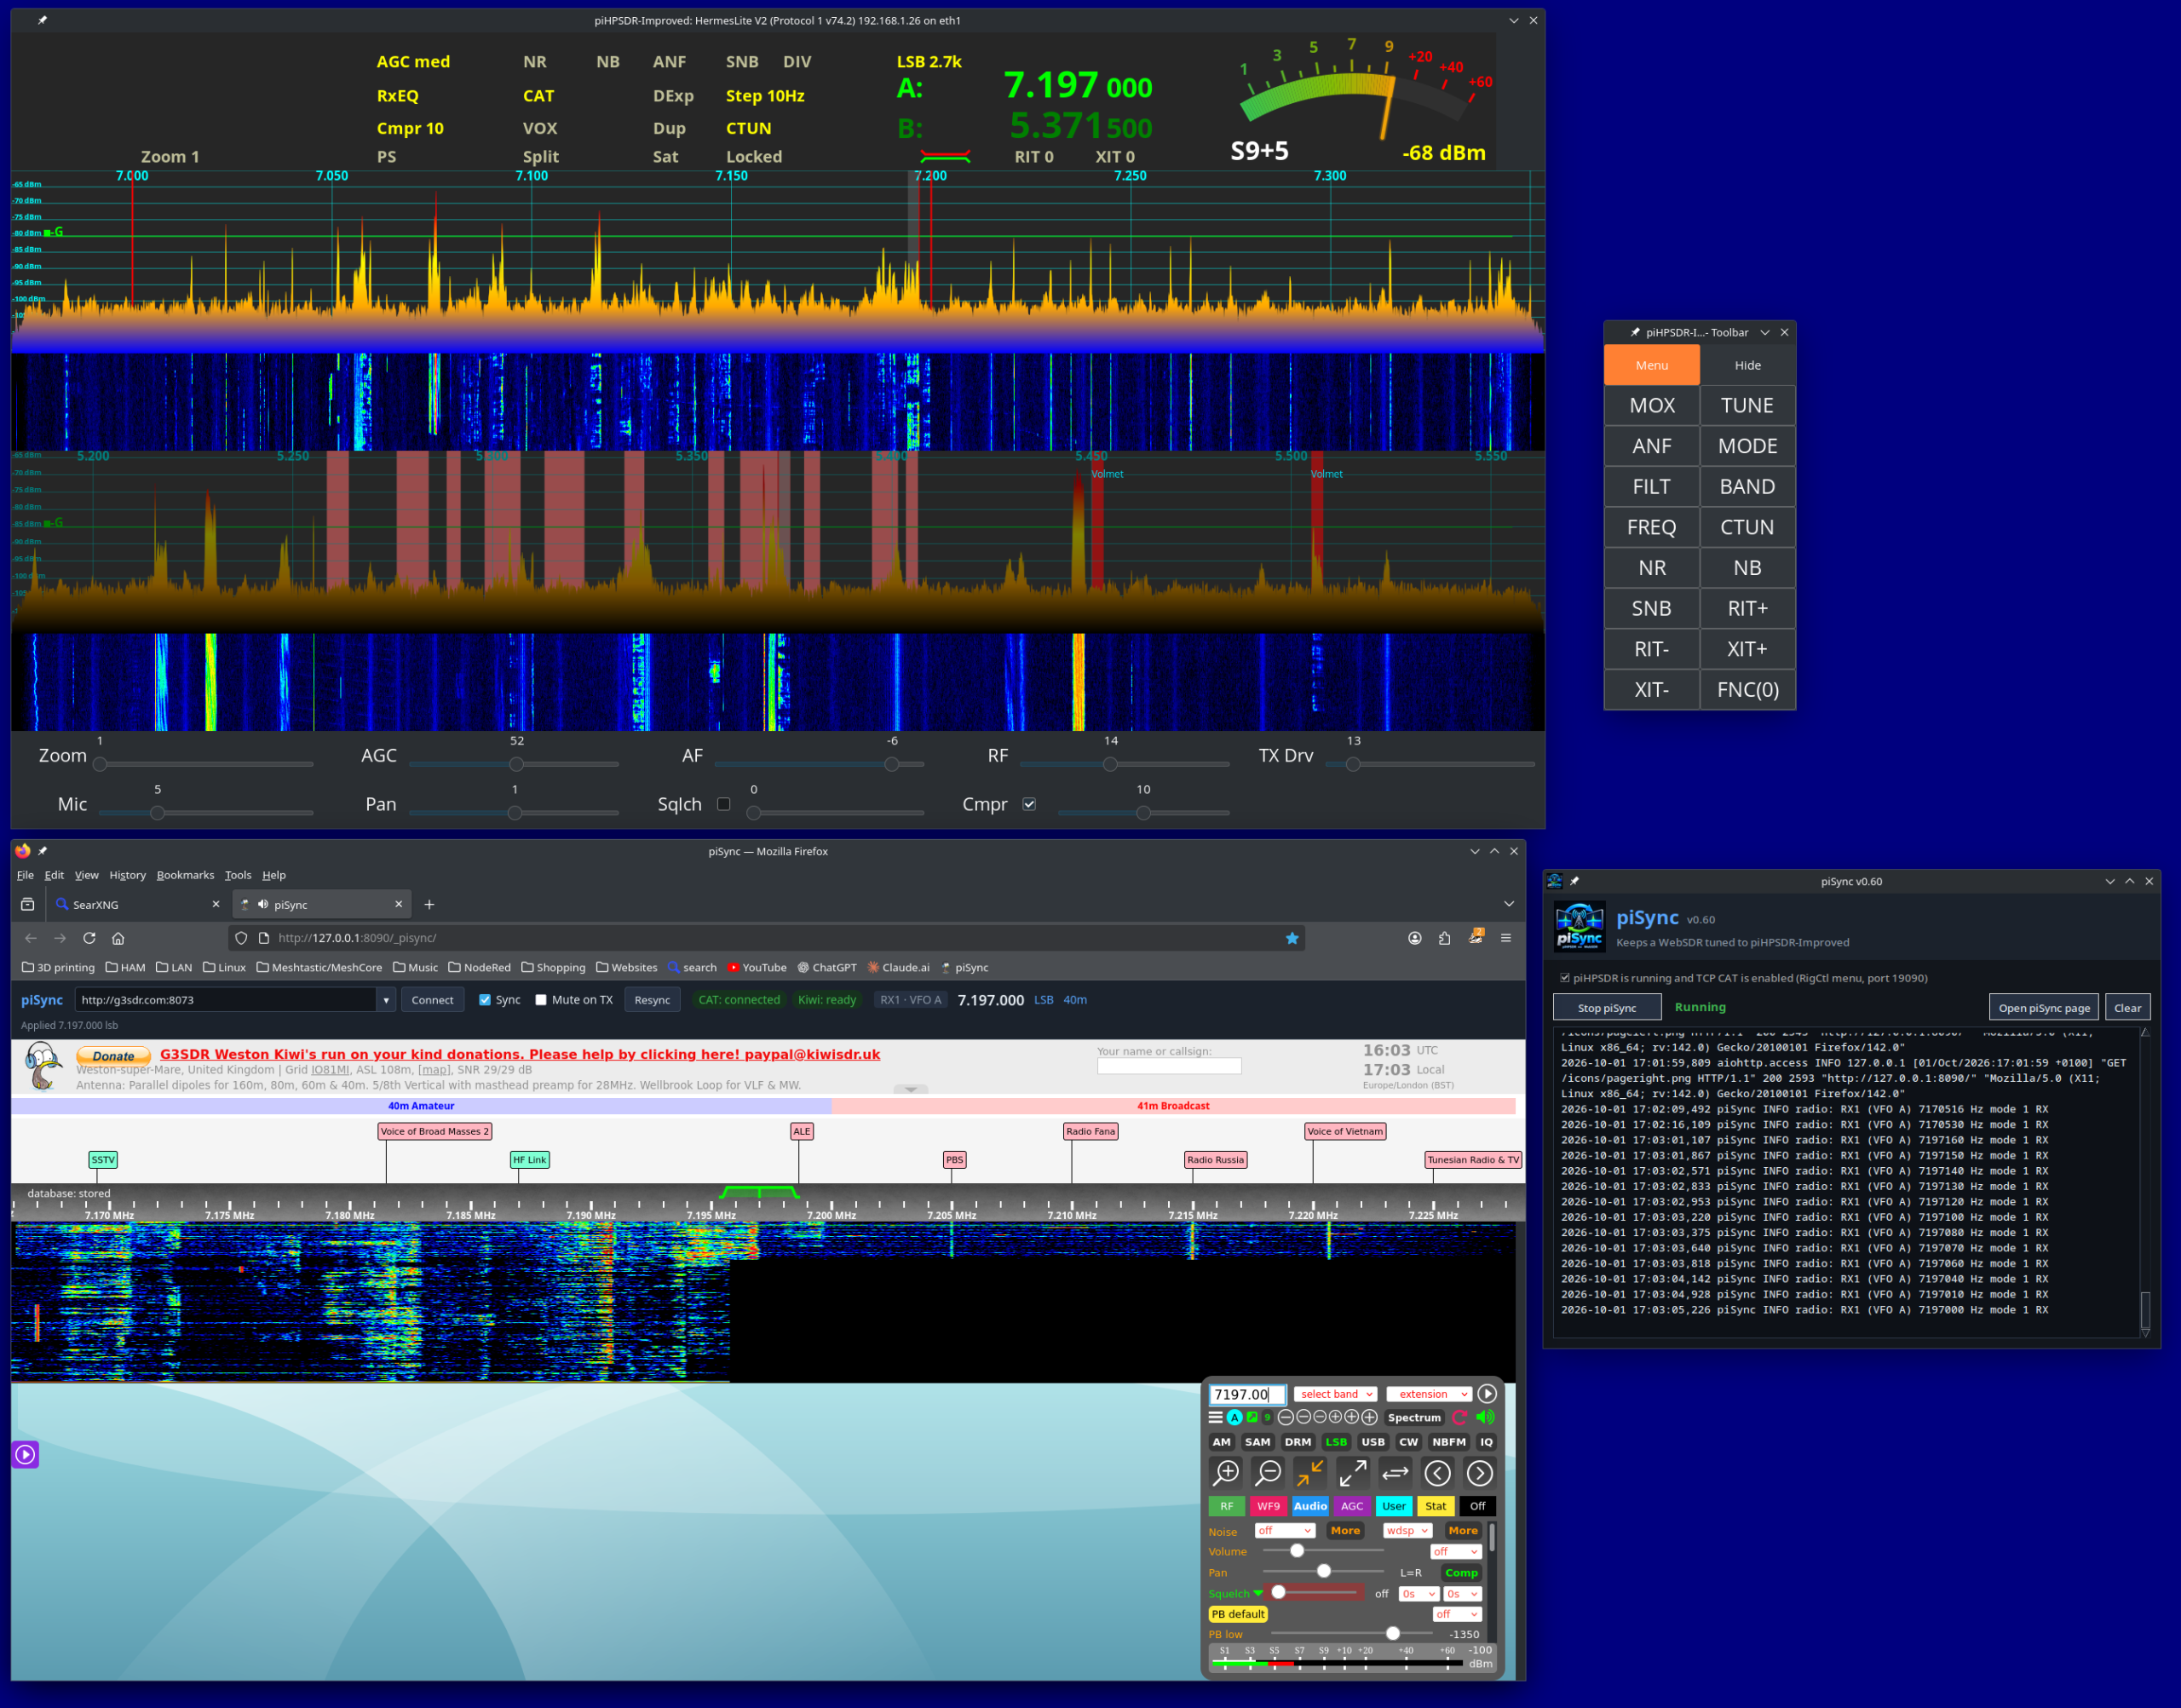
piSync v0.9 with FLRig support
Bringing New Life to Existing Radios
The addition of FLRig support is a significant step forward. piSync can follow your radio’s frequency, operating mode, active VFO and PTT status, allowing a compatible WebSDR receiver to follow you around the bands.
Whether you’re using a modern SDR or a conventional transceiver, piSync opens up new possibilities for exploring propagation and comparing signals received at different locations around the world — without replacing your existing radio.
What’s New in v0.9?
This release also introduces several improvements:
Persistent WebSDR list: Your receiver URLs are now saved on your PC and restored after restarting piSync, rather than being stored in your web browser.
WebSDR map: A new launcher button provides quick access to the WebSDR World Map.
piSync v0.9 – Synchronising WebSDR’s to your Radio.
Easy Installation for Linux Users
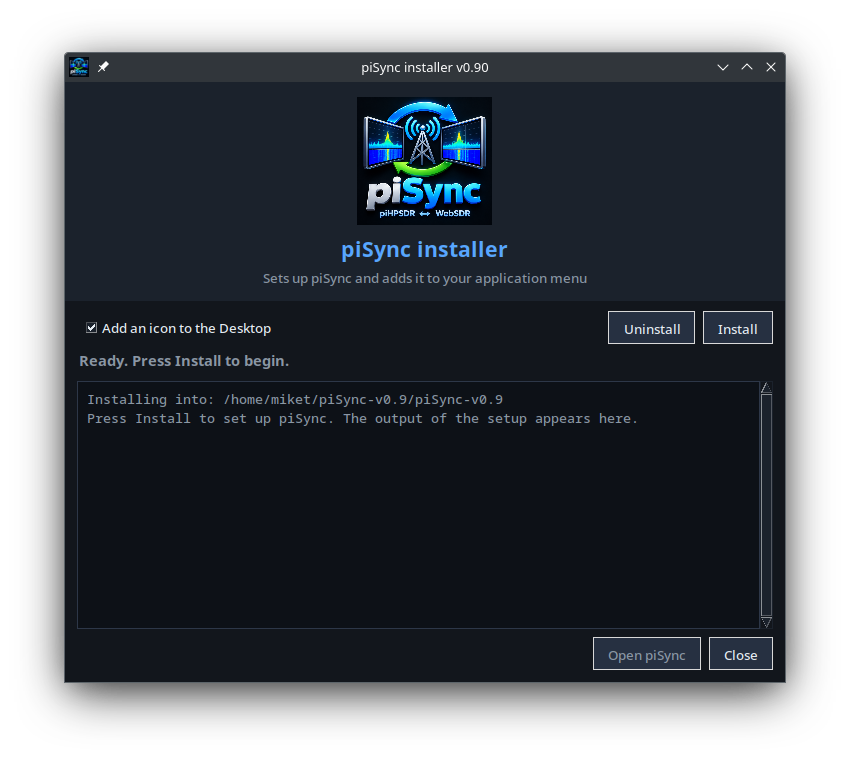
Getting started with piSync is easier than ever, thanks to its new GUI installer. Designed to simplify installation and setup, it makes piSync more accessible to everyone, including amateur radio operators making the move from Windows to Linux.
Alongside the GUI installer developed for piHPSDR-Improved, this is another step towards making Linux a practical and welcoming platform for amateur radio enthusiasts.
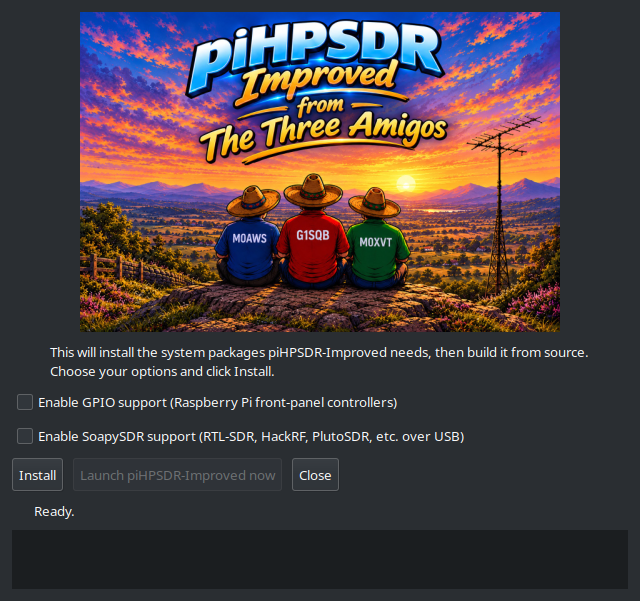
piSync GUI Installer – One Double Click and it’s ready to use.
We’ve Kicked the Tyres, So You Can Hit the Airwaves!
piSync has been tested on Raspberry Pi, Kubuntu (KDE Plasma), Linux Mint (Cinnamon), Debian 13 (Trixie) and Ubuntu. While we can’t test every Linux distribution, it should work on most Debian and Ubuntu based systems. We’ve done the testing so you can spend less time setting up and more time enjoying your radio!
Get piSync
If you’re a Linux-based amateur radio operator, whether using piHPSDR-Improved or a transceiver supported by FLRig, piSync is worth a look.
Synchronised WebSDR access, on Linux, using the radio you already own.
It’s been a busy week of software bug fixes and enhancements on piHPSDR-Improved and piSync.
piSync v0.9 is currently in test after we added the support for FLRig. This extends the support for many transceivers new and old along side piHPSDR-Improved and makes it useful to HAMs who aren’t using SDR’s.
piSync v0.9 with FLRig support in test
piHPSDR-Improved has also had a lot of work done to it this week with a splurge of bug fixes and enhancements being made. We decided to bring the release forward as we can then concentrate on writing the new modules to bring even more functionality to the SDR solution.
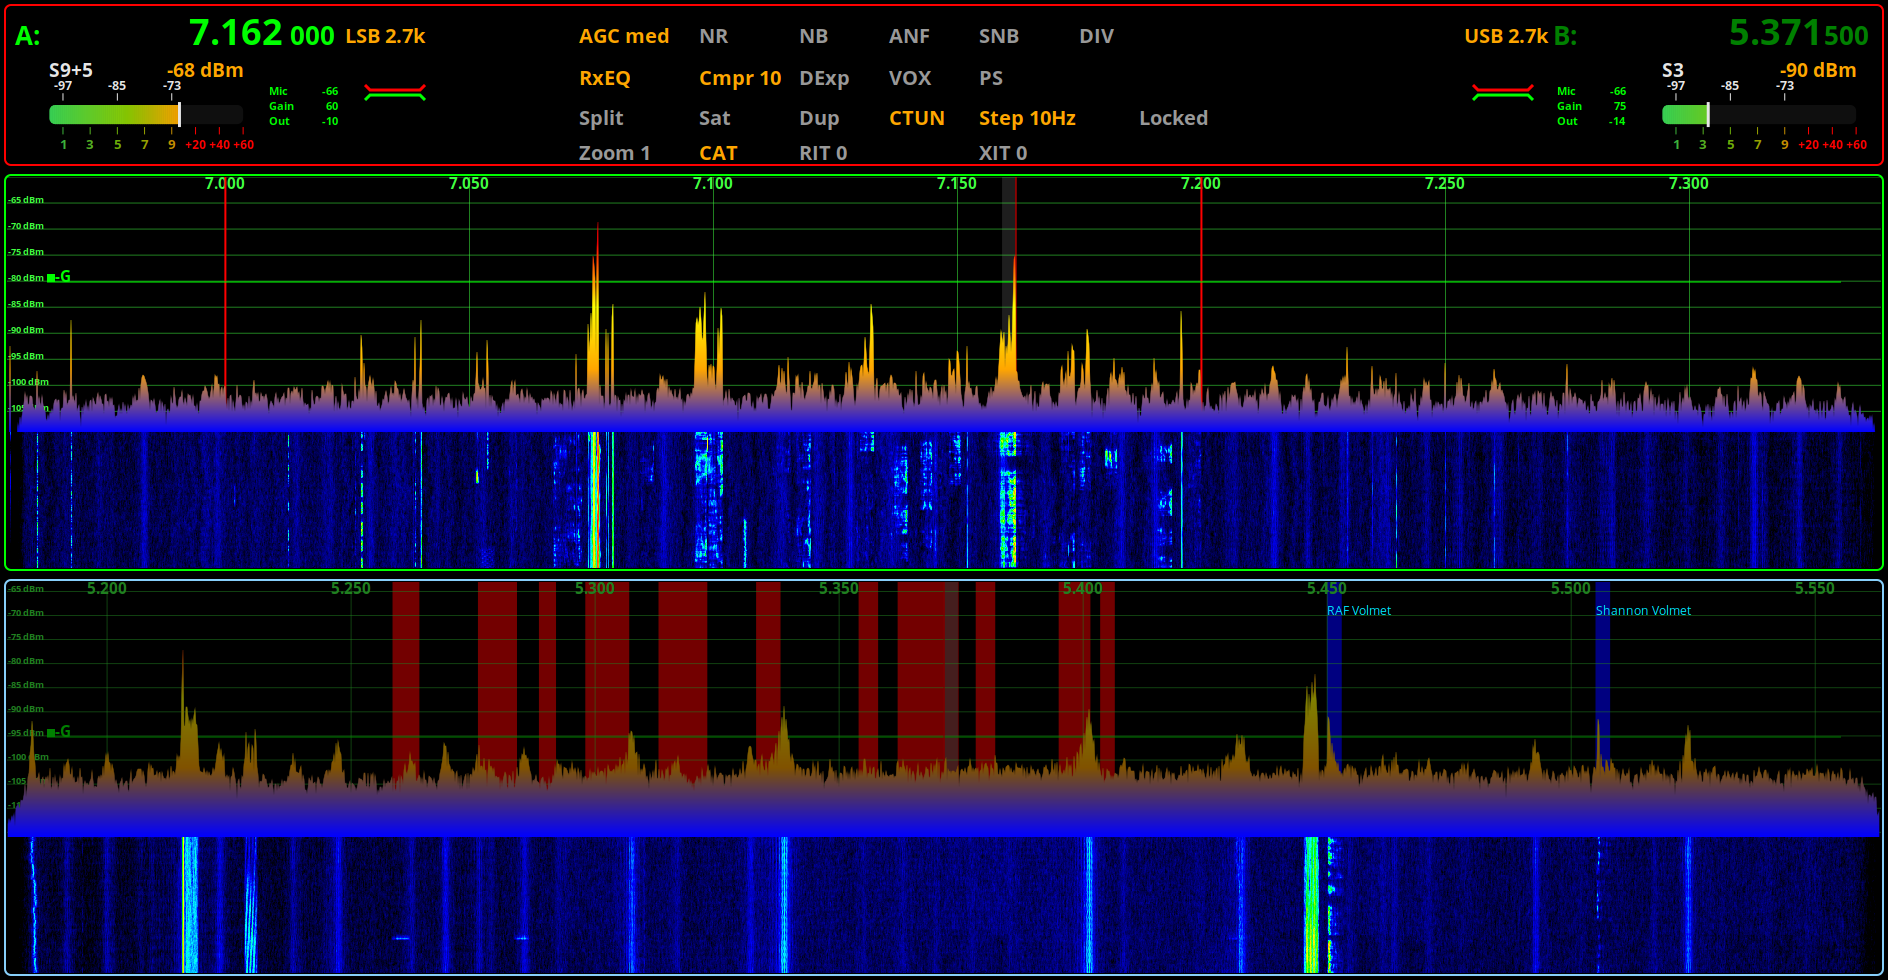
piHPSDR-Improved v2.45 in Test
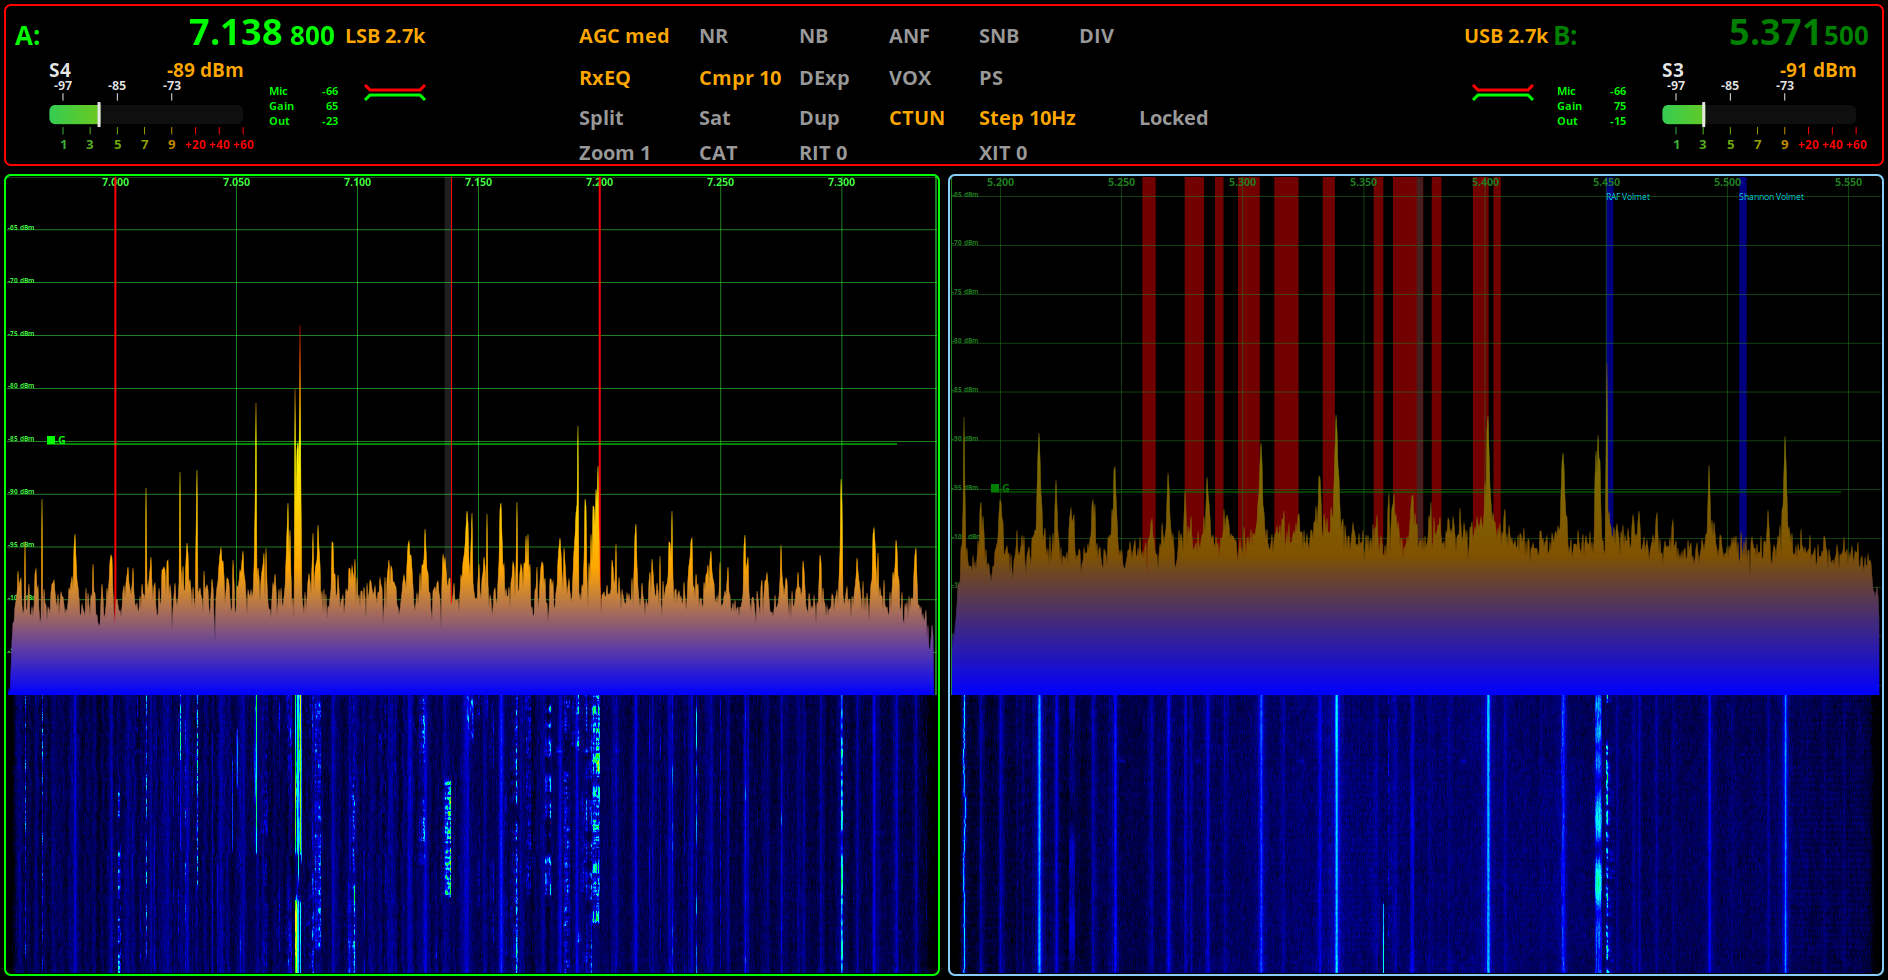
We’ve put some effort into tidying up the user interface in piHPSDR-Improved along with the new, second S Meter for VFOB. This is a really nice enhancement we’ve been wanting to do for some time but, haven’t had the time to devote to it until now.
piHPSDR-Improved v2.45 in test with Horizontally stacked RX
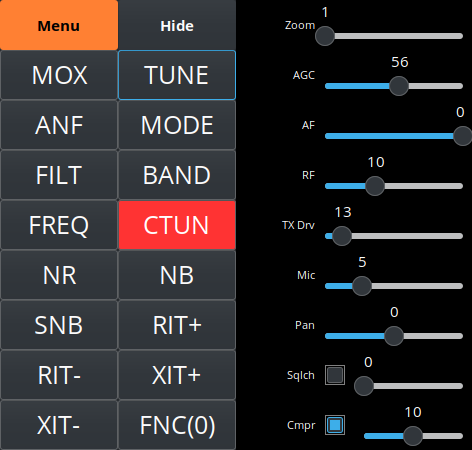
The floating toolbar has also had some upgrades and is not only looking good but, we’ve added new functionality to it as well.
piHPSDR-Improved v2.45 Floating Toolbar in Test
We’re hoping to release both of these updated software packages very soon once we’ve completed all our testing and are happy that’s it ready for release.
piHPSDR-Improved Logo from The Three Amigos Development Team
For some time now Steve (M0XVT), Alan (G1SQB) and I have been working on a version of piHPSDR to use with our Hermes Lite 2, Anan 200D, Adalm Pluto, Pluto+ and LibreSDR transceivers. The biggest problem we’ve had is the constantly changing code on github that often would stop the software from working on one device or more each time we updated and then we’d have to spend hours finding the issue and fixing it.
Eventually we got tired of this and decided to build our own stable version that doesn’t get anything from github and is made up of all the parts necessary to create a version that just works on the devices that we use on a daily basis.
Using piHPSDR on the QO-100 satellite and the HF bands across a number of very different types of hardware is a challenge in itself, especially when the devices use different protocols and only certain library sets work with certain firmware on some devices, the combinations get complicated to say the least.
To differentiate our build of piHPSDR from all the others available on the internet today we decided to call it piHPSDR-Improved.
So what is piHPSDR-Improved?
piHPSDR-Improved is a version of piHPSDR that has the fixes and enhancements in it that we’ve dreamt of having over the last couple of years. Some of the fixes are simple things like being able to detach the toolbar from the main window thus giving more space for the two panadapter/waterfall displays and have all the toolbar buttons on another screen in a floating toolbar. Other enhancements were more involved and addressed some of the most annoying issues like none of the settings for VFOB (RX2) were saved and so, every time you started the program you had to setup the RX2 all over again from scratch. These sound like simple fixes but, believe me, they’re not.
Another thing we wanted to do was make piHPSDR-Improved easy to install. Many Windows users transitioning from Windows to Linux often regret it the moment they have to use the Linux command line to install piHPSDR.
We’ve committed to having GUI installers for all the applications that we develop and release, regardless of how much extra work this entails.
It’s time installing software on Linux desktop PCs was as easy as it has been on Windows PCs for decades.
piHPSDR-Improved GUI Installer
We’ve taken a modular approach to building piHPSDR-improved. Rather than putting everything into the one application, we’re going to be releasing add on modules that will bring new functionality over time. This way we can build on a structured, stable base keeping everything operational all of the time.
The first module we’re releasing is piSync and we’ve included it in the zip file that you’ll download to install piHPSDR-Improved.
piSync Logo
piSync adds functionality to piHPSDR-Improved that Windows Thetis users have had for a long time, namely the ability to use an online WebSDR along side their own SDR transceiver and have it track the frequency, band and mode automatically. This functionality has proven to be incredibly useful when you are struggling to hear a weak DX or QRP station.
With piSync you can now use an online WebSDR receiver closer to the DX station to aid getting that QSO in the log. It’s like having another receiver in your radio that is located anywhere in the world, for free!
We believe this is a first for the Linux platform and we’re really pleased to be able to share it with the Linux community.
We’ve had great fun with piSync during testing and we think you’re all going to find it extremely useful too.
We’re also planning on adding support for FLRig in the next version of piSync so that you’ll be able to use a WebSDR with any transceiver that is supported by FLRig.
Of course it goes without saying, all of our software is Opensource. When you download and install piHPSDR-Improved or any of the new modules you will get the full source code every time and be free to do whatever you like with it. Every module will also have it’s own GUI installer, no more command line, just double click and go.
Both piHPSDR-Improved and piSync have been tested on RaspberryPi 5/500+, Linuxmint Cinnamon, Kubuntu, Debian 12 (Bookworm) and Debian 13 (Trixie) so, we’re pretty confident it’ll work on most Debian/Ubuntu based Linux distro’s on Intel/AMD PCs and the current versions of the RaspberryPi SBCs.
piHPSDR-Improved, piSync and a WebSDR running on a pi 500+
Inside the zip file you’ll find a file called README.1st, do make sure you read this before installing any of the software as it contains some important information that’ll make installation as easy as possible.
To download both piHPSDR-Improved and piSync in an easy to use zip file, just click the Download button below.
We’ve got lots of ideas for new features, modules and bug fixes (Yes there are still some bugs in there!) which we will be releasing over time. Don’t expect this to happen overnight as Steve still works full time and Alan and I are both enjoying our retirement.
This is just another facet of our hobby and we don’t like to rush things. We do like to use our radios on air, pretty much daily and so we do this software development in between all the other fun things that Amateur Radio has to offer.
To be clear and open we do use Claude Code to help with development. I go through as much of the code as I can without spending days and days just reading code. I am retired after all and have spent enough of my life professionally writing and debugging both my own code and other people’s code. We do a lot of testing on a good number of Linux distros before we even consider releasing the software to the wider world and use it on air as part of the testing process, so we’ve done as much as we can to ensure we’ve not introduced new bugs to the software. Keep in mind we do this as part of our Amateur Radio hobby and so, it needs to be fun and enjoyable.
We hope you enjoy using the software and find it useful. If you’ve got ideas for new things you’d like to see in future versions then please feel free to contact any of us via our contact details on QRZ.
UPDATE: We’ve fixed a little bug in piSync and released an updated version. You can download it from this article.
I’ve recently built a new AllStarLink (ASL) node for my MB7IBW gateway that I have recently brought up on air on the 2m band.
AllStarLink 3 has a lot of changes in it when compared to the previous version and this of course impacts my Node-Red Control Dashboard that I’ve been using to manage my first ASL node for well over a year now.
To build the node I used the RaspberryPi imager and added the AllStarlink 3 image as detailed on the allstarlink.org website.
Installing the system this way makes it pretty easy compared to previous installs but, it comes with some quirks which cause issues with Node-Red.
From the outset the plan has always been to have AllStartLink 3 and Node-Red running on the same Pi4 to keep it totally self contained. This was easy enough to achieve and works without issue.
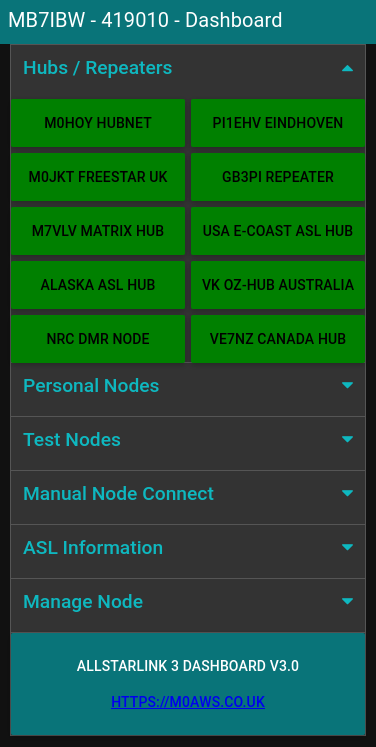
Node-Red Control Dashboard for AllStarLink 3
Installing Node-Red onto a Pi4 is really easy and is fully documented on the Node-Red Website.
Once the AllStarLink 3 operating system was installed on my SD card, booted and operational I installed Node-Red. I soon realised that there were a few things I had to do before loading the Node-Red flow.
AllStarLink 3 no longer logs connect and disconnect messages in the connectlog like it did in AllStarLink 2. To get logging working again I had to create two new BASH scripts as detailed below and put them into /etc/asterisk/myscripts.
For the connect information I created the BASH script as detailed below.
Next I disabled the temporary filesystems that are used by default for the apache and asterisk logging as it’s useful to keep the apache logs for debugging and I needed the asterisk logs for the Node-Red dashboard.
Disabling the temporary file system is very easy to do, just edit the /etc/fstab and comment out the two lines as shown below.
# Comment out the next line for persistent Apache logs
#tmpfs  /var/log/apache2        tmpfs   defaults,noatime,nosuid,nodev,noexec,mode=0775,size=32M 0 0

# Comment out the next line for persistent Asterisk logs
#tmpfs  /var/log/asterisk       tmpfs   defaults,noatime,nosuid,nodev,noexec,mode=0775,size=32M,uid=102,gid=106 0 0

# Note: These lines are wrapped, should be on 1 line in the /etc/fstab
Once the entries in the /etc/fstab were commented out I rebooted the Pi4 to get persistent filesystems.
The final thing that had to be done was to allow user repeater to use sudo without a password so that it could be used to perform reboot/shutdown/process restart as user root from within the dashboard.
# /etc/sudoers

# Allow repeater sudo without password
repeater ALL=(ALL) NOPASSWD: ALL
Once this was all done I imported the Node-Red flow, configured the SSH nodes with login credentials for the Pi4 (important to use the user repeater for SSH), clicked deploy and the dashboard was ready for use.
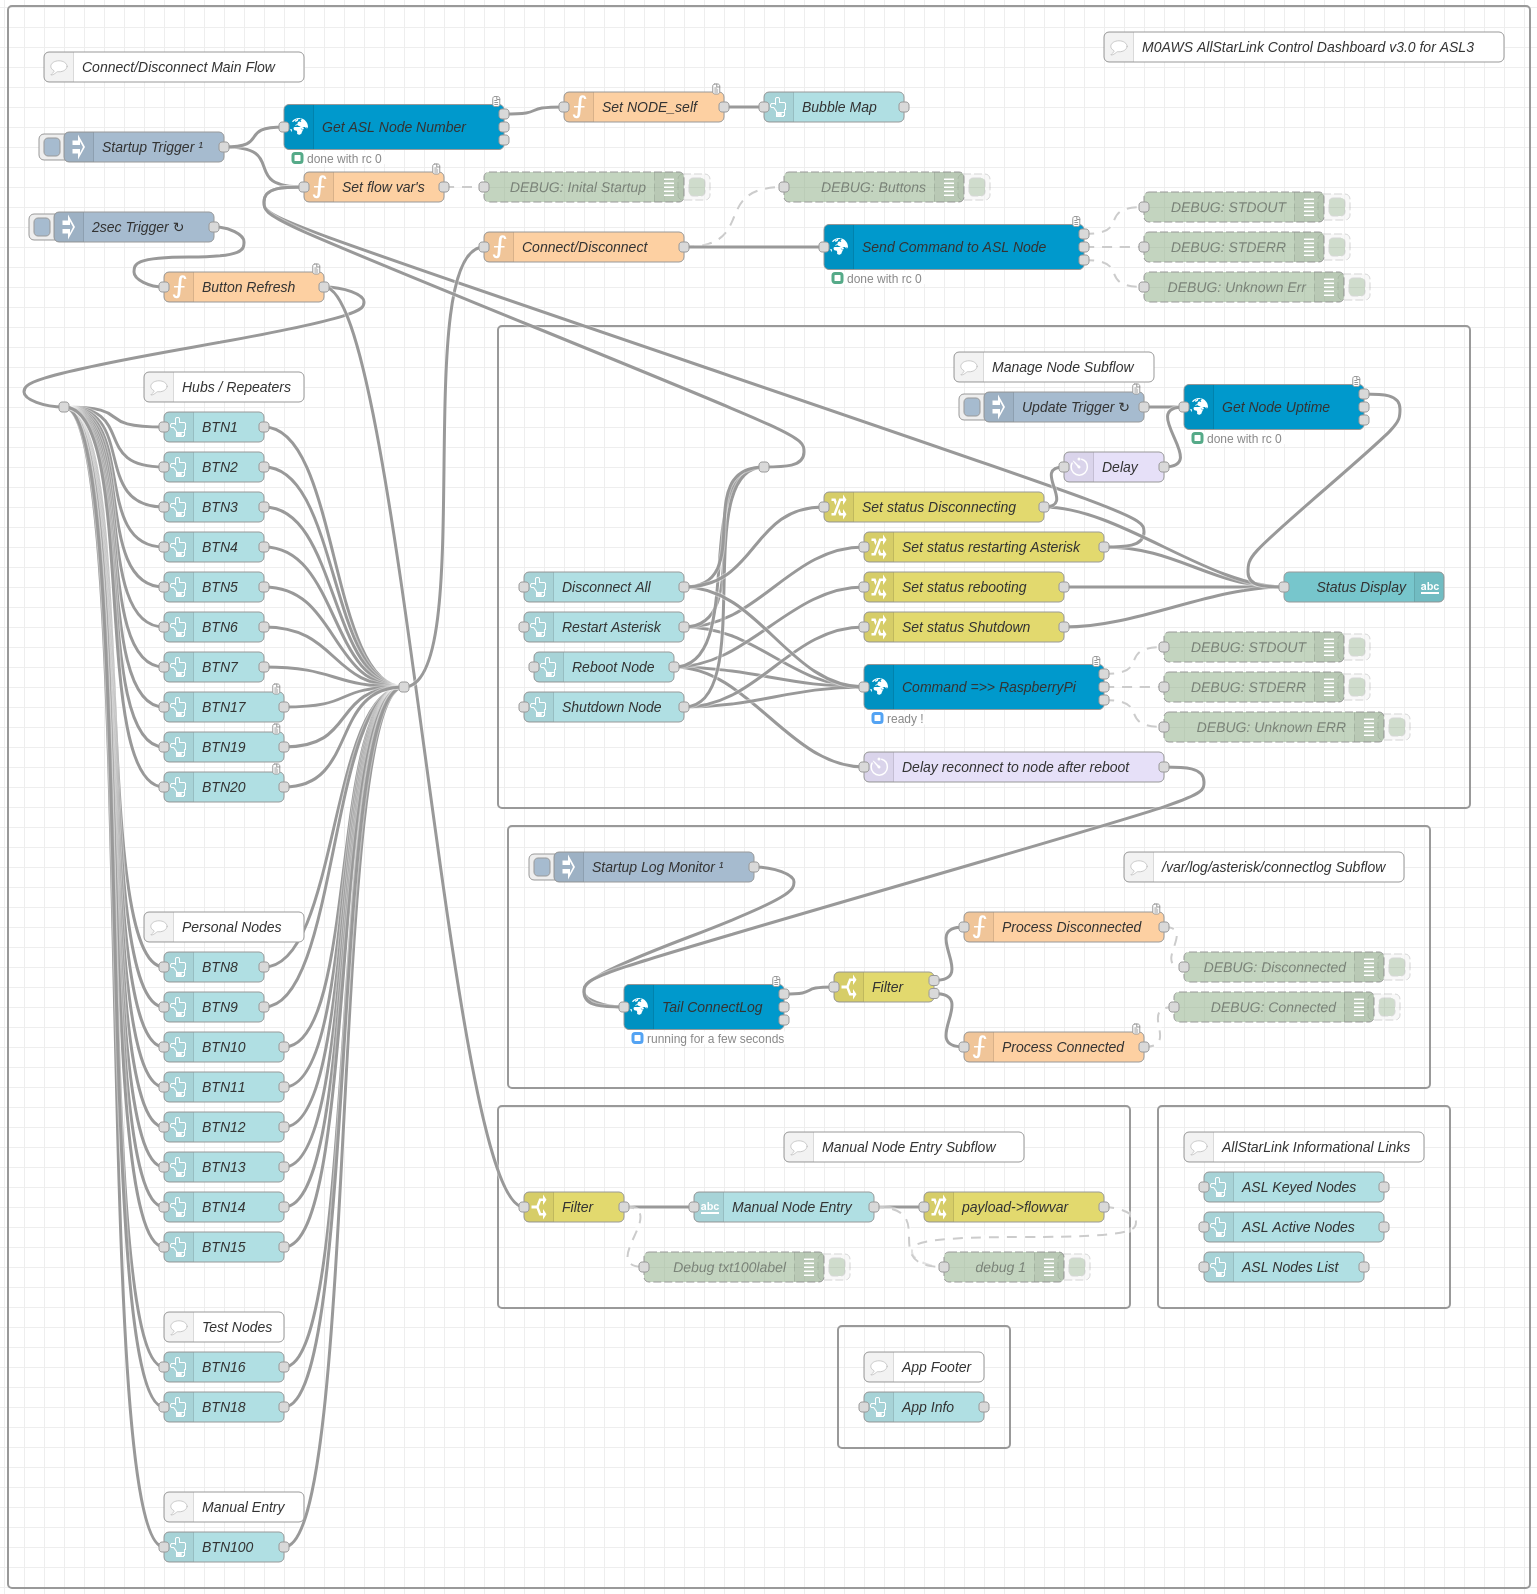
Node Red AllStarLink3 Control Dashboard Flow
I’ve been using the dashboard for a few weeks now and it’s running perfectly, without error.
If you want to build your own Node-Red Control Dashboard for your AllStarLink 3 node then, just download the flow using the button below and import it into your flow editor.
I’ve spent some time this afternoon modifying my Node-Red Dashboard for controlling AllStarLink nodes to work with the new AllStarLink version 3.
My original AllStarLink Control Dashboard was designed to work with AllStarLink 2 which I have running on an old RaspberryPi 3b on the 70cm band. The dashboard has worked reliably ever since deployment and is in use daily.
With the release of AllStarLink 3 and all the changes that it entails I’ve had to make a few changes to the dashboard flows in order to make it compatible with AllStarLink 3 nodes.
This entails not only flow changes but also the addition of two new bash scripts that are called by Asterisk to log connect and disconnect messages as they are not logged by default any more. (Seems a bit of a step backwards)
Node-Red AllStarLink Control Dashboard v3.0 for ASL3
The changes also entail disabling the temporary filesystems used by default in the new ASL3 build so that log files etc become persistent.
I’ll spend some time using the new dashboard to ensure it’s working correctly and then will release it into the wild for all those that are brave enough to move over to AllStarLink 3.
Following on from my previous article on using Node-Red to build interactive log maps I’ve now reworked the flow to make it more efficient with less Javascript.
The original flow had a function that handled the issue of FT4 contacts being recorded in two different ways depending on which app you use for your FT4/8 operations.
<mode:4>MFSK <submode:3>FT4
or
<mode:8>MFSK FT4
The code I wrote to handle this wasn’t particularly elegant and so I decided to remove the code entirely and just use a simple change node.
M0AWS New node to handle FT4 more efficiently
This is the great thing about Node-Red, there’s always more than one way to do something.
With this fix in place and the old code stripped out of the format generic payload function, the new flow is much tidier and easier to comprehend.
M0AWs Updated ADI Log Map flow
With testing complete and the two maps now live on my website the flow is finally ready for release into the wild.
If you fancy presenting your ADIF logs in a more visual, interactive format then just download the flow below and import it into your Node-Red flow editor.
Don’t forget that you will need to change the path to the log files in the file read nodes to suit your setup and change the location data in the My QTH trigger to match your callsign and location. Other than this the flow should just work.
I’ve not been on the radio much over the last few weeks as I’ve had my head down other radio related rabbit holes.
One of the rabbit holes is a Node-Red project to make my online logs a little more interactive. For sometime now my logs have been displayed on my website as nicely formatted, searchable HTML pages however, they don’t really allow the viewer (myself included) to see the global coverage of all the contacts so, I decided to write a Node-Red flow that would do just that.
M0AWS Interactive Log Flow
The flow itself isn’t too complicated and basically consists of reading in the individual ADIF formatted log files, processing the data and then sending the data in the correct format to the map node for display.
I’ve had to write a few functions to handle the processing of the ADIF formatted data but, these aren’t particularly complex and are fairly easy to understand even if like me, you’re not a Javascript programmer.
The flow is working perfectly however, I’m in the process of reworking the format generic payload function to reduce the amount of code and make it more efficient.
M0AWS SSB / CW / FreeDV Interactive Log World Map
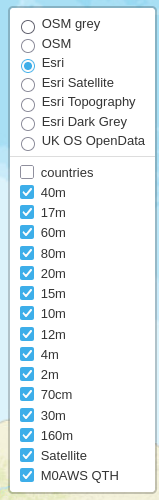
M0AWS Interactive Log Map Layers Menu
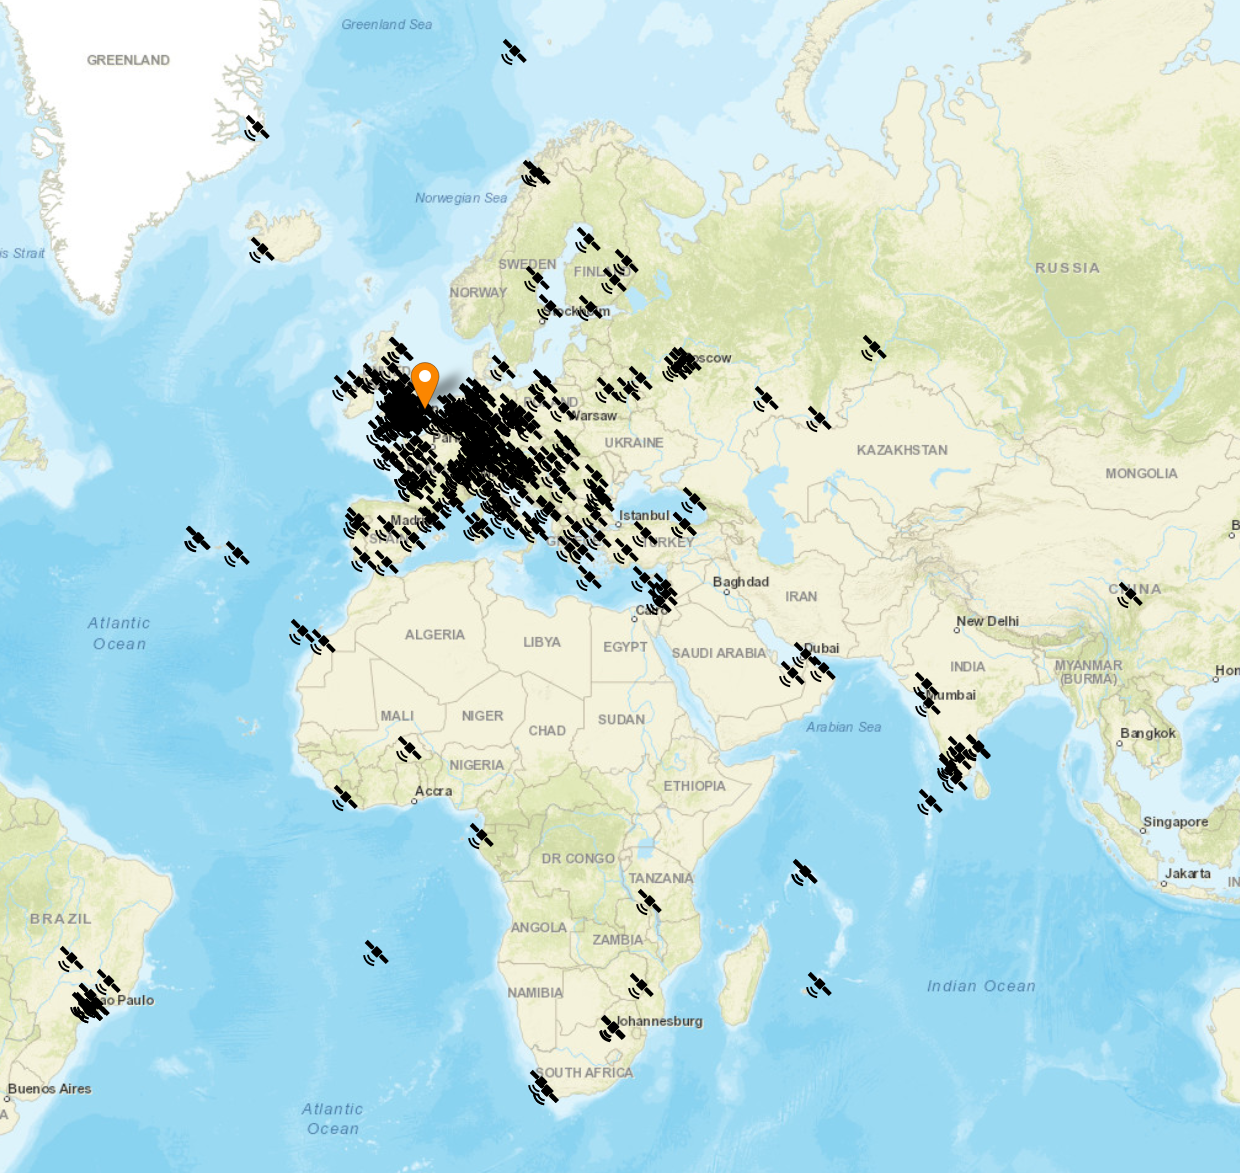
The flow generates two maps, one for voice / CW /Satellite contacts and the other for WSJT-X FT4/8 contacts. Every pin on the map is colour coded by band with satellite contacts being denoted by a satellite icon.
Each pin / icon on the map is clickable and reveals the data of the QSO being displayed.
In the top right-hand corner of the map there is a drop down layermenu that allows the viewer to filter by band thus reducing the number of icons on the screen at any one time.
Seeing the data presented on a map really brings my logs alive. An example of this is that I had no idea I’d worked so many stations in India on the QO-100 Satellite.
The small icons in the pins show a microphone for SSB/FM/FreeDV contacts and a downwards pointing triangle in a box for CW contacts. Sadly I couldn’t find a Morse key icon in the collection available.
M0AWS filtered view of QO-100 Satellite contacts
I only use FT4/8 for testing new antenna designs however, it’s interesting to see the global coverage accomplished with this weak signal mode.
M0AWS WSJT-X FT4/8 Interactive Log World Map
Once I’ve finished rewriting the format generic payload function I will make the flow available for download here so that others can also create an interactive view of their radio logs.
If you want to have a look at the maps and try them out for yourself, they are available under the Logs menu above.
This Node-Red instance is running in a virtual machine (VM) on a 16GB RAM RaspberryPi 5 that is also running a number of other VMs at the same time so, it’s safe to say it’s not heavy on CPU and will run on the older Pi4 as well.
RaspberryPi computers are now moving into the realm of being powerful enough to replace the traditional desktop PC. My most recent purchase, a RaspberryPi 500+ is proof of this as it has been my daily desktop PC since it’s arrival.
One of the things I use heavily are virtual machines. They’re great for developing, prototyping and running new services. With the ability to snapshot, rollback and backup in an instant, virtualisation helps to reduce the development and test time for many of the programs and services that I’m playing with.
With RaspberryPi computers now supporting 16GB of RAM and M.2 SSD drives there is no reason for not taking advantage of virtualisation.
To this end I decided to test running some virtualised loads on my new 500+ with the plan to deploy to 16GB Pi5’s with SSD drives in place of more expensive Intel based computers.
On my Intel based machines I use QEMU, KVM and Virt-Manager to manage the multitude of virtual machines (VMs) I have running here. Since this is a solid, high performance platform for running VMs I decided to take the same route on the 500+
Installing the necessary packages is extremely simple, just one simple apt command:
# Main ethernet
# Setup Bridge called br1 on eth0
allow-hotplug eth0
iface eth0 inet manual
auto br1
iface br1 inet static
address 192.168.0.100
network 192.168.0.0
netmask 255.255.255.0
broadcast 192.168.0.255
gateway 192.168.0.1
dns-nameservers 192.168.0.5
bridge_ports eth0
bridge_stp off
#
#
Once this is done reboot your RaspberryPi and check you have access to your local LAN and of course the internet. You will now also inherit the two new groups that you added yourself to above.
Note: If you are using NetworkManager open the network settings app and create a bridge on eth0. You can also use the nmtui copmmandline app if you prefer.
At this point you’re ready to create your first virtual machine.
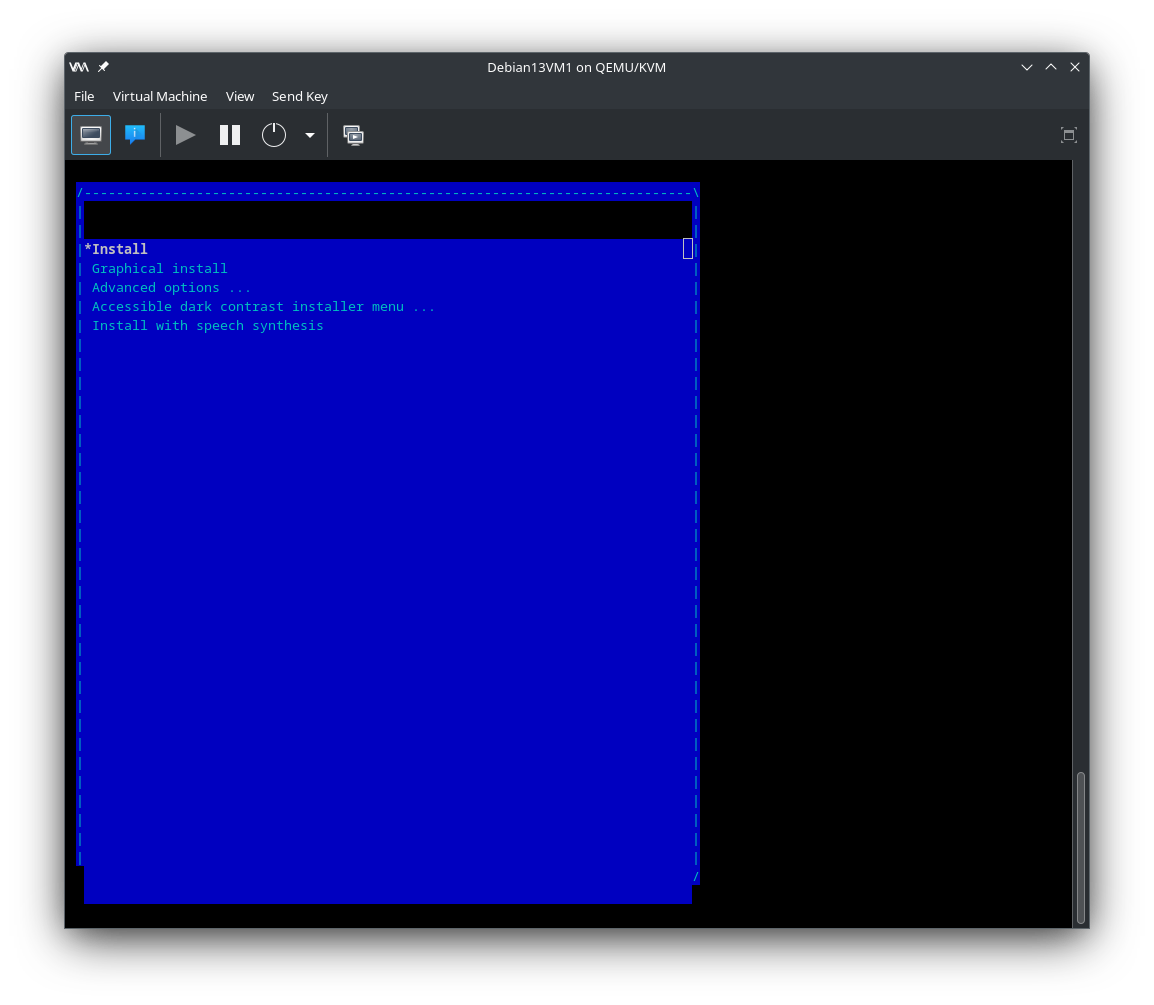
It’s important to have an arm64 version of Linux in ISO format that you can use to install into your VM. My preferred distro is Debian and so I downloaded the Debian 13 Arm64 netinst ISO from the debian.org website.
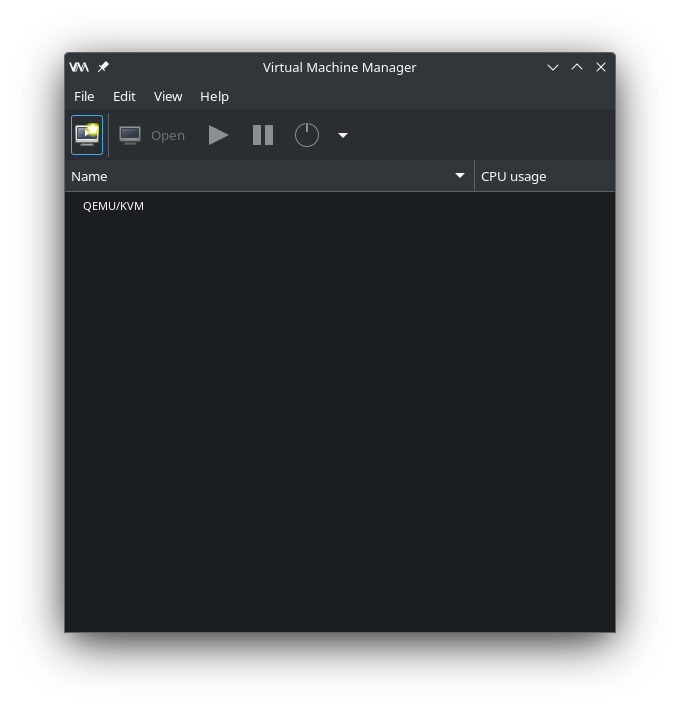
From the main menu start “Virtual machine Manager” or on the commandline type:
virt-manager
QEMU Virtual Machine Manager
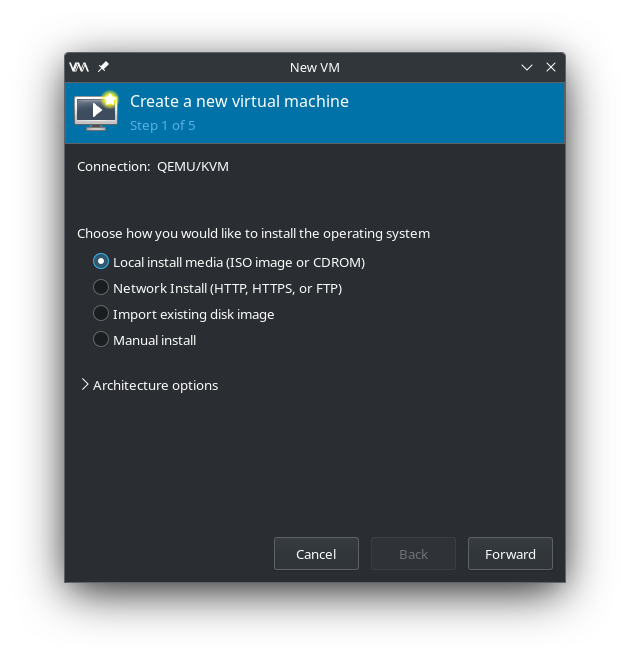
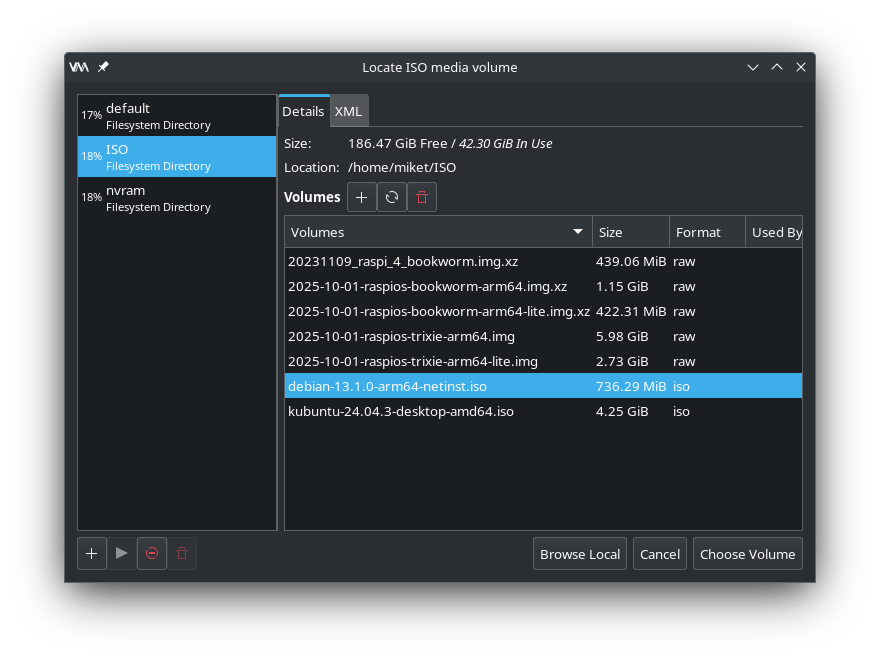
Click the Create new VM button and then navigate to where you saved your ISO file and select it as the installation media.
Virtual Machine Manager – Local install mediaVirtual Machine Manager – Select ISO file
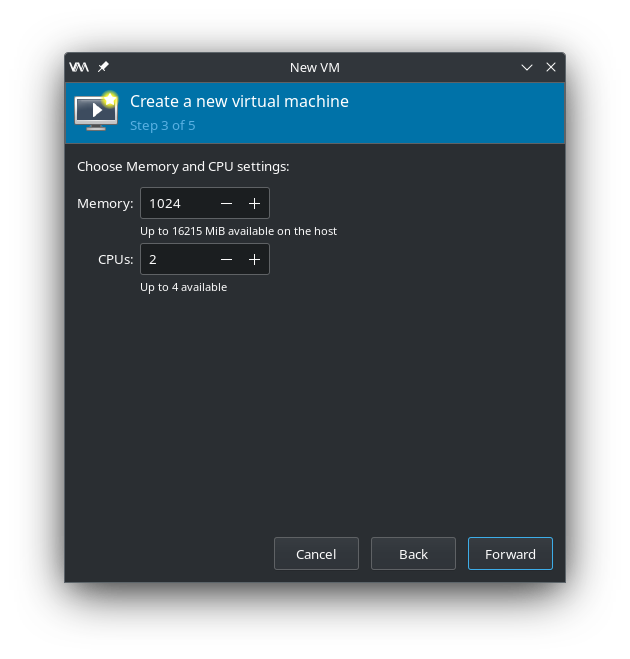
Once you’ve chosen your ISO you’ll need to configure the actual VM. Start by setting the amount of RAM and number of virtual CPUs you want the VM to have.
Virtual Machine Manager – Configure RAM and CPU
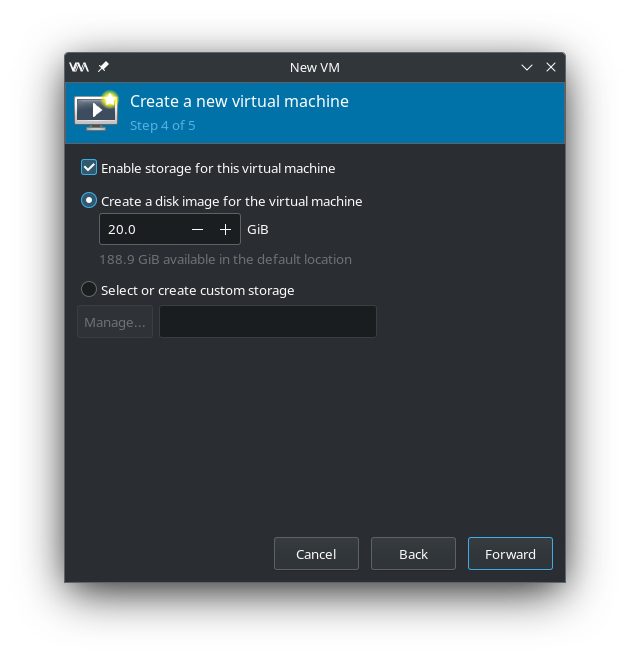
Next set the size of the virtual disk that the VM will use.
Virtual Machine Manager – Create virtual disk
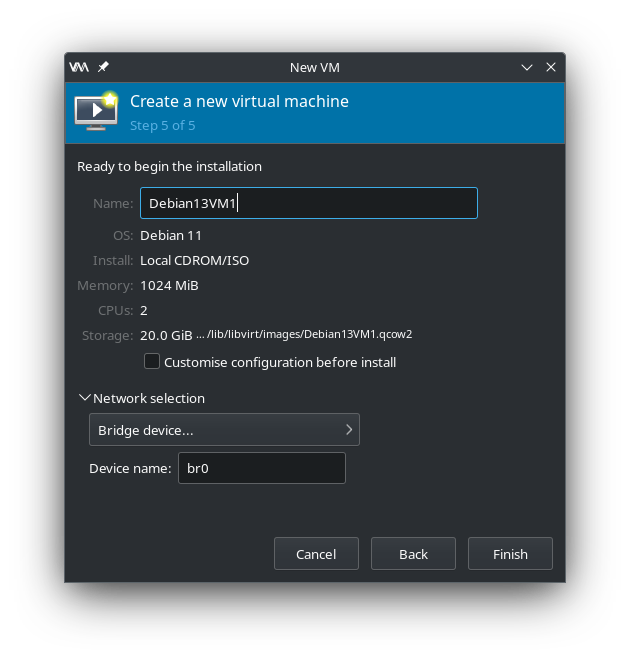
Finally, give the VM a name and set its network device to br0 as created above. Click finish and your VM will boot.
Virtual Machine Manager – Name VM and select bridge interface
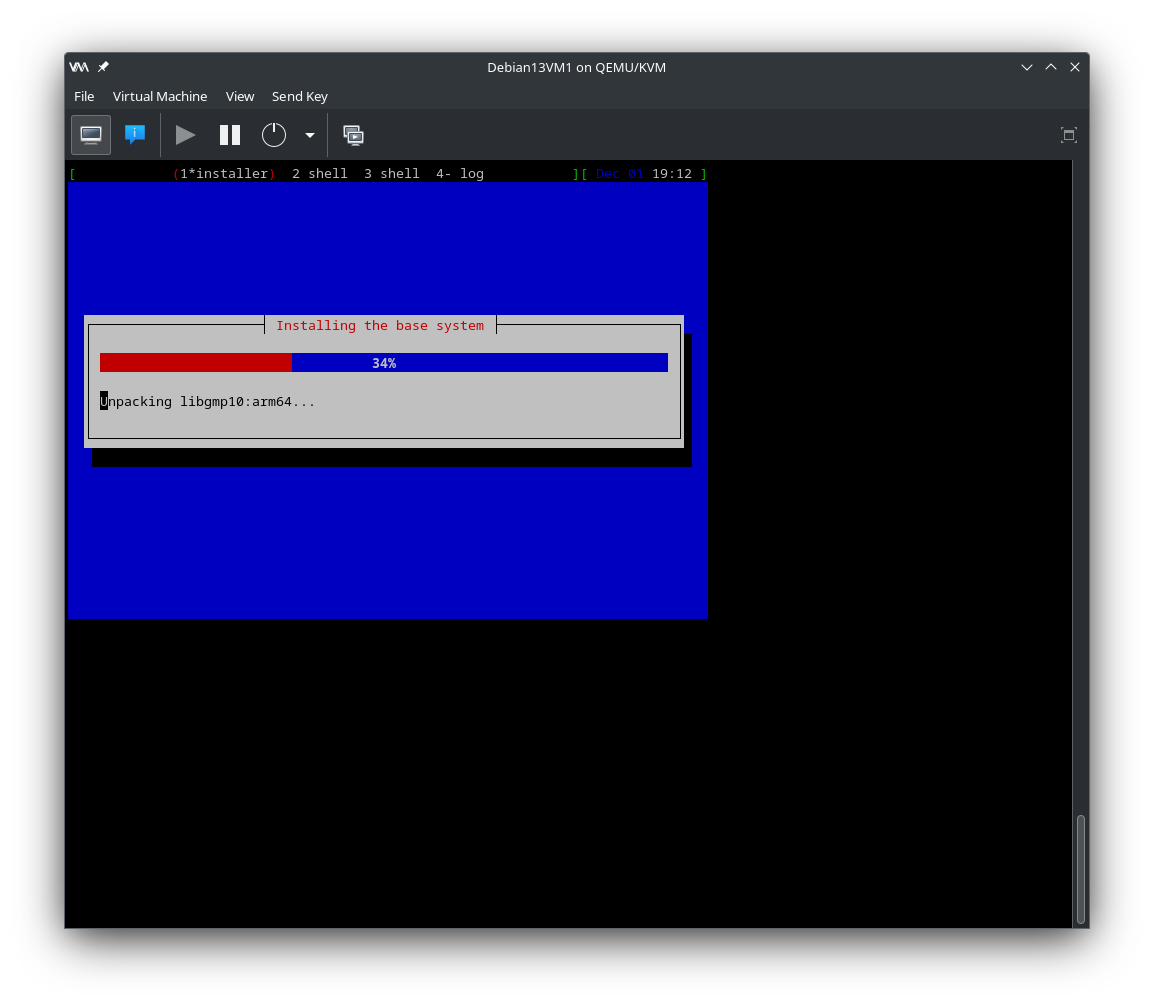
Now it’s just a case of going through the standard Debian install process to build your Debian VM.
Once the installation is complete and the VM has rebooted you will have a functional Debian computer ready to use for whatever you like, just like a physical PC but, in virtual form. You’ll find that the VM runs as fast as the actual physical machine thanks to the kernel based virtualisation.
I’ve spent some considerable time of late coding a new version of adi2html that I use to convert my ADIF log files into online web pages for all my HAM Radio logs.
The old version that I wrote quite some time ago was written using BASH shell which was quick and easy at the time but, as the logs grew in size it got slower and slower to process the ever increasing number of log entries.
Now I’m retired I have the time to revisit these things and write better, more modern versions of my various programs that run silently in the background.
Writing the new version of adi2html in Python3
It’s taken a little over a week to put this code together, test and debug it, I don’t like to rush these things!
I’ve finally put v1.2 into production today.
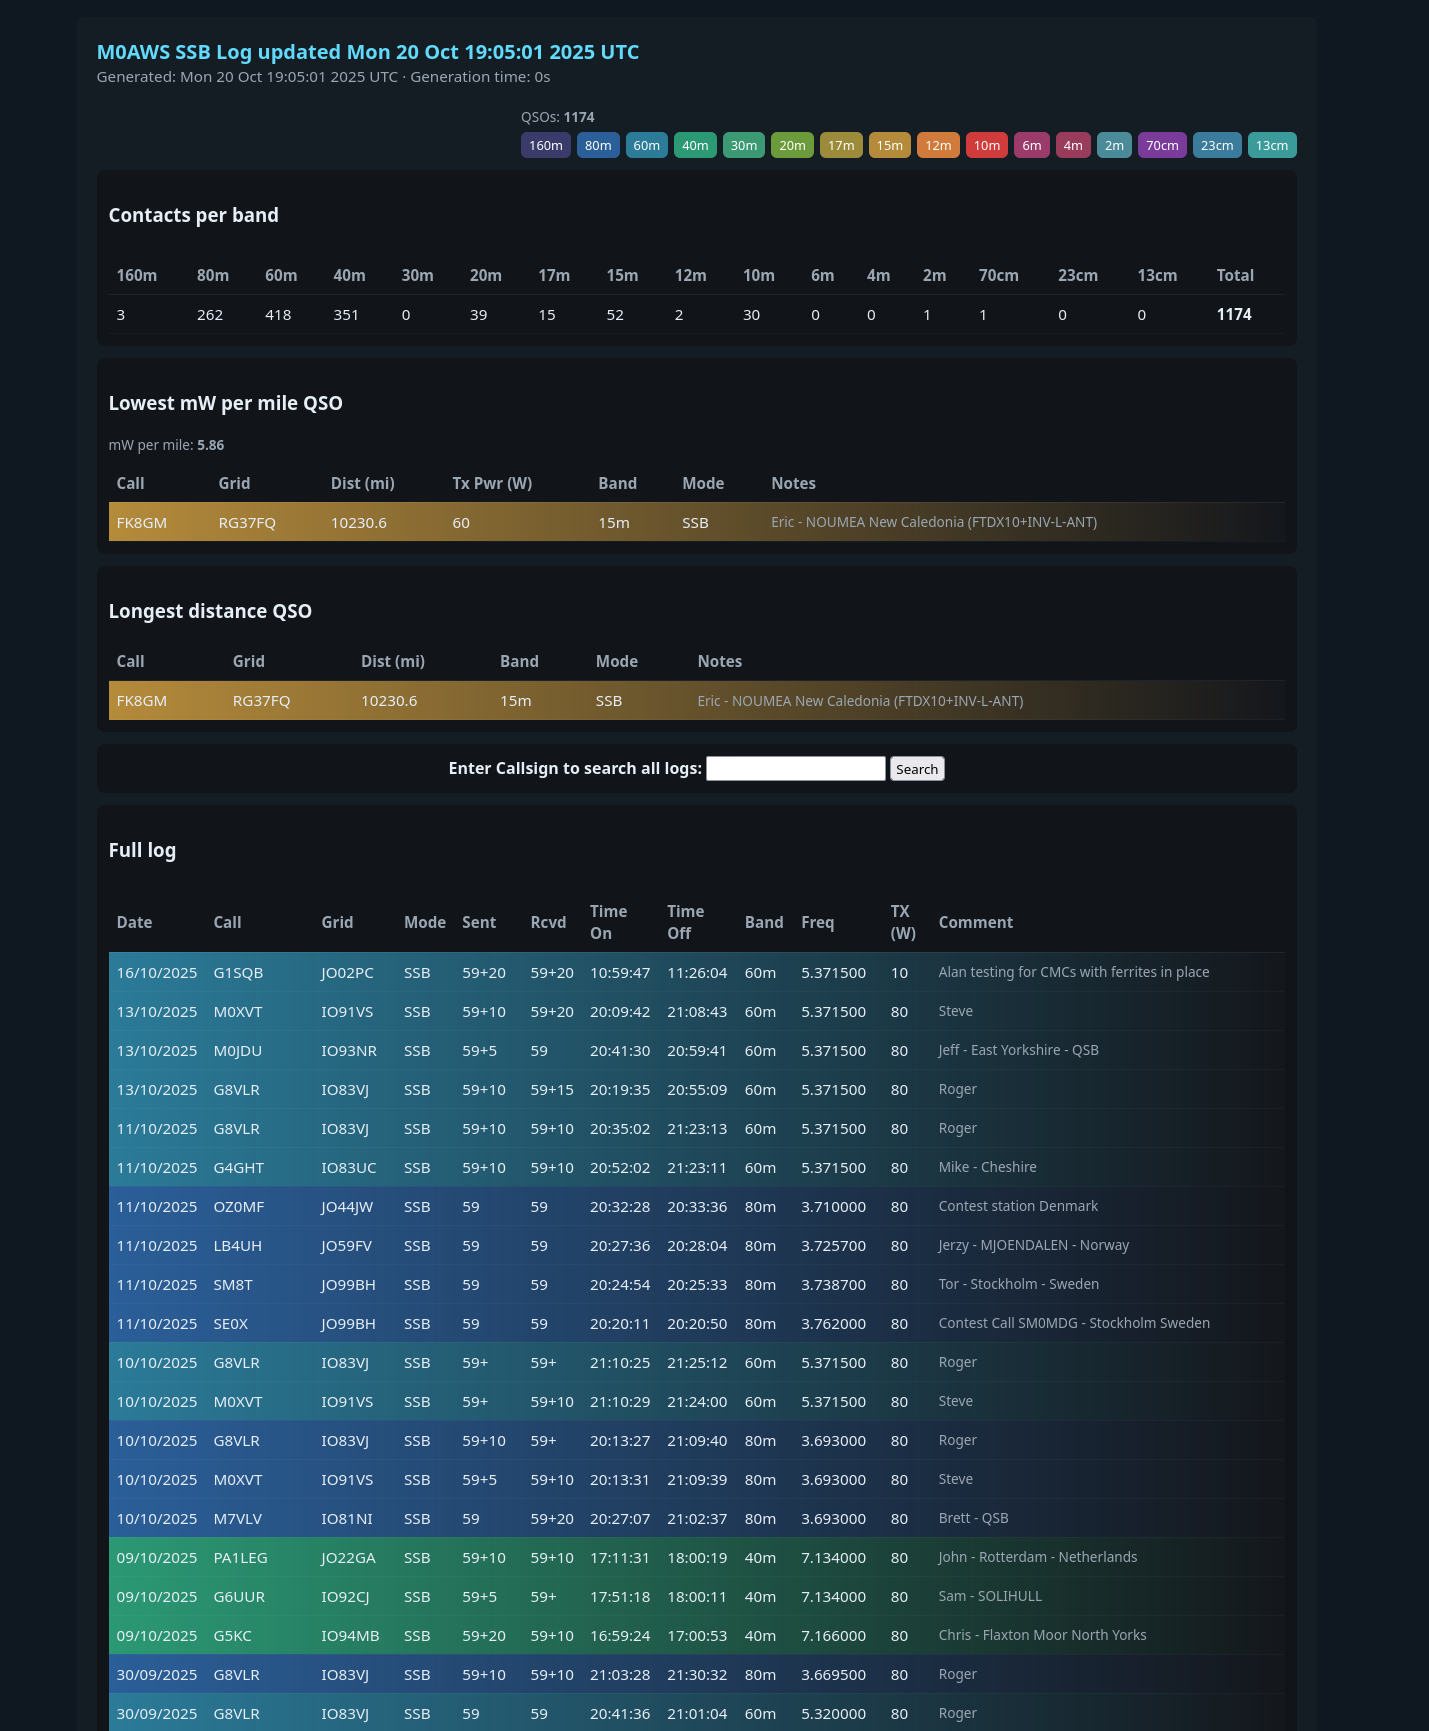
The 585 lines of code produce a very nice, modern looking web page and can be used to convert any ADIF file into HTML. The code is extremely quick, taking less than a second to process almost 2500 log entries, a huge improvement over the old version of adi2html.
New look M0AWS Log web page
All of my logs are available here on my blog under the Logs menu above, feel free to have a look at them.
I now need to rewrite the log search functionality so that it uses the same format of presentation for the results.
More soon …
We use cookies to ensure that we give you the best experience on our website. If you continue to use this site we will assume that you are happy with it.