Let me start this article by confessing that I hate Snap on Linux!
The whole idea that you’d need a container type environment to install an application on a Unix system is very far from where I want to be.
It annoys me that snaps are updated automatically too. I know you can disable this but, I shouldn’t have too. App’s should only get updated when I want to update them, not before.
What I really hate is the fact that the Snap back end system is proprietary and owned solely by Canonical, the Ubuntu people. This goes against my OpenSource ethos.
Sadly I had to install Snap to get the Signal messenger app installed on my RaspberryPi 5 desktop computer. App’s installed via Snap are extremely slow to start, run slow and are heavy on resources. Snap also mounts a whole bunch of dependency Snaps via loop devices to make the app work. Snaps make a real mess of your system.
The final straw that broke the camel’s back for me was when Snap did an automatic upgrade to Signal to a version that has a serious bug in it causing it to crash a minute or so after startup. I initially reverted to the previous version to get it working again but, sure enough Snap did another auto-update and broke it again.
This time I couldn’t revert back to the previous version as Canonical, in their infinite wisdom decided to remove the previous version of Signal from their Snap store!
At this point I removed the Signal Snap from my computer, along with all the “hanger on” snap packages that were clogging up the RaspberyyPi 5 and finally did a complete purge of snapd using dpkg to get rid of all the horrendous snap mount points on the file system.
After a reboot I then went hunting for the Signal messenger app source code. Looking through the code it’s not a 5min job to get it compiled on a RaspberryPi and so I followed a few of the forked versions to see if someone had already done all the hard work for me.
After disappearing down a few Rabbit Holes I eventually stumbled into the world of Pi Apps.
Pi Apps is a neat little app that provides access to the “most popular app store for RaspberryPi computers”. It’s 100% free, OpenSource and written in shell scripts. Perfect!
Installing the “Pi Apps” app is straight forward and only takes a few moments.
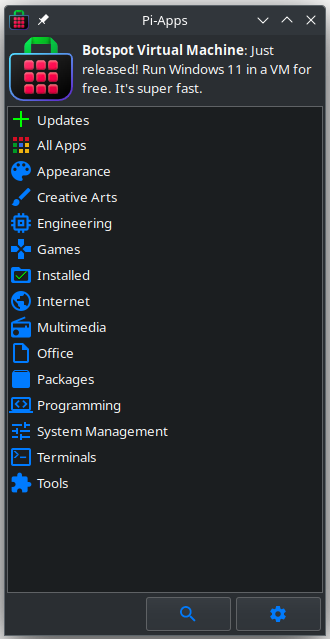
Pi-Apps – App store for RaspberryPi
Opening Pi-Apps I found a multitude of OpenSource apps all ready to be installed at the click of a button. In no time at all I’d found Signal and had it installed without getting anywhere near the dreaded Snap.
The version of Signal available at the time of writing this article is v7.39.0 which is fine as this is a stable, bug free version that works reliably.
If you’re using a RaspberryPi computer I can highly recommend you install the Pi-Apps app to enhance your collection of great OpenSource programmes to make your little raspberry flavoured buddy even more useful.
Many years ago when I lived in France I had a Flex-3000 transceiver, one of the first fully SDR transceivers on the market. It was paired with a proprietary Windows XP application called PowerSDR (now Opensource and called Thetis) and connected via a firewire connection.
17 years later I am once again venturing into the world of SDR transceivers in the form of a Hermes Lite 2. (HL2)
The HL2 hardware is available via the Makerfabs website in kit form. I ordered the HL2 motherboard, the N2ADR Filter Board to ensure a clean signal from the transceiver and the enclosure. Total cost for all the parts and shipping was £288.00 including all taxes.
The kit took about 10 or so days to arrive and was very easy to put together making sure to fit the PA transistor heat sink the right way round so that it doesn’t short out the main board. (There are many videos about this on YouTube)
Once the hardware was put together I needed to install some software to control/drive the HL2. Being a heavy weight Linux user my software choice had to come from the Opensource world.
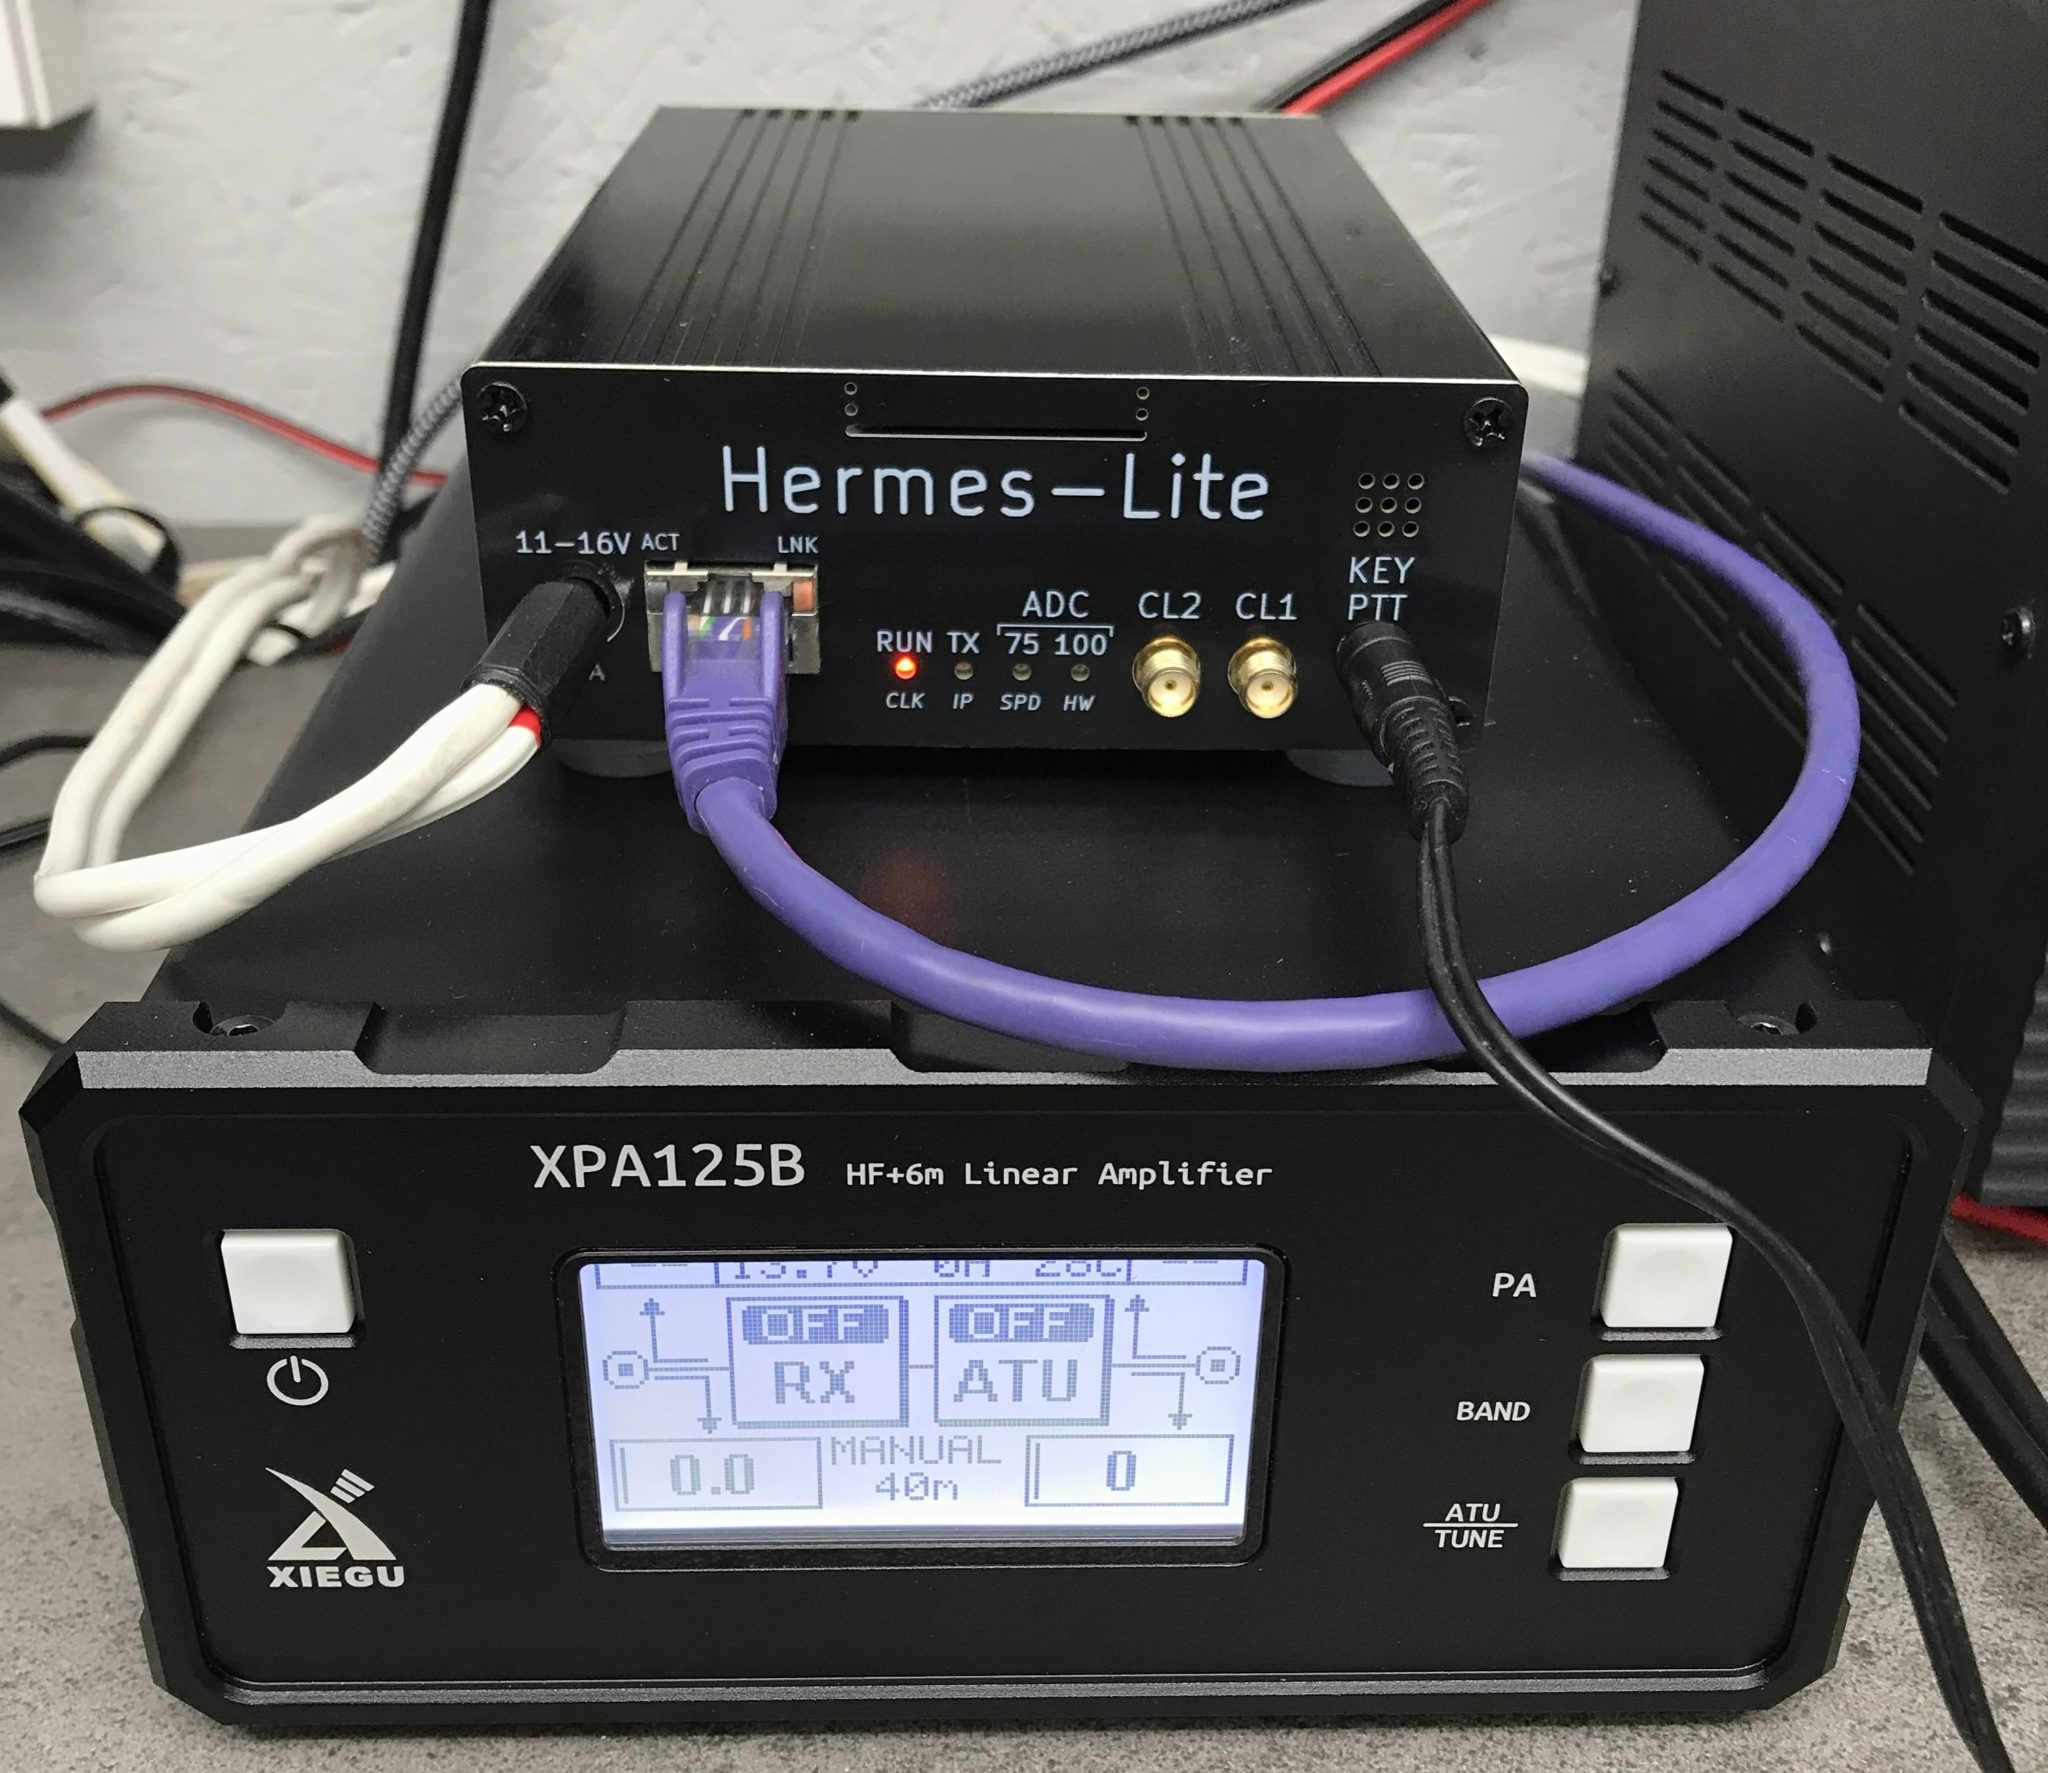
M0AWS Hermes Lite 2 SDR Trasnceiver and Xiegu XPA125B Amplifier
After much research and chatting with other HAMs on the Matrix who have the HL2 I found that most people use the closed source SDR Console software to control the transceiver. Since this software is for Windows it’s not something I can use as I don’t have any Windows PCs, they’re all Linux only.
To this end I started researching Linux SDR software for the HL2 and decided that PiHPSDR was the one I was going to try first.
PiHPSDR was originally written for the RaspberryPi 3/4/5 single board computers (SBCs) but, I wanted to have a go at compiling it on my Kubunu Linux desktop PC. I found it straight forward to follow the instructions in the pihpsdr-install.pdf file and in no time at all I had the software compiled and running.
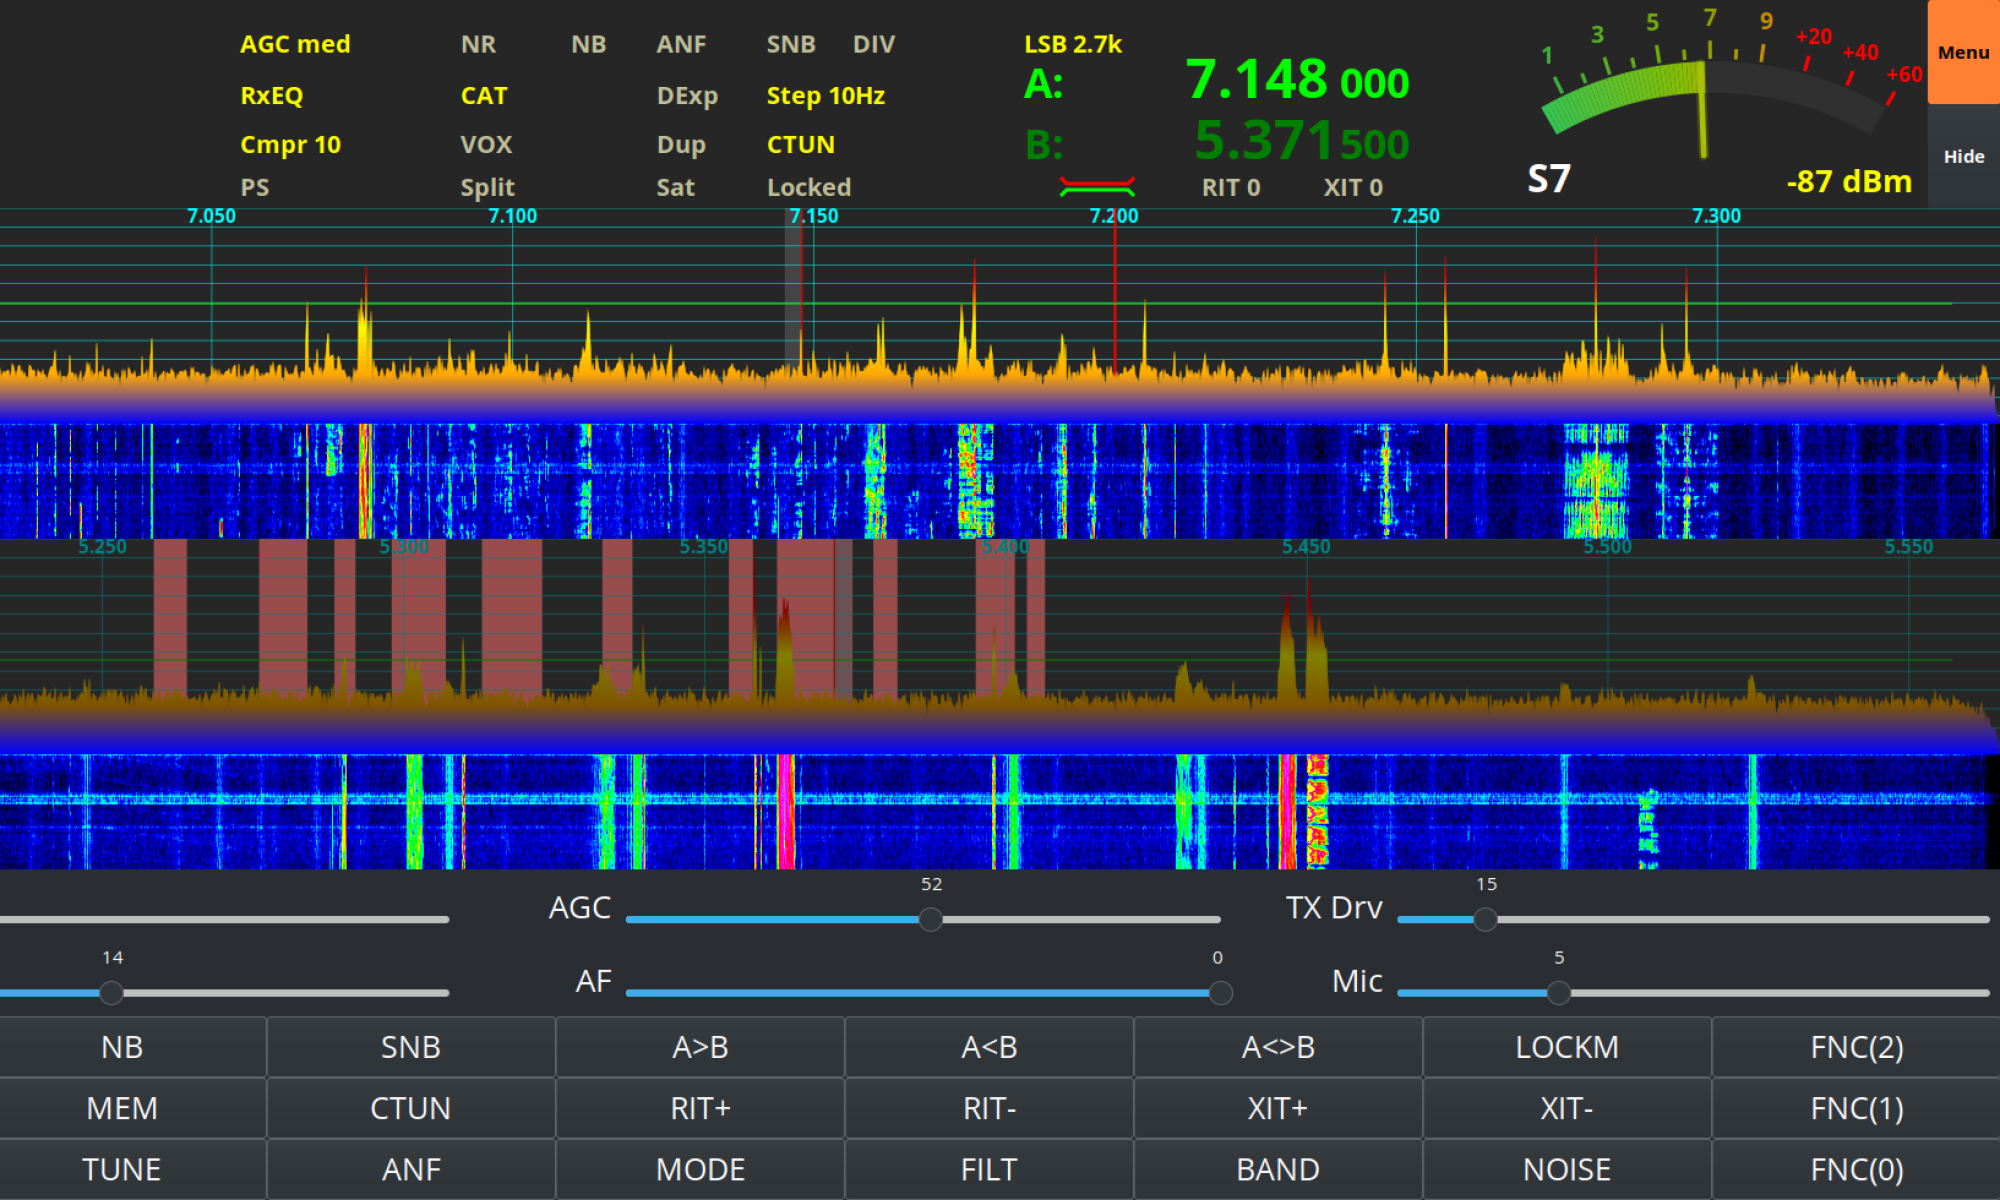
PiHPSDR running on Kubuntu Linux 22.04LTS
PiHPSDR is infinitely configurable and thus it feels like it has an infinite number of menus and options. Since the HL2 has two separate receivers, it’s possible to listen to two bands at the same time. This is the one feature I really missed more than anything with my FTDX10 so, I’m glad to have dual receive capability back once more!
Going through all the settings I realised that the A and B VFOs have individual settings. Initially I setup the software using just VFO A but, when I switched over to VFO B none of my settings were there. I then had the realisation that the settings apply only to the active VFO. I quickly went through all the settings again for VFO B and all was well.
In no time at all I was on the air with just 5w as my Xiegu amp hadn’t arrived. Not being perturbed I tuned up on the 15m band and started searching for stations. Interestingly it was CQWW SSB weekend and the band was full of contest stations. Working my way along the spectrum I found I was able to work quite a few stations with ease using my vertical and inverted-L antennas.
Contacts of note were VE3KG at 3406 Miles, VE3JM at 3382 Miles, RW9DX at 2380 Miles, KC1XX at 3331 Miles and N1DE at 3600 Miles. I also worked a bunch of European stations and had a great time giving away points with my little QRP rig.
Contests are a good time to try out new radios as all the big stations with good ears are on the bands and make the effort to get us QRP guys in their logs.
I have been extremely impressed with the receivers in the HL2 radio. It handles both strong and weak stations exceptionally well. PiHPSDR really does have brick-wall filtering and I was able to work the weaker stations right next to large contest stations with ease. At no time did the front-end of the receiver get overloaded.
Below is a short video clip of a conversation on the 80m band. The band was quite noisy however, with a reduction of the AGC gain and the 2700Hz filter it’s possible to remove almost all the noise.
Hermes Lite 2 SSB reception on the 80m Band
On CW the radio is a real delight. With the filtering and AGC gain control I am able to use extremely narrow receive filters without any ringing whatsoever. I would say that on CW the HL2 is as good as my FTDX10 when it comes to receiving even the weakest of stations.
I’m sure on paper the FTDX10 receiver has better numbers however, to the ear there really is no discernible difference.
Below is a short video clip of D4DX on CW on the 80m band. The band was noisy but, with the 100Hz filter enabled and clever use of the AGC Gain I was able to remove almost all the noise completely, reducing fatigue on the ears and making reception very easy even though there was some fairly deep QSB at times.
Receiving D4DX on CW on the 80m band using 100Hz filter and reduced AGC gain
A few days later my Xiegu XPA125B amplifier arrived. Unfortunately the amp didn’t come with the normal PTT lead that comes from the factory and is detailed in the user manual. For some bizarre reason this is a chargeable option when you buy the amp from Martin Lynch and Sons even though it is included from the factory.
This meant I had to make a lead which was a problem as I didn’t have one of the mini DIN plugs required for the connection to the amplifier. Jumping onto Amazon I ordered a packet of two and sat back and waited for their arrival.
A couple of days later the DIN plugs arrived and I quickly made up the necessary phono/RCA to mini DIN lead and got the amp operational.
The Xiegu XPA125B isn’t cheap but, it’s a really nice bit of kit. The neat little LCD display keeps you informed of power O/P, I/P and O/P SWR, voltage, current draw, temperature and band selected.
With just 0.7w of input from the HL2 I’m able to get a full 100w O/P from the amp. On the lower bands I have to reduce the O/P from the Hermes Lite 2 even further so that I don’t over drive the amp.
Being an avid Short Wave Listener (SWL) I wanted to see how the HL2 performed when listening to the big AM broadcast stations. To my surprise it makes an excellent SWL receiver with better AM demodulation than many of the more expensive radios. Having the option to select receive filters up to 16Khz wide I found I was able to get the best audio possible from many of the broadcast stations including Radio Caroline on 648Khz. It’s quite an improvement over the 12Khz maximum on the FTDX10.
Listening to AM Broadcast stations
What makes this project even more exciting is that both the hardware and software are from the OpenHardware/OpenSource world. The complete circuit diagram, PCB layout and information is available for all to download, something you don’t often see these days!
PiHPSDR is one of the nicest SDR applications I’ve seen in the Linux world and even comes with a 200 page downloadable user manual. Something you don’t see in many Opensource projects. The source code for the application is downloadable and you are able to make your own changes to it without restriction.
Overall I am really pleased with the Hermes Lite 2 SDR transceiver. It has two excellent receivers, is infinitely configurable via the PiHPSDR software and performs extremely well under all conditions. Since getting the radio I haven’t even switched on the FTDX10.
I’ve been working on squashing some bugs in my Node-RED AllStarLink Control Dashboard with the help of Steve, M0XVT which has resulted in a new version of the flow now being available for download below.
If you’re reading this and aren’t too sure what it is all about then, have a look at my original article detailing the Node-RED AllStarLink Control Dashboard that I developed and wrote about back in September 2024 and hopefully it’ll all make sense.
This new version of the flow resolves an issue whereby the dashboard used an incorrect node number for the node it connects to resulting in it not working unless a piece of code was changed. The update was a simple change to add a couple of nodes that connect to the RaspberryPi and read the Asterisk/AllStarLink node number from the asterisk configuration files at startup.
Node-RED AllStarLink Control Dashboard v1.2 additional sub flow
I also fixed another bug whereby the buttons could show a false connect on a button when the user connects to another node via AllMon2/Supermon instead.
This flow no longer has the blue spare button as it now connects to a node in Melbourne Australia.
Node-RED AllStarLink Control Dashboard v1.2
You can download the new, v1.2 updated flow below and import it to your Node-RED flow editor using the standard import tool from the burger menu in the flow editor.
Ever since I built my RaspberryPi/SHARI AllStarLink node I’ve had to manage connecting/disconnecting to/from other nodes using the Allmon2 or Supermon web admin interfaces. These work fairly well albeit, a bit clunky and buggy. It’s impossible to use from a mobile device though and so I have to get my Macbook out each time I want to connect/disconnect nodes.
Being a Node-RED fanatic I decided that I should put something together that was more portable, mobile friendly and much easier to use. A simple user interface is all that is required and can be achieved very easily using the standard Node-RED dashboard nodes.
Initially I started investigating the Linux command-line interface for Asterisk, the VOIP system that underpins AllStarLink (ASL). I very quickly discovered that the ASL node can be very easily controlled directly from the command-line and that this would be an ideal interface to use to enable node management via a Node-RED dashboard.
In very little time at all I had an experimental control dashboard working with the ASL node and was able to connect/disconnect to/from a single node. All that was required now was to extend this so that I could connect to a number of nodes with nothing more than a push of a button.
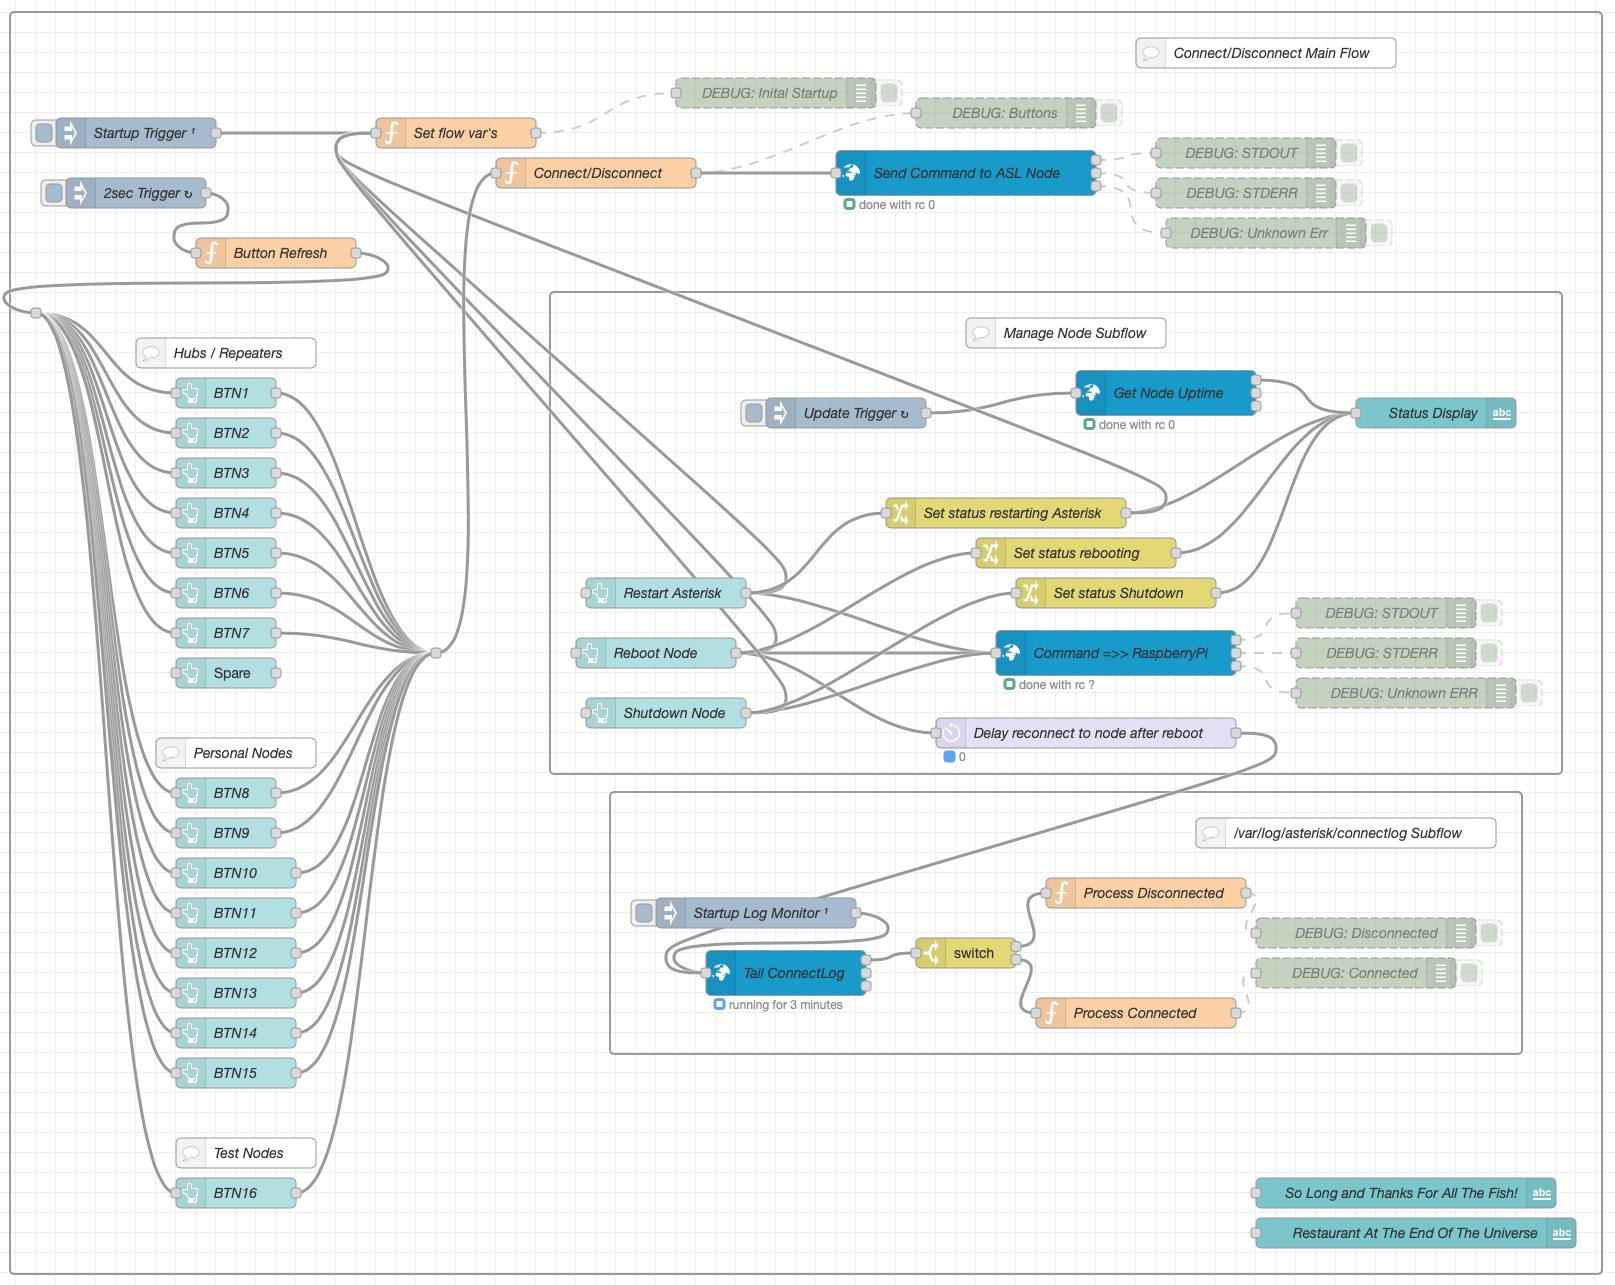
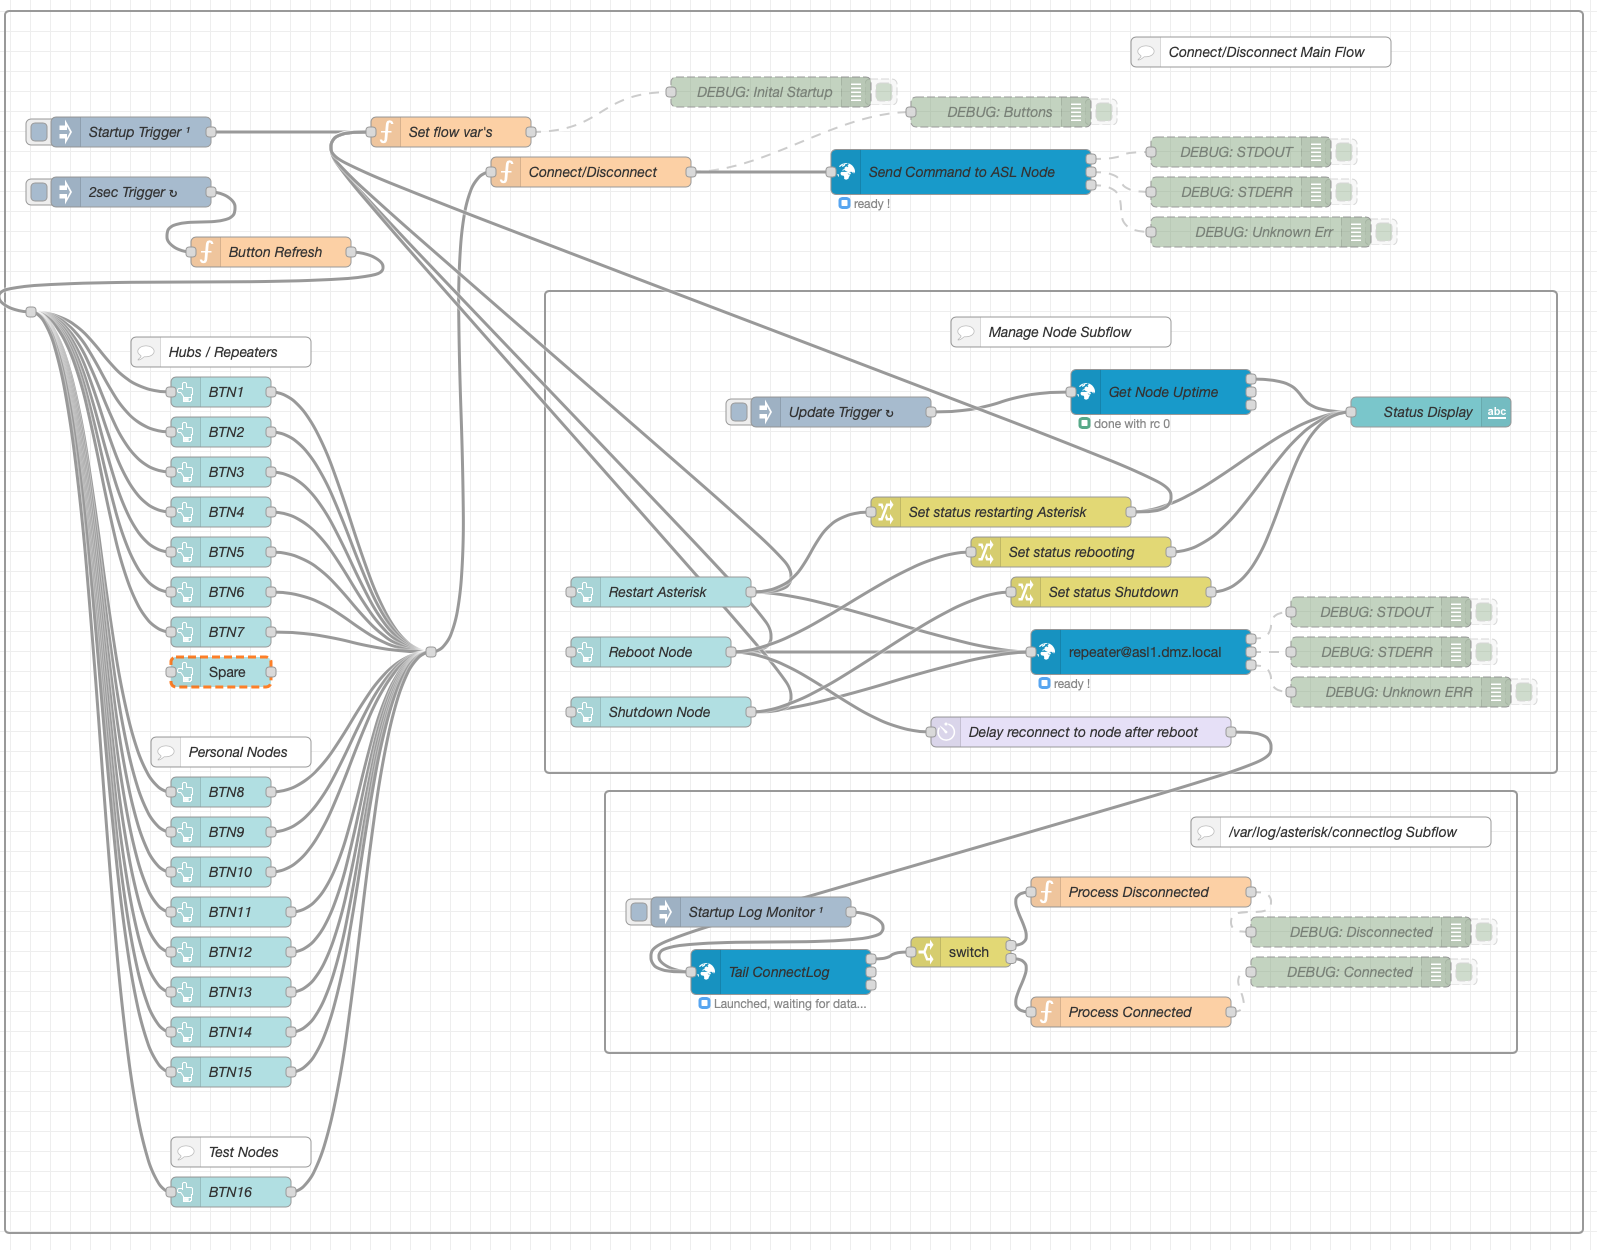
Completed v1.0 AllStarLink Control Dashboard – Node-RED Flow
The resultant flow consists of 3 sections, Connect/Disconnect Main Flow, Manage Node Subflow and /var/log/asterisk/connectlog Subflow.
The Connect/Disconnect Main Flow handles all the input from the buttons on the dashboard and the communication to the underlying Asterisk VOIP system.
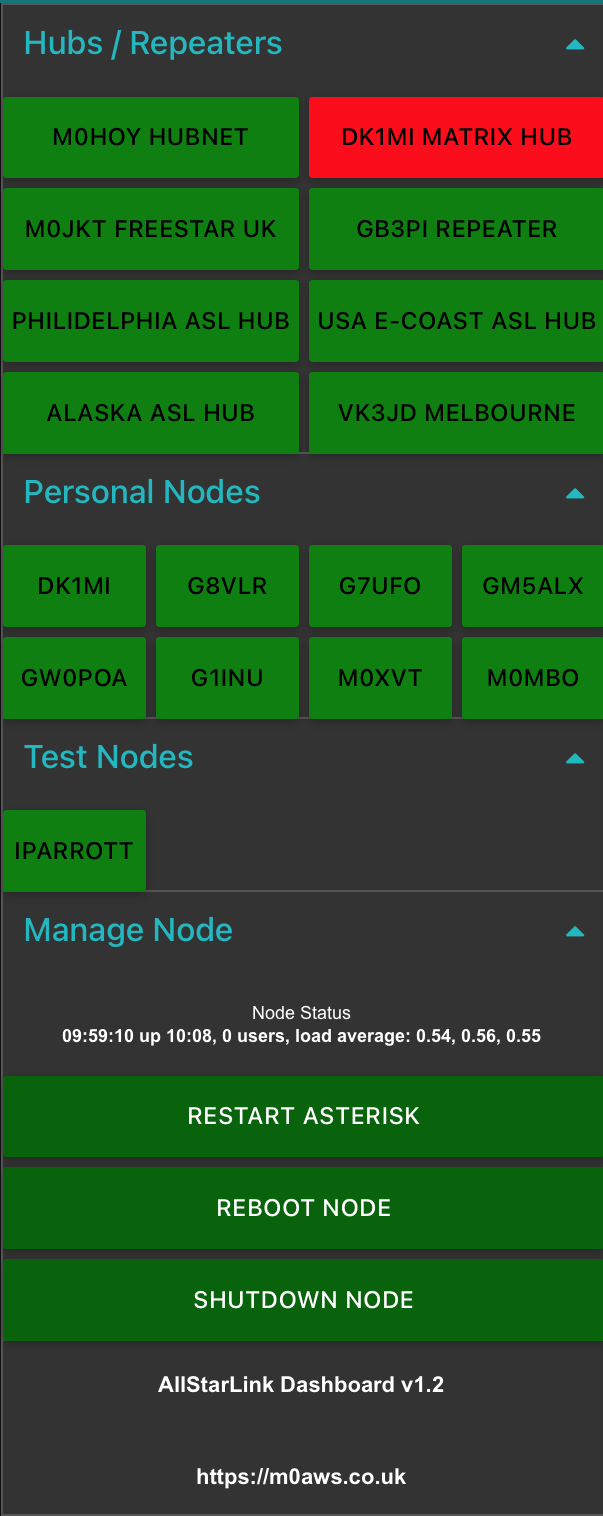
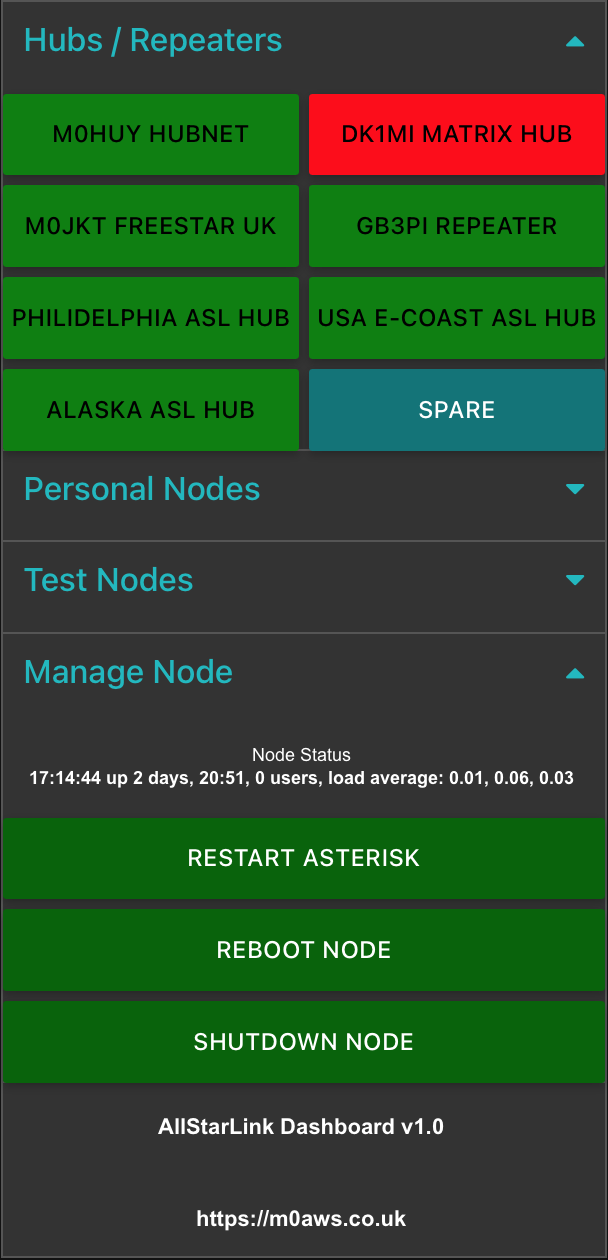
The button status is denoted by 3 colours, green (Ready to connect), orange (Transitioning to/from connect) and red (Connected). Each button is updated automatically by the button refresh function that is triggered every 2 seconds.
The Manage Node Subflow provides a simple interface to restart the Asterisk VOIP system, reboot the RaspberryPi and shutdown the RaspberryPi. The node status is automatically updated every 45 seconds and will show when the Asterisk subsystem is being restarted or the node is being rebooted or shutdown.
Finally the var/log/asterisk/connectlog Subflow monitors the Asterisk connectlog looking for connect/disconnect messages so that it can signal to update each button status.
Node-RED AllStarLink Dashboard
Each section of the dashboard can be collapsed/opened by touching/clicking the little blue arrows on the right of the dashboard. The dashboard works fine on Android, iOS, Windows, MacOS and Linux.
If you’re not familiar with Node-RED and haven’t yet installed it to your PC, take a look at the Node-RED Getting Started Page. The information takes you through installing Node-RED onto a multitude of devices including PC and RaspberryPi devices.
Once you have Node-RED installed all you need to do is download the AllStarLink Control Dashboard Flow and import it to your Node-RED flow editor.
Note: The link above is now for v1.2 of the flow which includes some critical bug fixes. You can read about the bug fixes in the v1.2 release article.
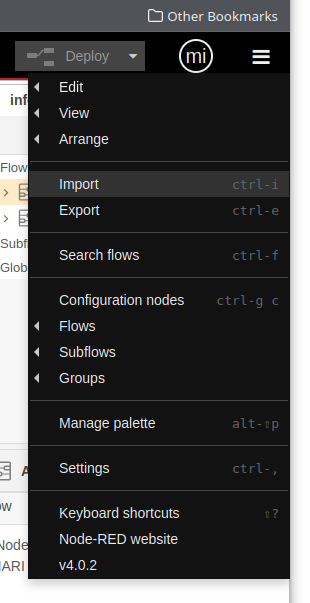
Once downloaded, select Import from the burger menu icon on the right-hand side of the flow editor as shown below and import the flow file.
Node-RED Flow Editor import Menu Item
Once imported you will find that some of the nodes in the flow are not available. This is because you need to add them to the flow editor palette before being able to deploy the flow.
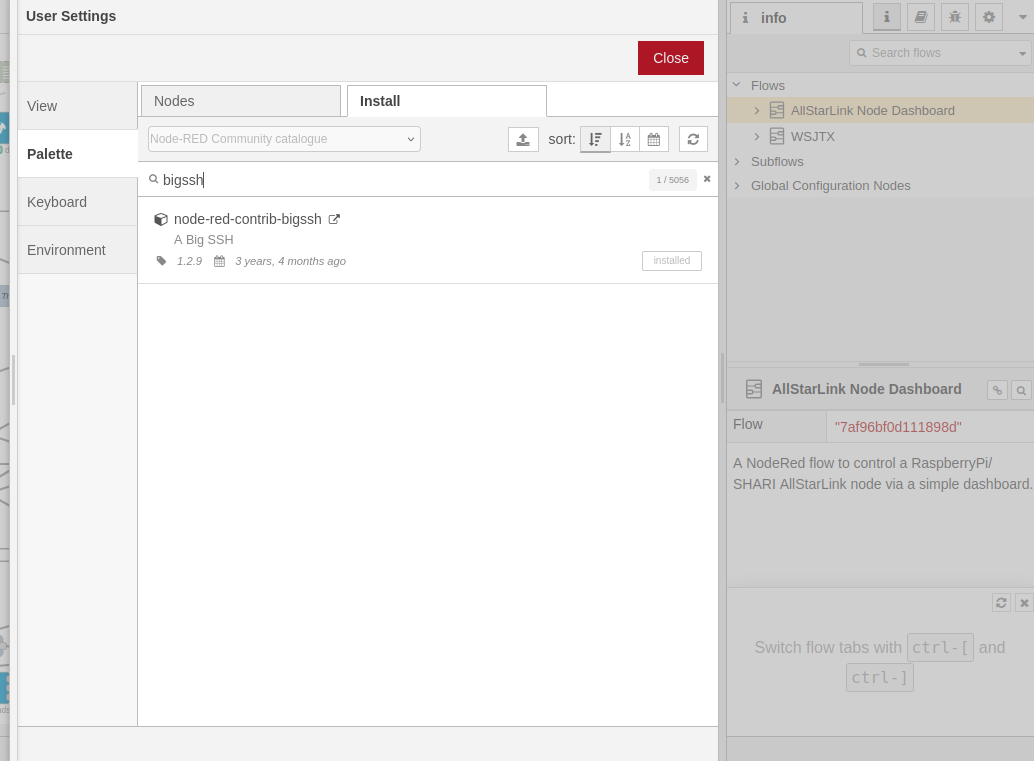
Drop down the same menu as shown above but, this time select Manage Palette. This will open another window where you will need to select the Install tab as shown below.
Node-RED Flow Editor Palette Install Tab
You need to install two node sets to complete the flow, node-red-contrib-bigssh and node-red-dashboard. Type in the name of each package one at a time in the search bar and then click the Install button. Once the two packages are installed you then need to configure the credentials for logging into your RaspberryPi. This is simply done by double clicking the blue Send Command to ASL node at the top of the main flow and then clicking the Pencil button at the end of the Credentials field. This will open another window where you will need to type in the IP Address of your ASL RaspberryPi into the Host field, then enter 22 into the port field, add repeater into the Username field (repeater is the default username, if you have changed this then you will need to add the new username name in instead) and then the password associated with the repeater login into the Password field. (Normally allstarlink)
Once this is done, do the same on the other blue nodes, namely “Get Node Uptime“, “Command =>> RaspberryPi” and “Tail ConnectLog”.
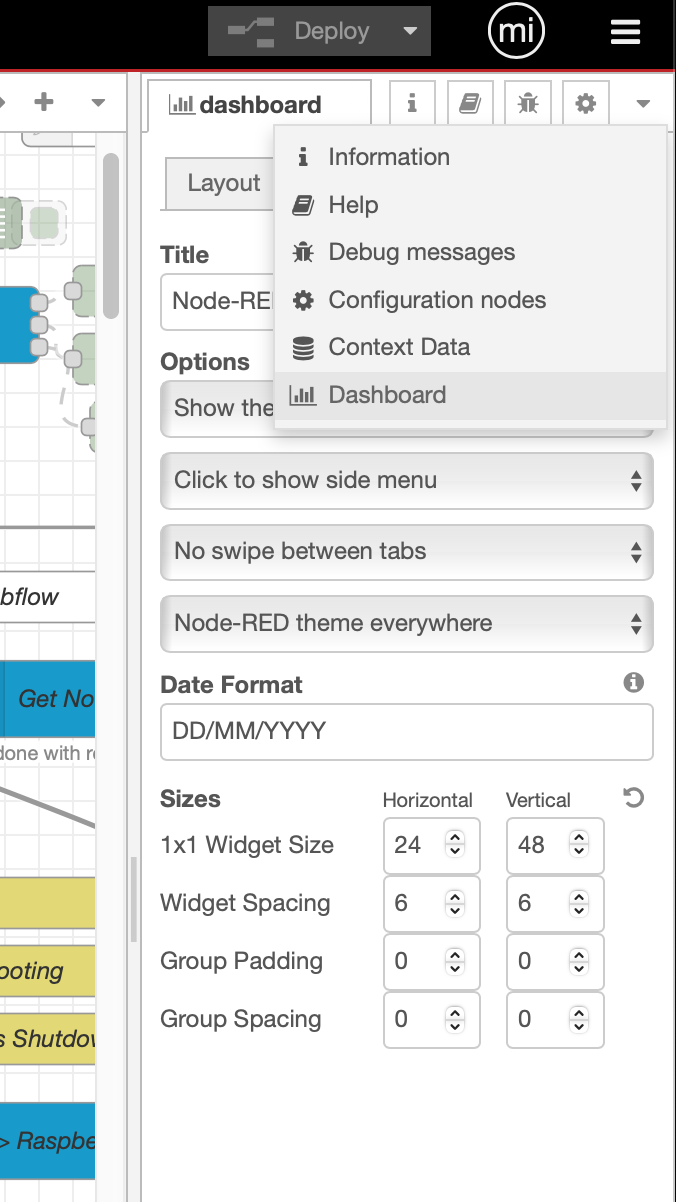
The final thing to setup is the dashboard size. Click on the downward pointing triangle at the top right of the menu bar (under the burger menu) and select dashboard. Check that the sizes are set the same as in the image below. For some reason, these settings aren’t always imported (Possible bug?) so, if your dashboard layout isn’t like shown above it will be because these settings failed to import.
ASL Dashboard Settings
You are now ready to deploy your AllStarLink Control Dashboard! Press the red Deploy button at the top of the flow editor window.
Finally, if you want to change the nodes that each button connects/disconnects you will need to edit the set flow var’s function at the top of the main flow. All you will need to do is replace the existing node numbers taking care not to alter the rest of the code in any way otherwise, it could stop the flow from working.
Once you’ve edited the node numbers, double click on the associated button node and change its Label to show the new node name.
Once your changes are complete, Deploy the flow again and your changes will be live.
This is version 1 of the ASL Dashboard, I already have ideas for version 2 that will also have the ability to enter a node number into a field and connect to it without the need to program it into a button.
Coding of version 1 of the AllStarLink Dashboard is now complete and in the final testing phase. Below is a short video clip showing some of the functionality.
The Node-RED flow for the web app is pretty compact and easy to alter should I add more functionality in the future.
M0AWS Node-RED flow for the AllStarLink Node Dashboard
The dashboard is designed such that it’ll display nicely on mobile phones, tablets and desktop computers so, I can easily control my AllStarLink SHARI node from any of my devices around the house.
I’ll put together a more detailed article on the web app once testing is complete and it’s ready to be released into the wild.
This is more of an aide memoire for myself more than anything but, may be useful to anyone who is using a SHARI powered AllStarLink node.
Out the box the SHARI build as documented here and here uses node numbers in announcements when connecting/disconnecting. The information in this article will change this so that the announcements use the node callsigns instead of node numbers.
As user repeater, login to the RaspberryPi that the SHARI is connected too via SSH and make the following changes:
1: Using your favourite command line text editor, edit /usr/sbin/write-node-callsigns and change SRCDIR to point to /var/www/html/allmon2
# 28/08/24 - M0AWS - Changed path to point to allmon2
##SRCDIR=/var/www/html/allmon
SRCDIR=/var/www/html/allmon2
2: Copy the astb.txt file into the necessary directory:
I’ve got a couple of old RaspberryPi computers on the shelf in the shack and so decided it was time for me to put one of them to good use. The first model on the shelf is the oldest and is one of the very first RaspberryPi 1 computers that was released. (It’s the one with the yellow analog video signal output on the board!). This particular model is extremely slow but, I hang onto it just as a reminder of the first SBC in the line.
The second one is a RaspberryPi 2, a quad core machine that is only slightly faster than the first model but, it’s powerful enough to run HAM Clock.
It didn’t take long to install a vanilla Raspbian Desktop O/S and get it configured on the local LAN. I installed a few packages that I like to have available on all my Linux machines and then started on the HAM Clock install.
The first thing I needed to do was install the X11 development library that is required to compile the HAM Clock binary. To do this, open a terminal and enter the command below to install the package.
sudo apt install libx11-dev
You will need to type in your password to obtain root privileges to complete the installation process and then wait for the package to be installed.
The HAM Clock source code is available from the HAM Clock Website under the Download tab in .zip format. Once downloaded unzip the file and change directory into the ESPHamClock folder ready to compile the code.
cd ~/Downloads/ESPHamClock
Once in the ESPHamClock directory you can run a command to get details on how to compile the source code.
make help
This will check your system to see what screen resolutions are available and then list out the options available to you for compiling the code as shown below.
The following targets are available (as appropriate for your system)

    hamclock-800x480          X11 GUI desktop version, AKA hamclock
    hamclock-1600x960         X11 GUI desktop version, larger, AKA hamclock-big
    hamclock-2400x1440        X11 GUI desktop version, larger yet
    hamclock-3200x1920        X11 GUI desktop version, huge

    hamclock-web-800x480      web server only (no display)
    hamclock-web-1600x960     web server only (no display), larger
    hamclock-web-2400x1440    web server only (no display), larger yet
    hamclock-web-3200x1920    web server only (no display), huge

    hamclock-fb0-800x480      RPi stand-alone /dev/fb0, AKA hamclock-fb0-small
    hamclock-fb0-1600x960     RPi stand-alone /dev/fb0, larger, AKA hamclock-fb0
    hamclock-fb0-2400x1440    RPi stand-alone /dev/fb0, larger yet
    hamclock-fb0-3200x1920    RPi stand-alone /dev/fb0, huge
For my system 1600×960 was the best option and so I compiled the code using the command as follows.
make hamclock-1600x960
It’s no surprise that it takes a while to compile the code on such a low powered device. I can’t tell you how long exactly as I went and made a brew and did a few other things whilst it was running but, it took a while!
Once the compilation was complete you then need to install the application to your desktop environment and move the binary to the correct directory.
make install
Once the install is complete there should be an icon on the GUI desktop to start the app. If like mine it didn’t create the icon then you can start the HAM Clock by using the following command in the terminal.
/usr/local/bin/hamclock &
The first time you start the app you’ll need to enter your station information, callsign, location etc and then select the settings you want to use. There are 4 pages of options for configuring the app all of which are described in the user documentation.
M0AWS – HAM Clock running on RaspberryPi Computer
Once the configuration is complete the map will populate with the default panels and data. I tailored my panels to show the items of interest to me namely, POTA, SOTA, International Beacon Project and the ISS space station track. I was hoping to be able to display more than one satellite at a time on the map however, the interface only allows for one bird to be tracked at a time.
You can access the HAM Clock from another computer using a web browser pointed at your RaspberryPi on your local LAN using either the IP address or the hostname of the device.
http://<hostname>:8081/live.html

or

http://<ip-address>:8081/live.html
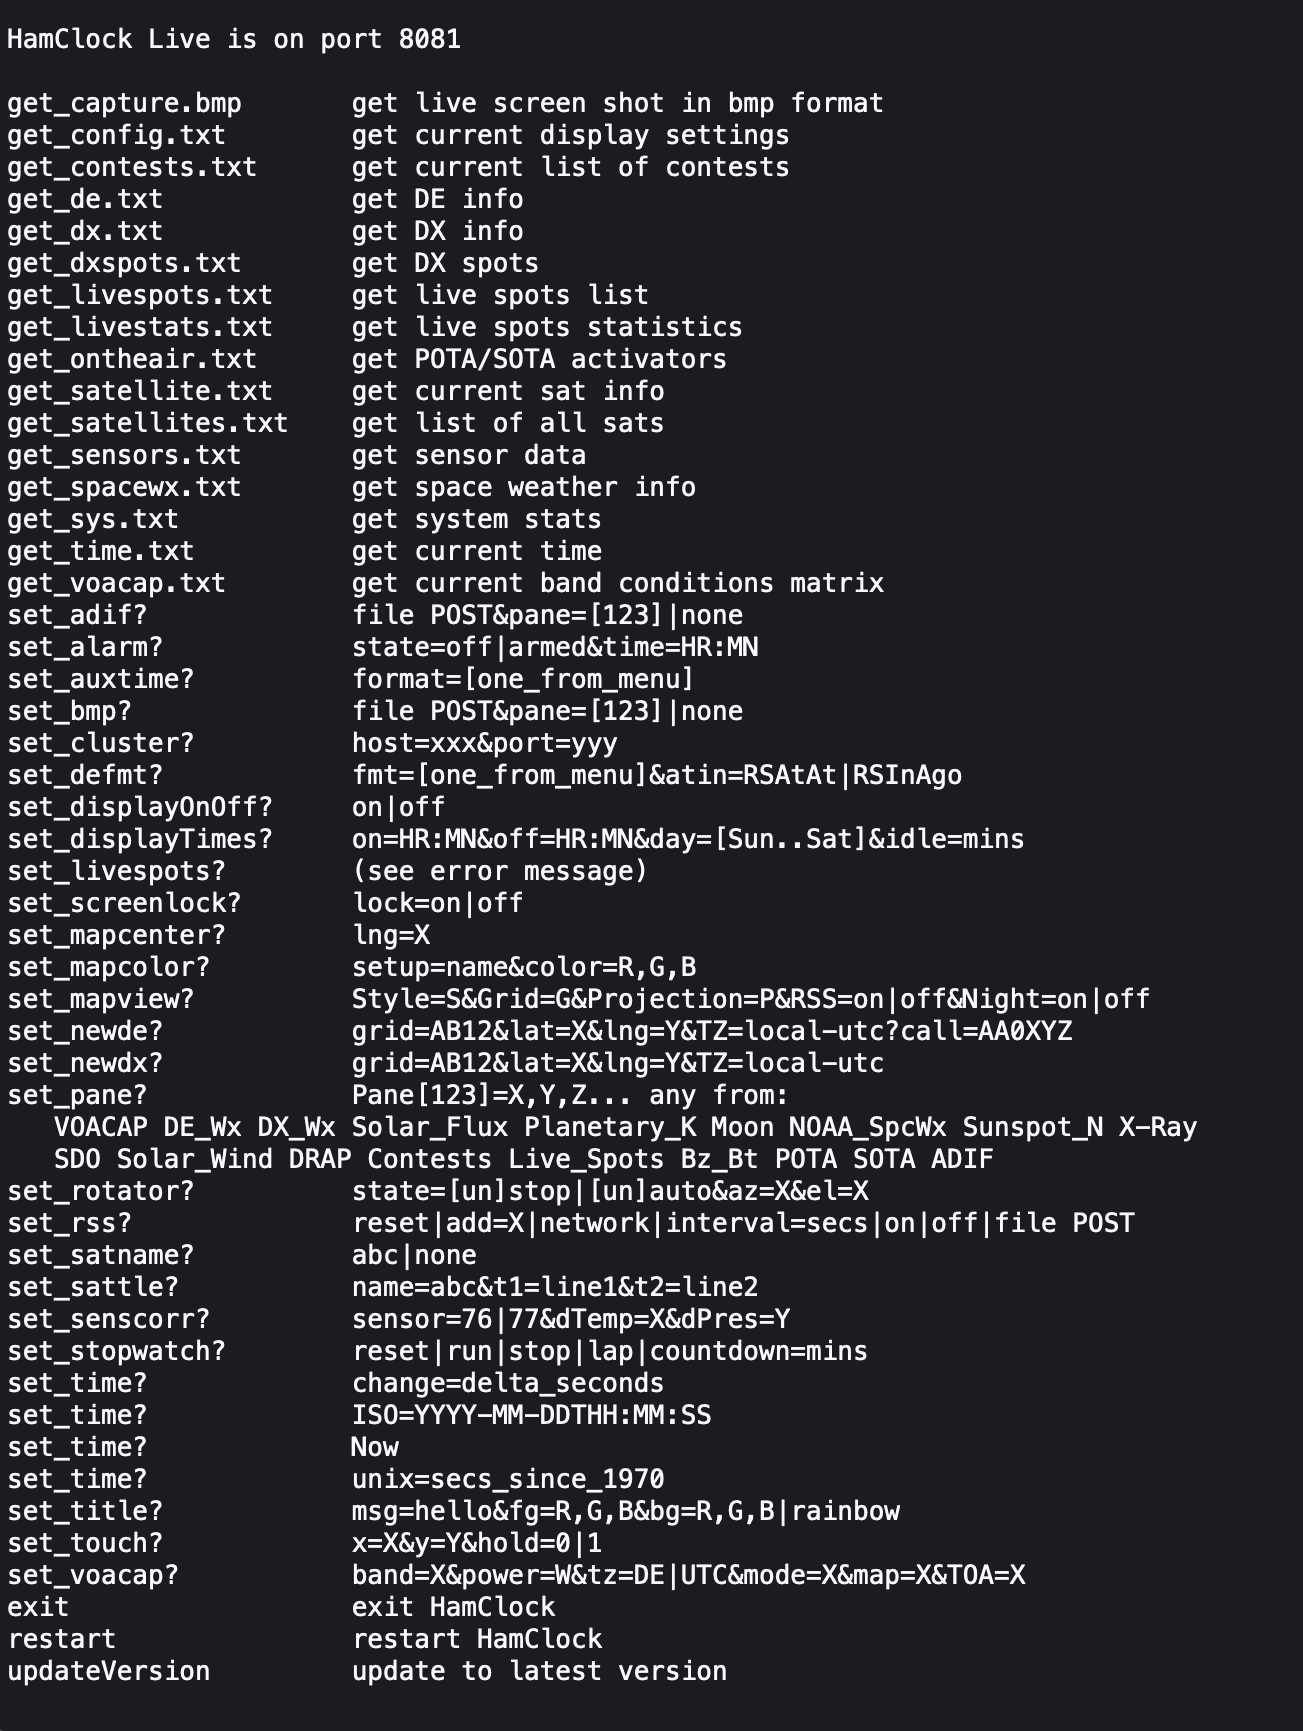
You can also control the HAM Clock remotely via web browser using a set of web commands that are detailed on port 8080 of the device.
http://<hostname or ip-address>:8080/
M0AWS – HAM Clock remote command set
This is a great addition to any HAM shack especially if, like me you have an old HDTV on the wall of the shack that is crying out to display something useful.
I’ve been making a few improvements to my QO-100 Node Red Dashboard whilst waiting for the 2.4Ghz hardware to arrive. I’ve added the ability to split the RX and TX VFOs so that I can tune away from the TX frequency for working split stations or for tuning to slightly off frequency stations. I also added a series of tuning buttons to the top of the GQRX side of the dashboard to enable easy tuning using the trackball connected to my Kubuntu PC. This worked well but, I really missed having a real VFO knob like a conventional radio.
As I had a Griffin Powewrmate USB VFO from a previous SDR radio I added it to the flow as well so that I had a physical VFO knob for the SDR receiver. Details on how I got it working using evtest and a simple BASH script are in the Griffin Powermate article.
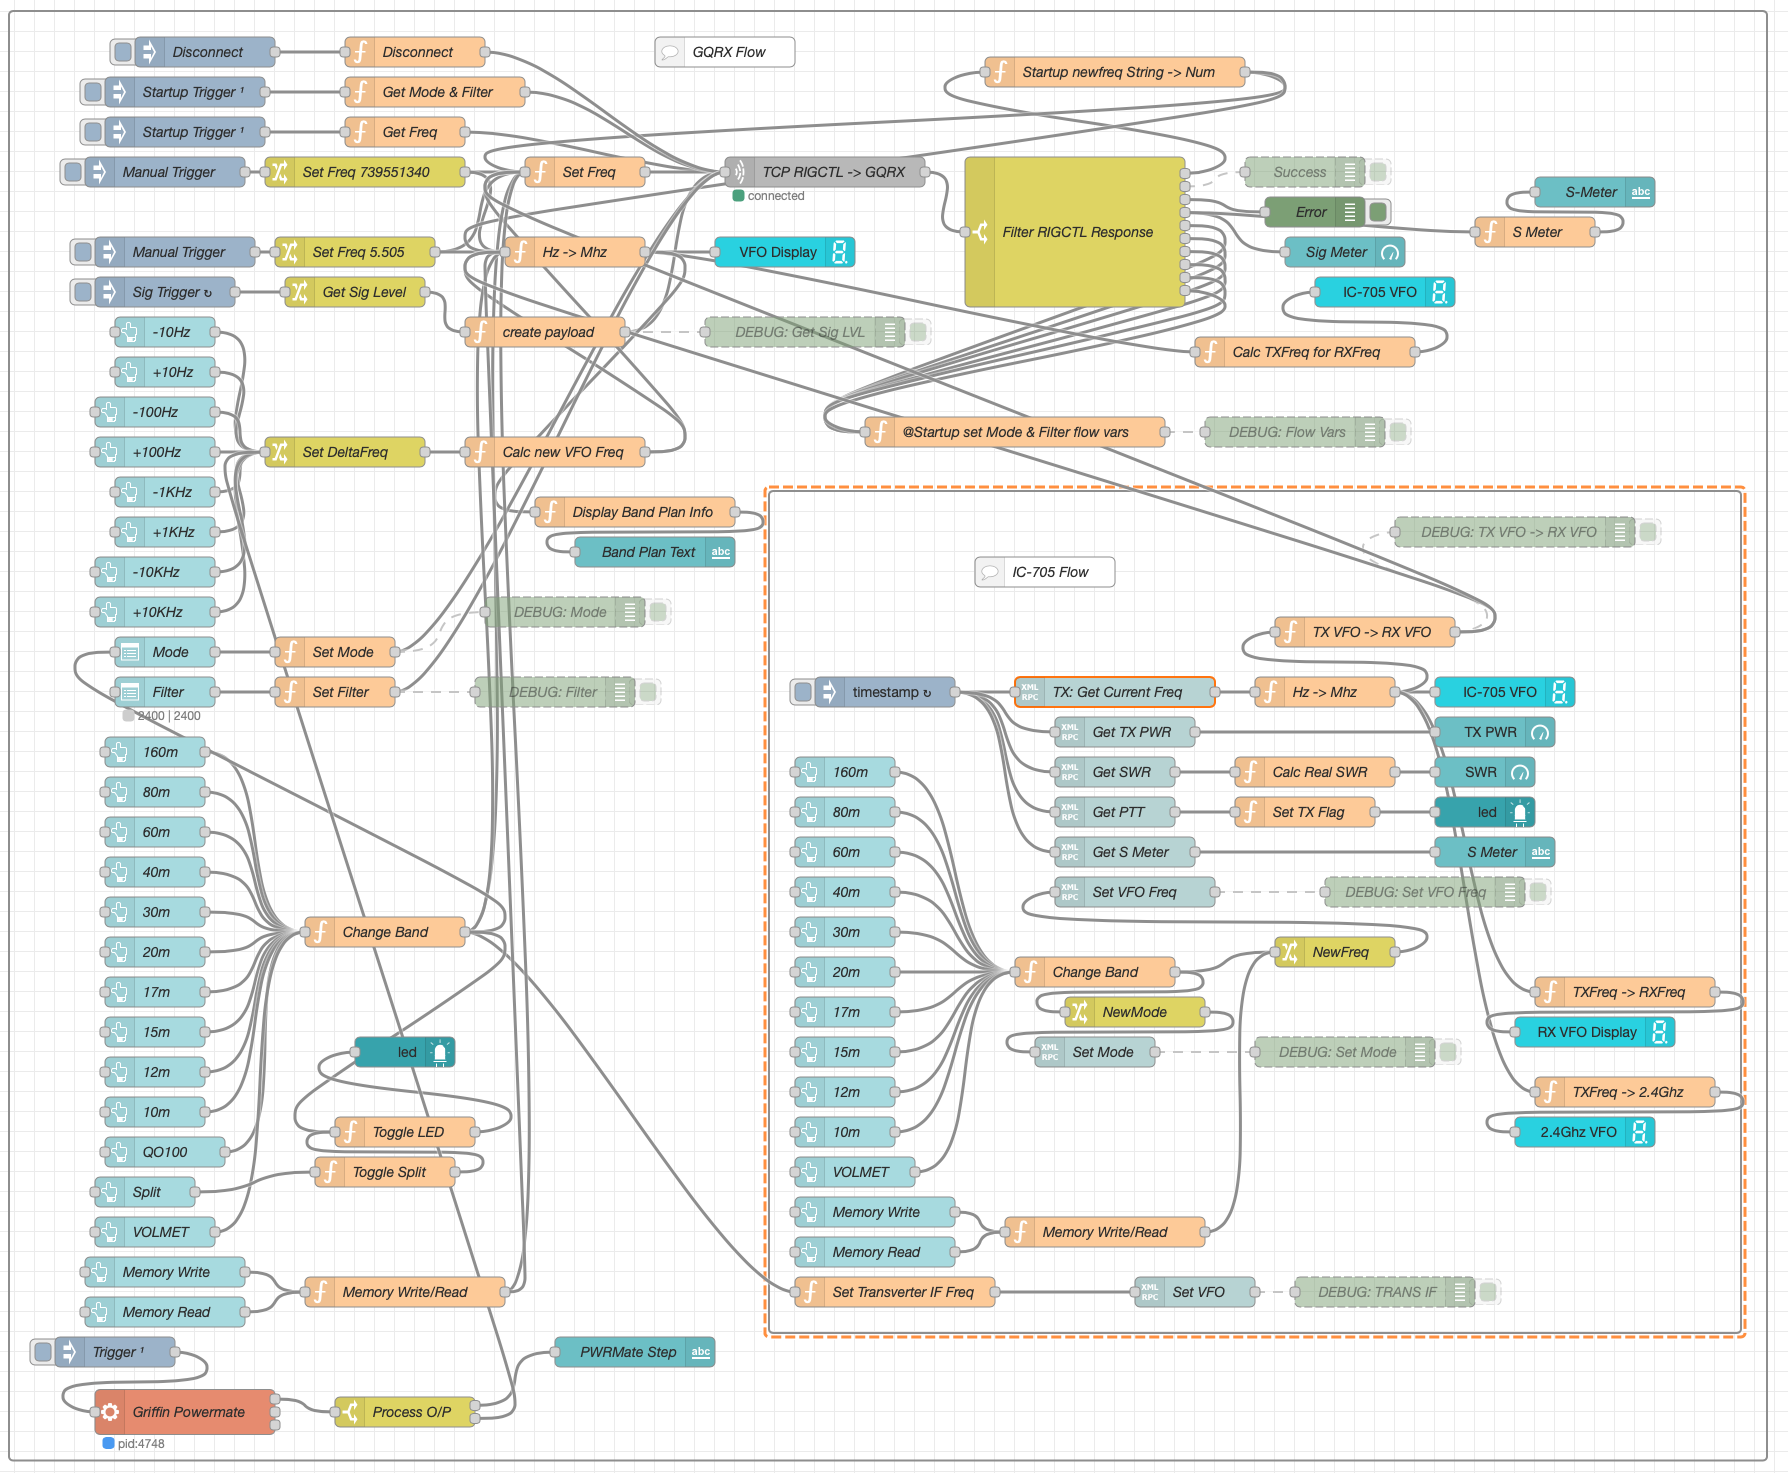
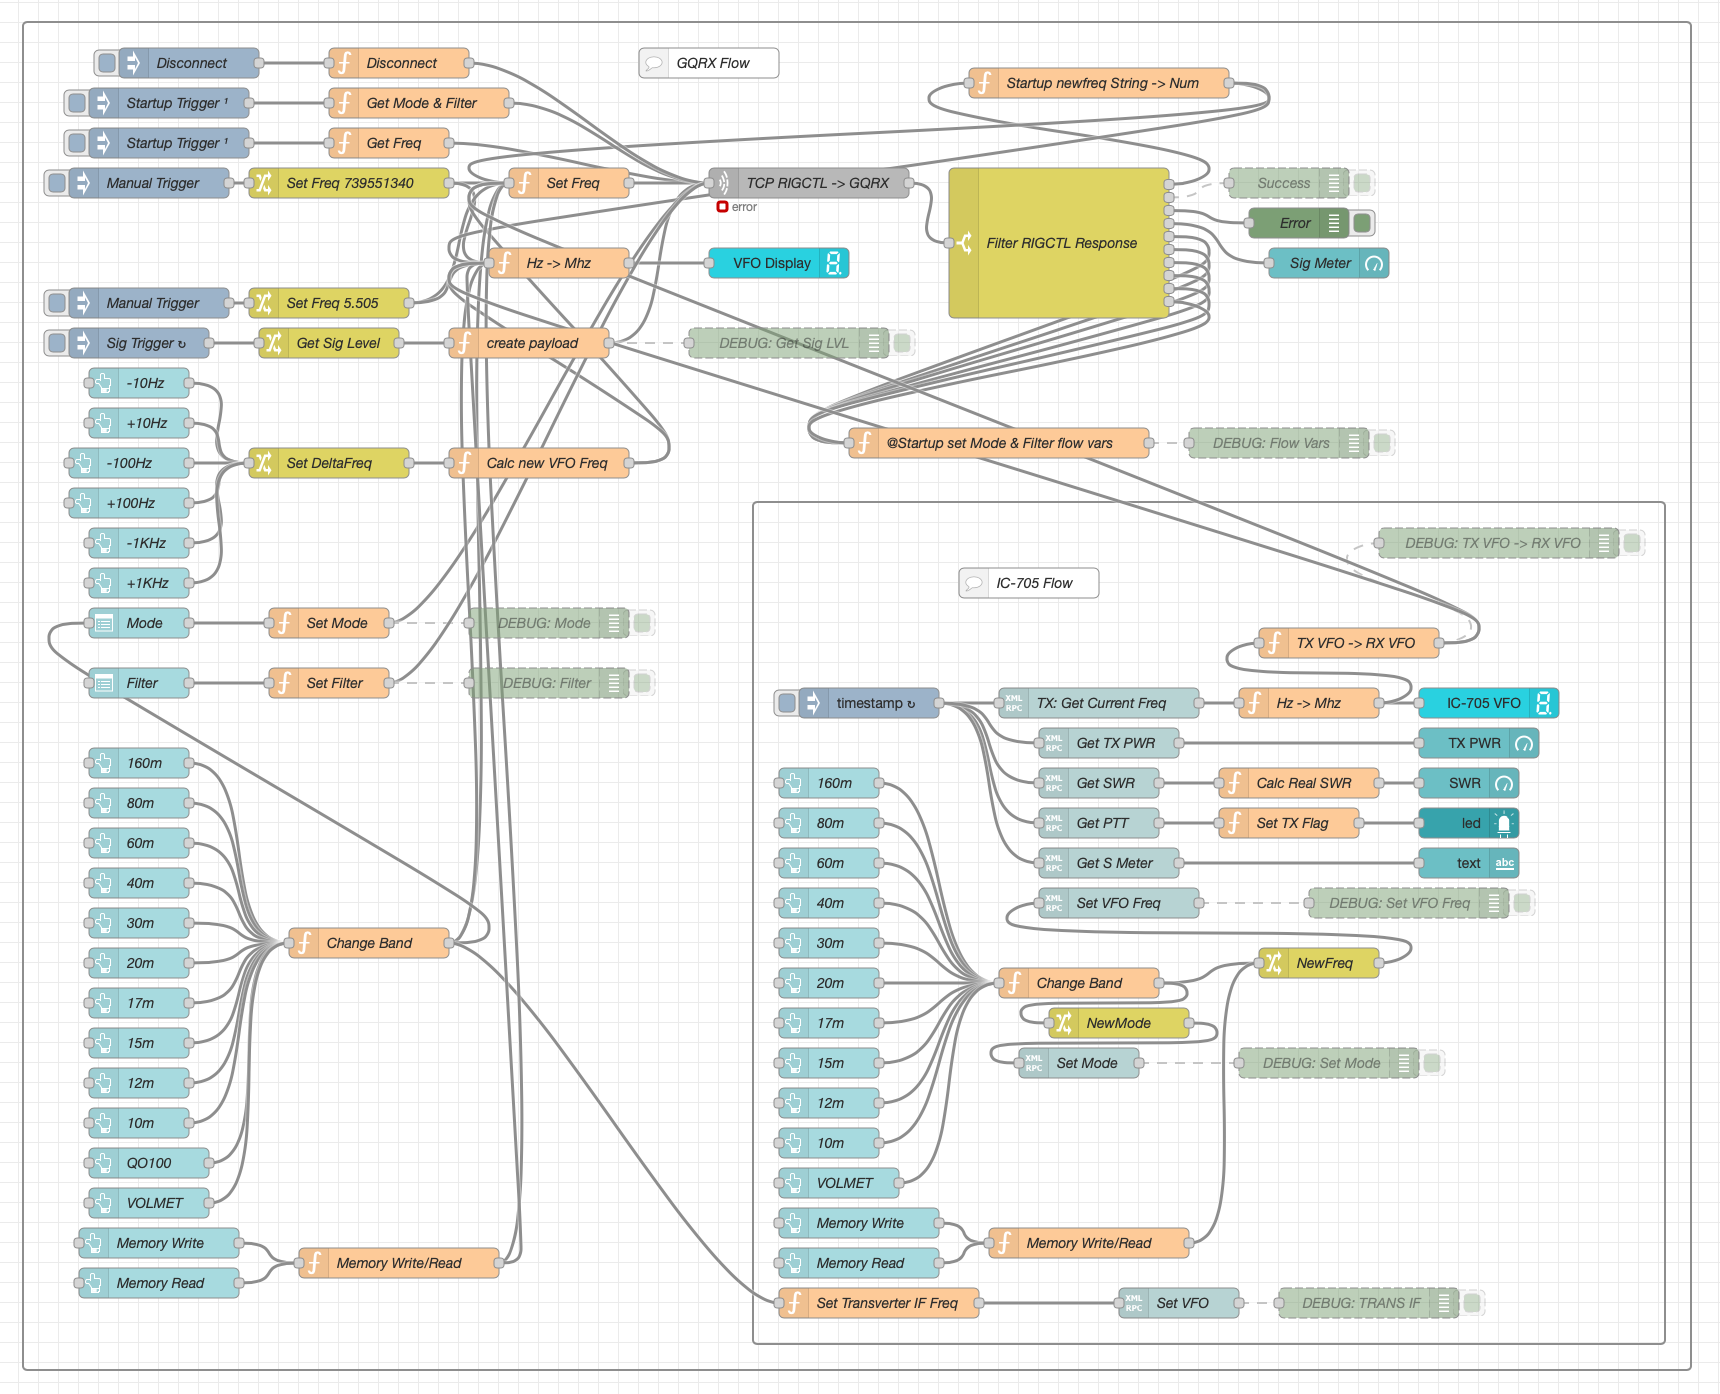
M0AWS QO-100 Node Red Dashboard Flow
The Node Red flow is looking a little busier with the addition of split mode and the Griffin Powermate USB VFO which has really enhanced the useability of the solution. It’s very impressive what can be achieved with Node Red with a little imagination. You really don’t need to be a heavy weight programmer to make things work.
M0AWS QO-100 Node Red Dashboard as of 07/06/23
I also put together some code to calculate the S Meter reading from the dBFS data the GQRX SDR software generates. It’s not 100% accurate but, it’s close enough to be useful.
On the IC-705 side of the Dashboard I also now display the 2.4Ghz uplink frequency so that it’s available for logging.
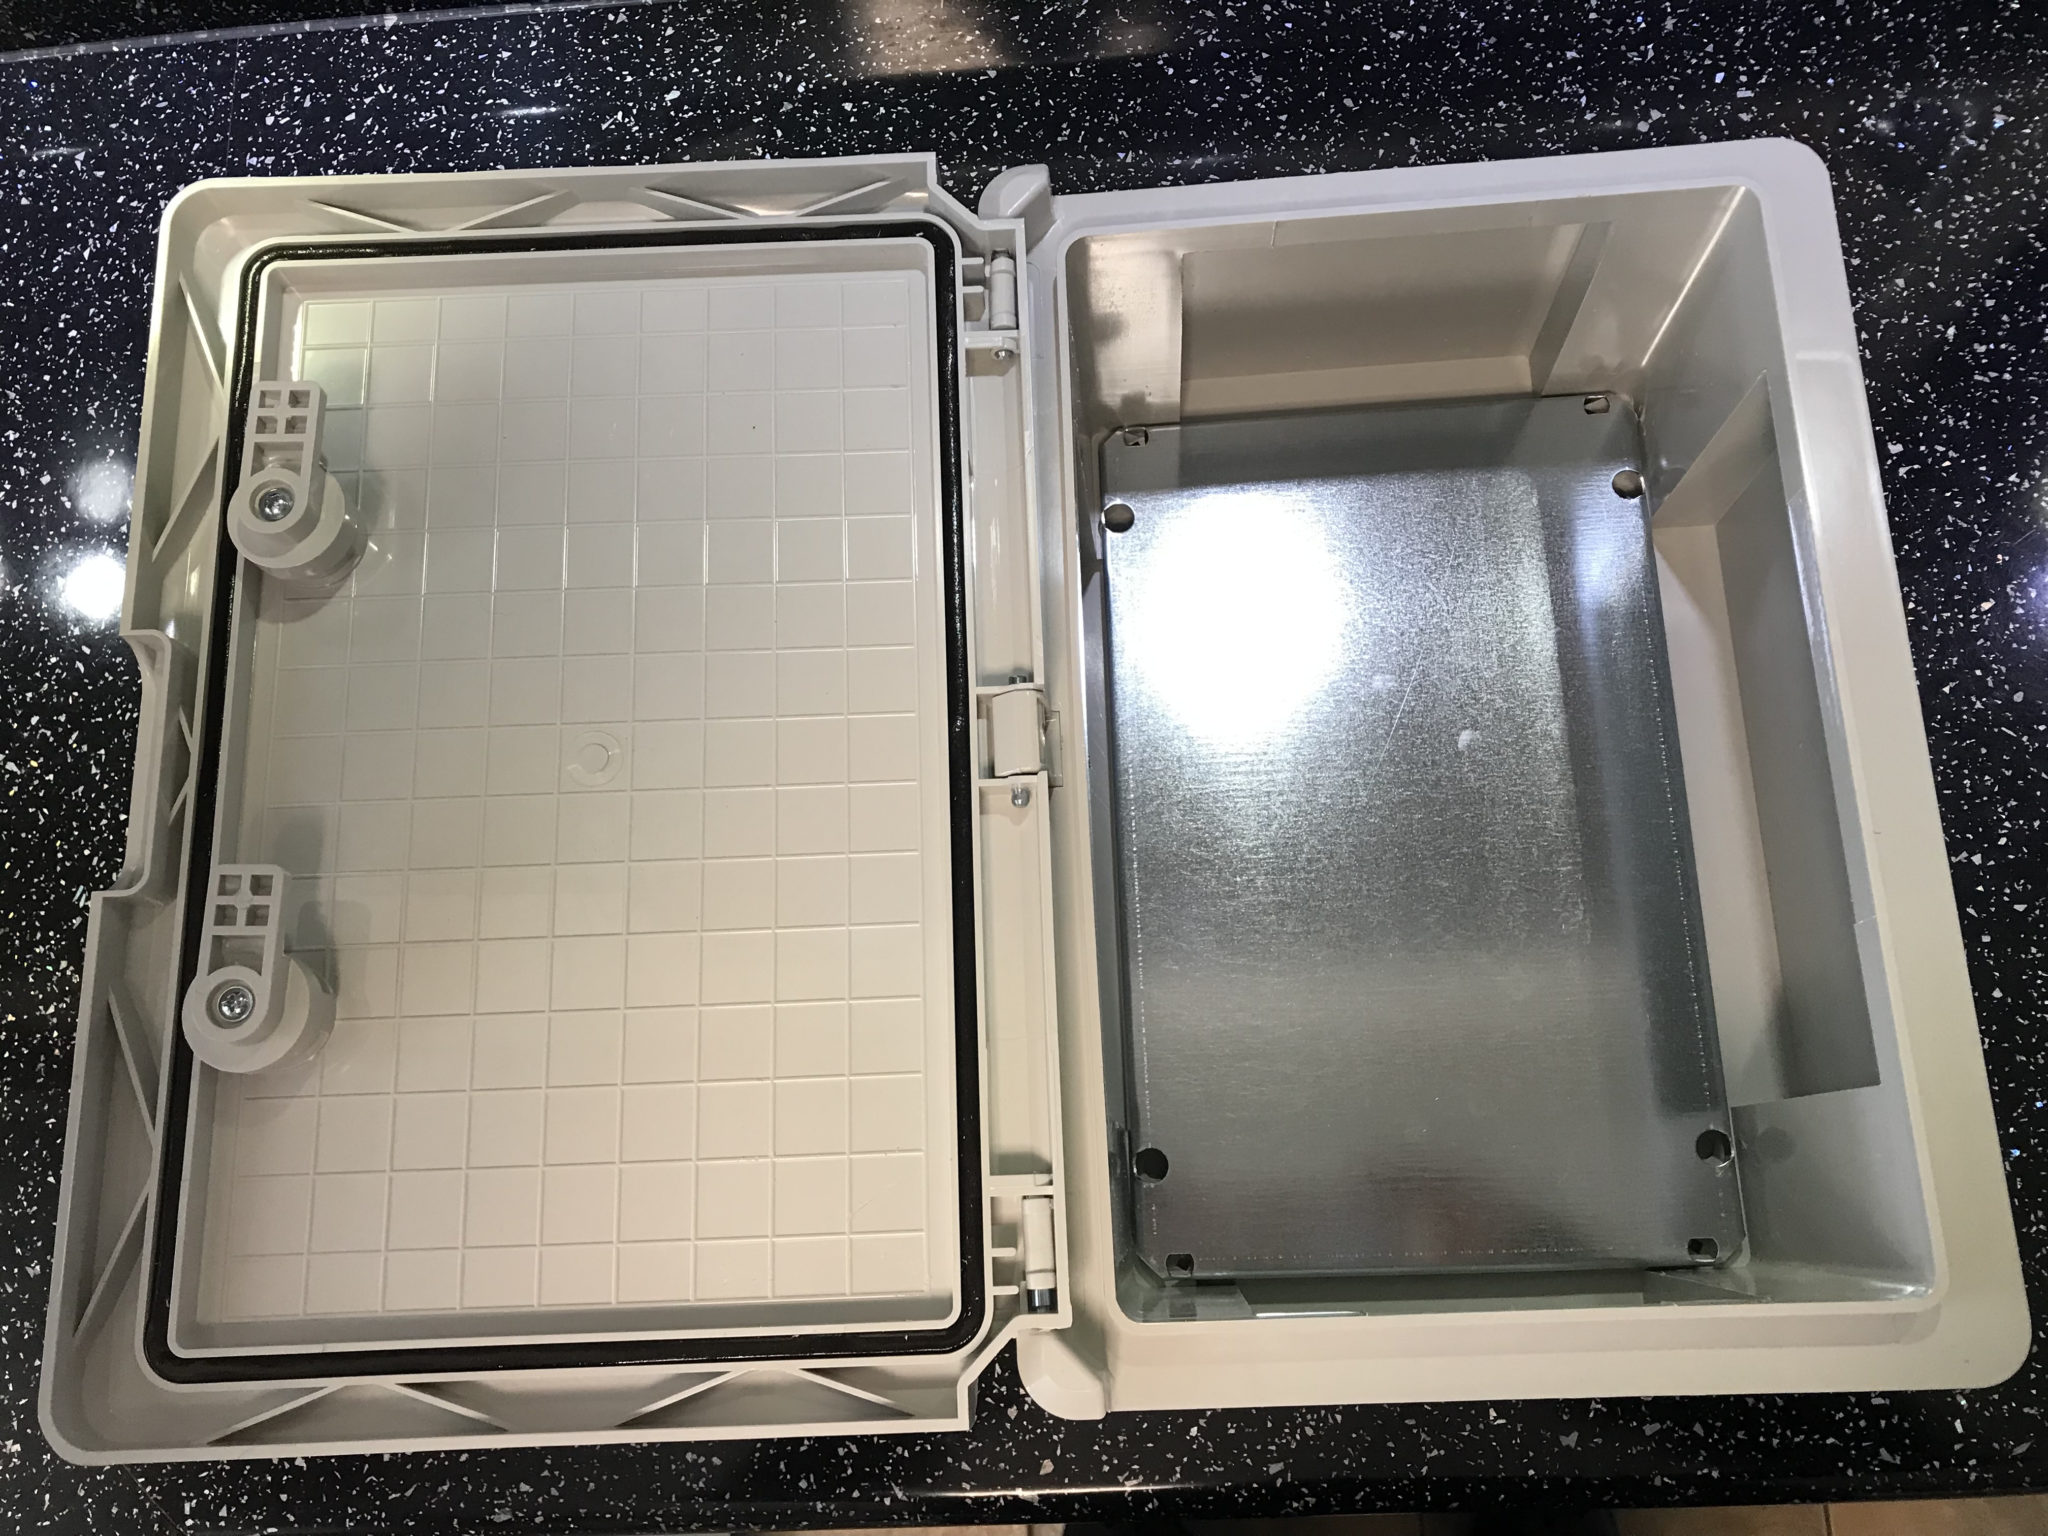
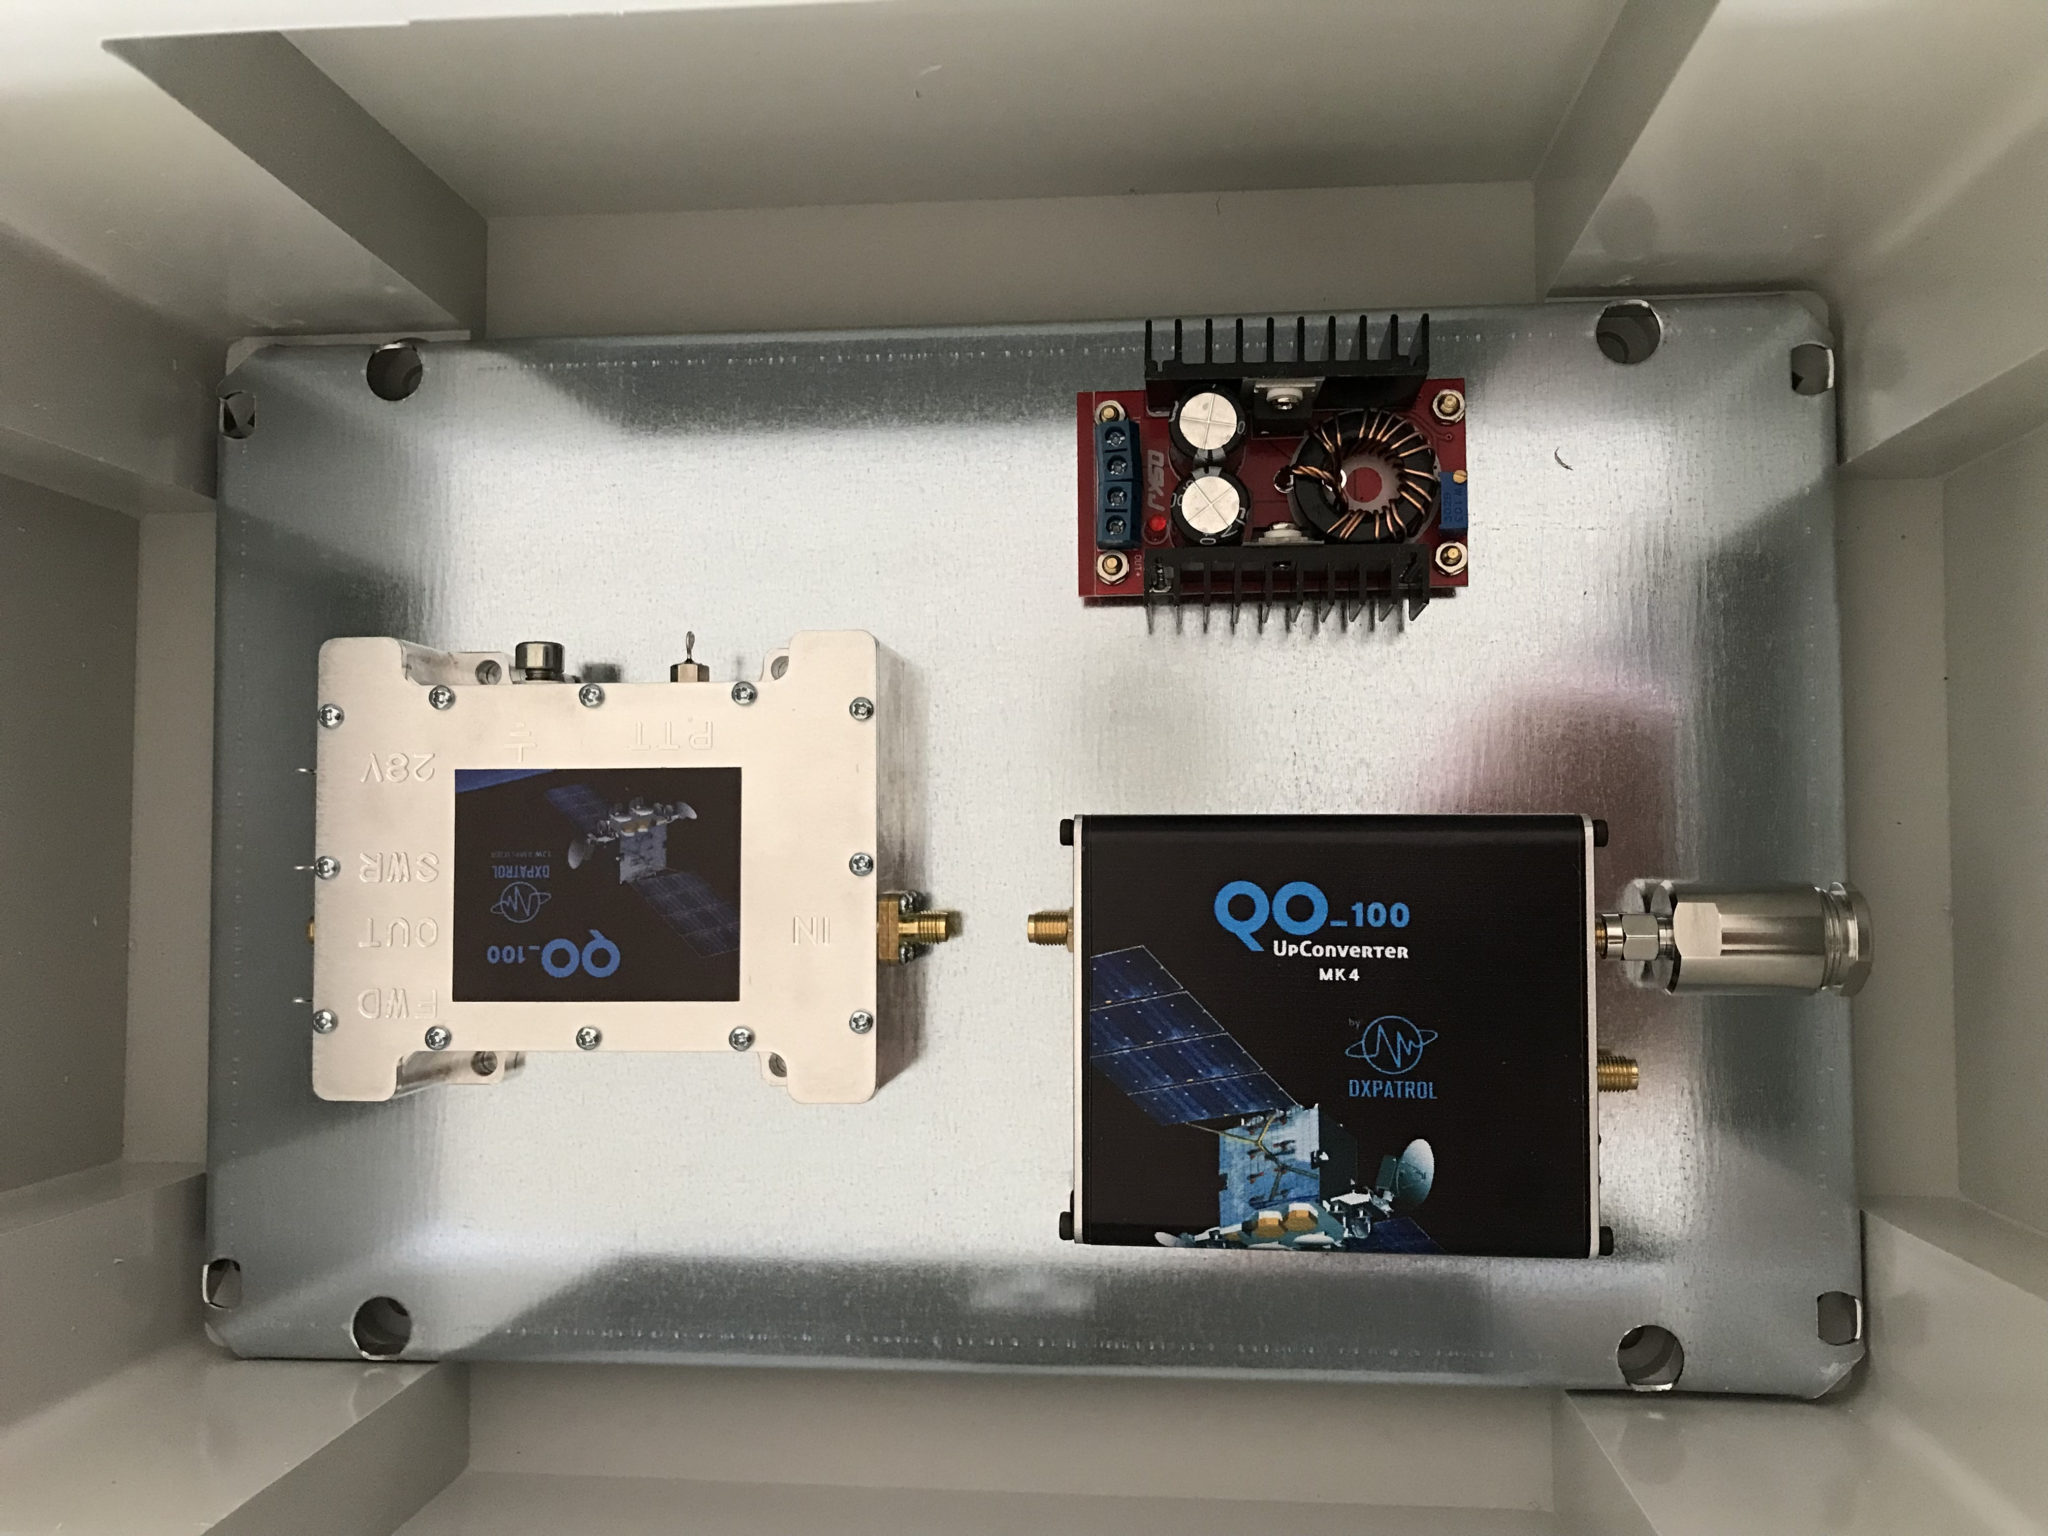
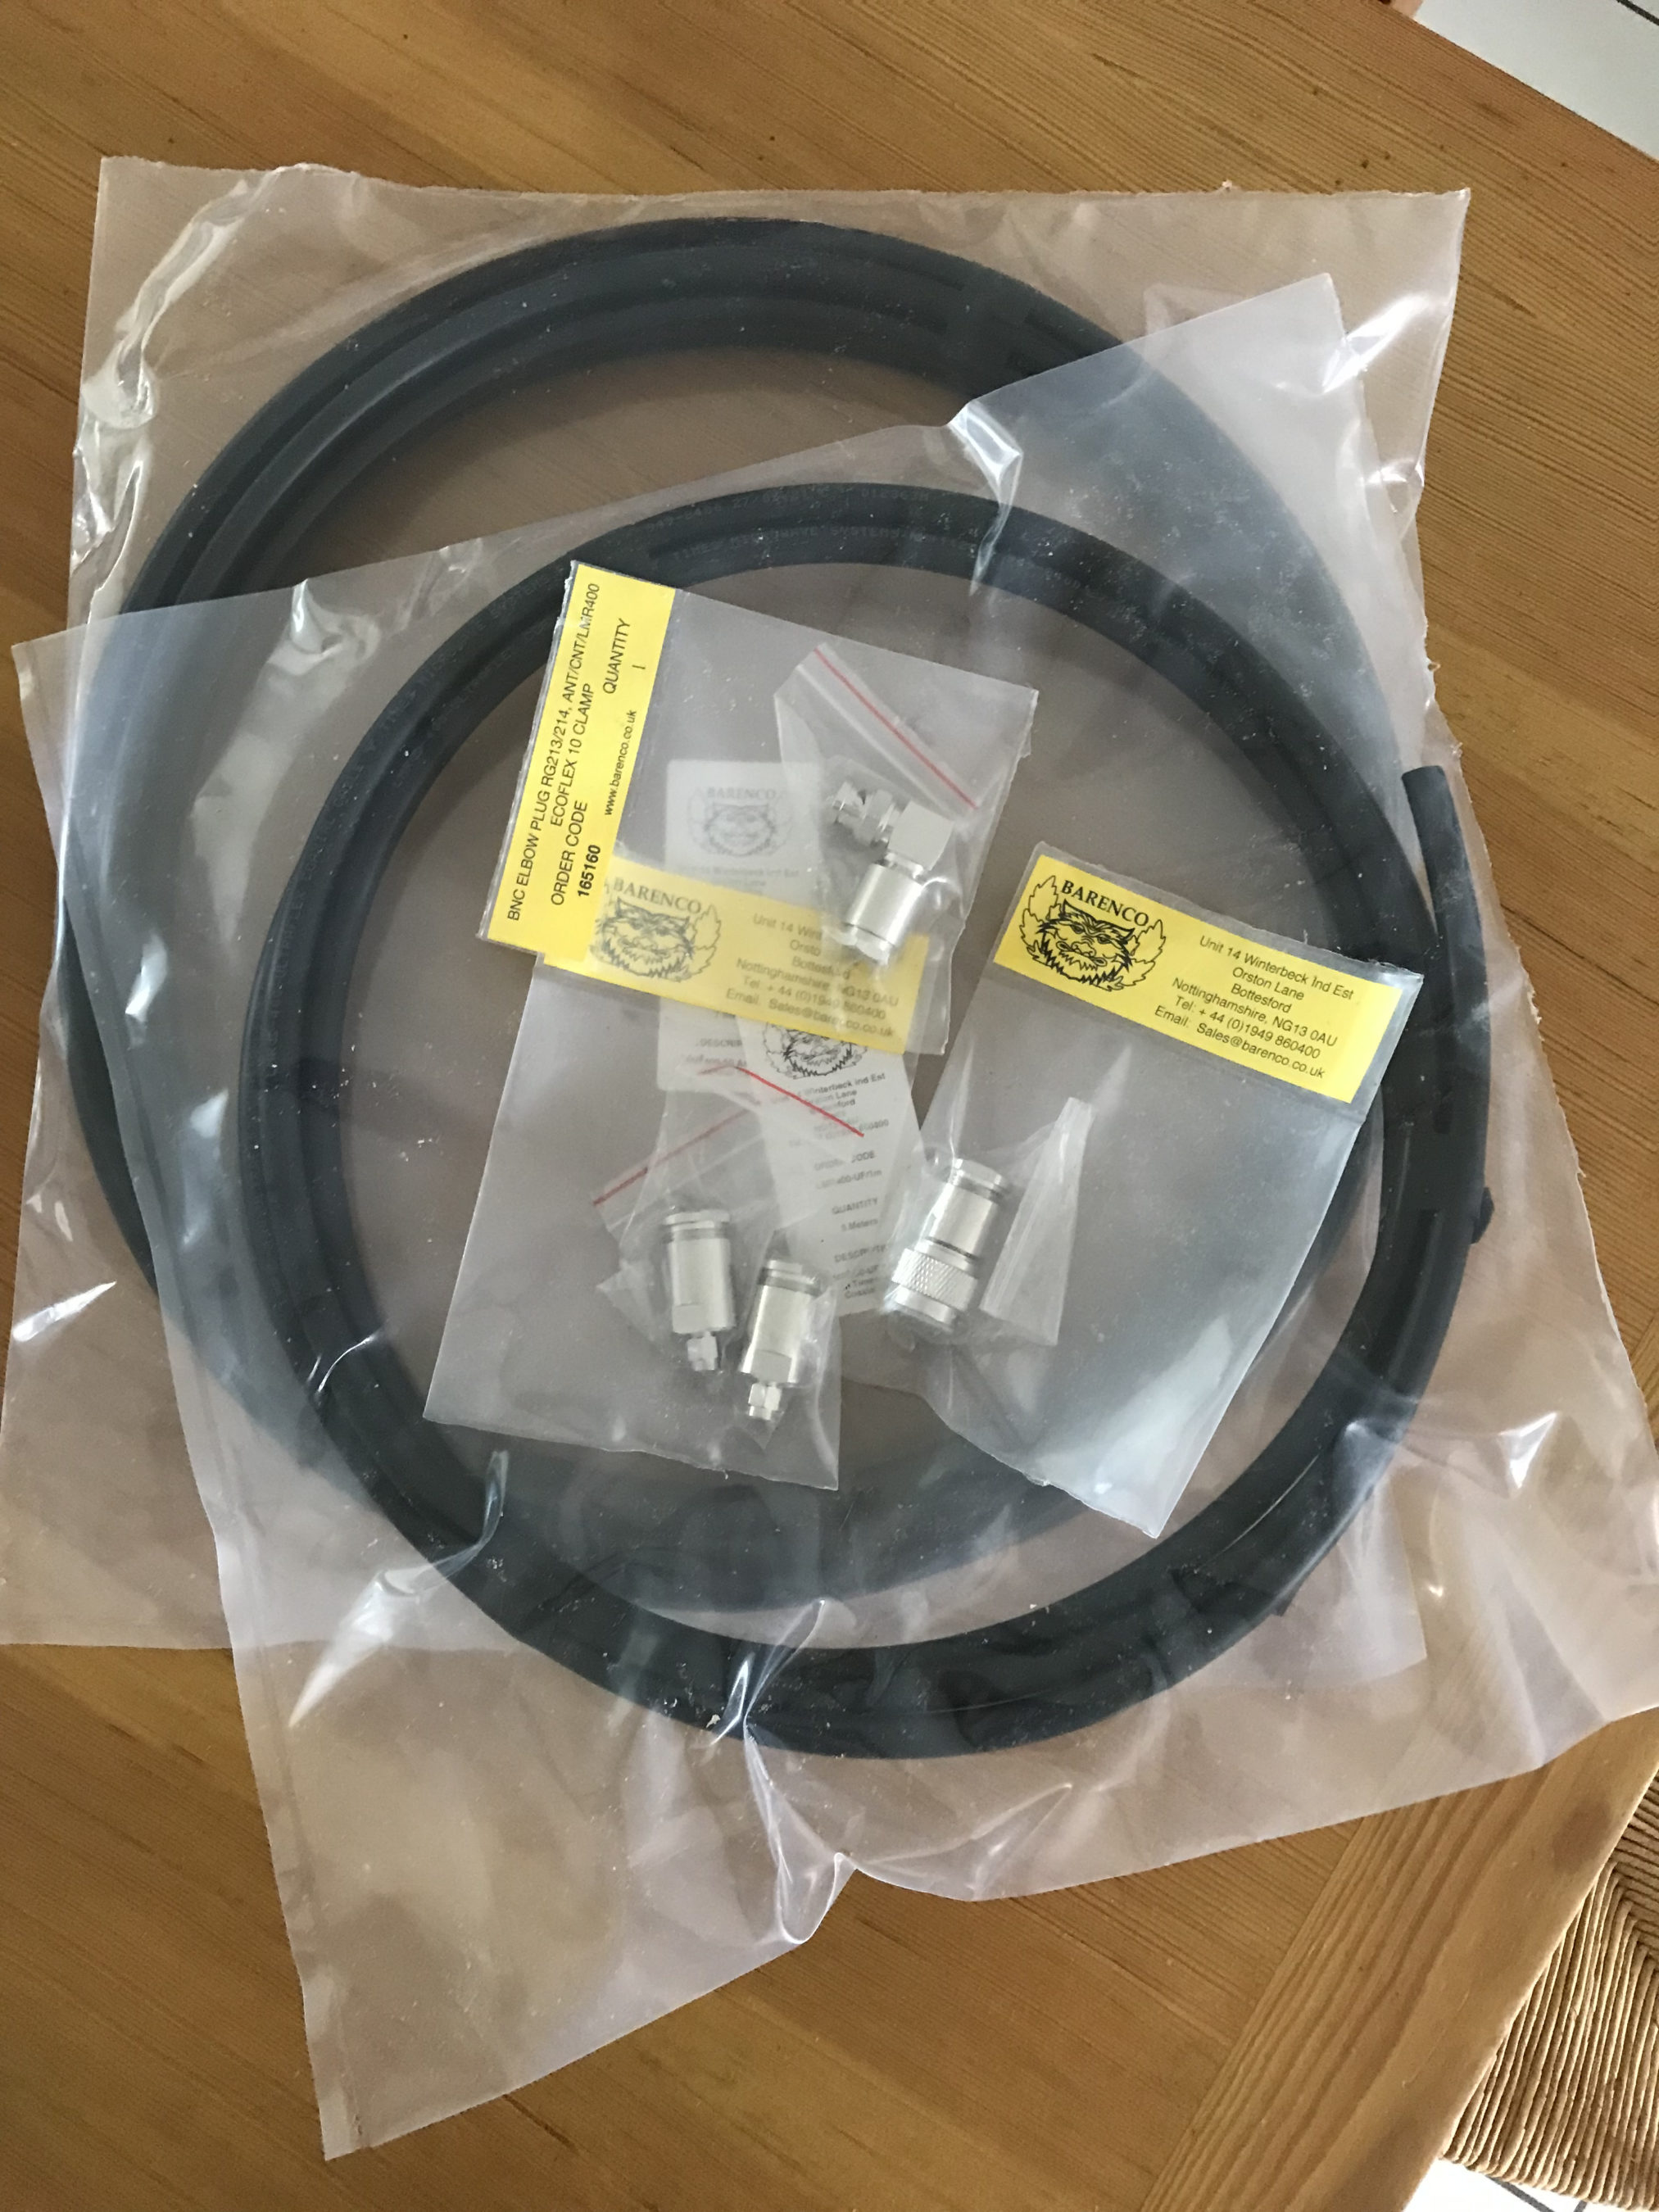
So with the QO-100 Dashboard ready to go live I have now started putting together the 2.4Ghz transmit path of the ground station. I have the 2.4Ghz transverter and matching 12w amplifier from DXPatrol, the IceCone Helix 2.4Ghz antenna from Nolle Engineering, some LMR-400-UF and connectors from Barenco and an appropriate water proof enclosure from Screwfix to fit all the kit into however, I’m now being held up by one simple little SMA male to SMA male connector that I need to connect the transverter and amp together.
M0AWS Waterproof enclosure from ScrewfixM0AWS Laying out the 2.4Ghz TX kit in the enclosureM0AWS LMR-400-UF coax from Barenco
The SMA connector has been ordered but, is taking a month of Sundays to arrive! Hopefully it’ll arrive soon and I’ll finally get on the QO-100 satellite and start enjoying the fun.
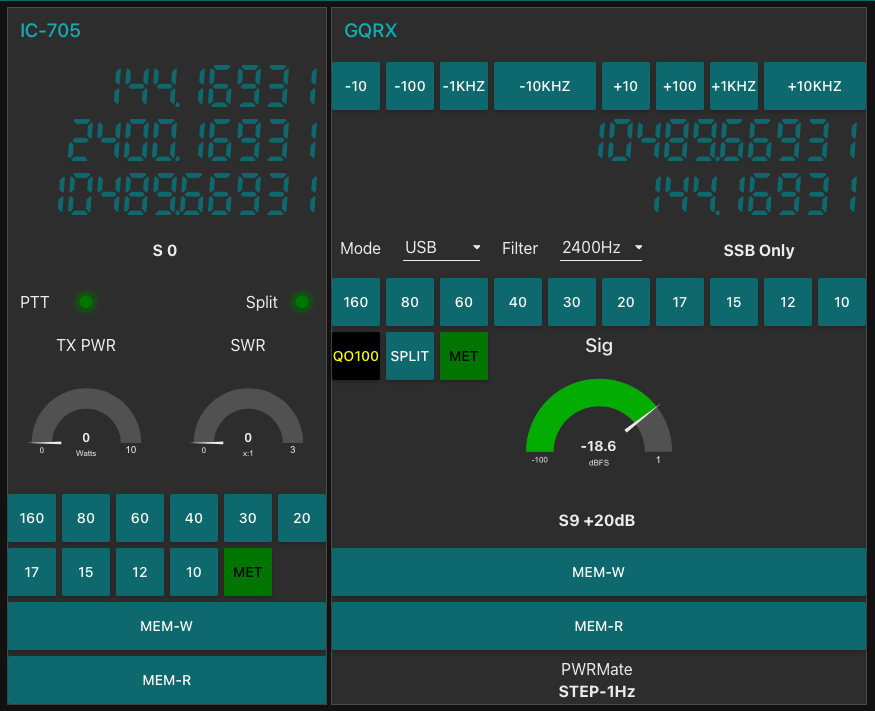
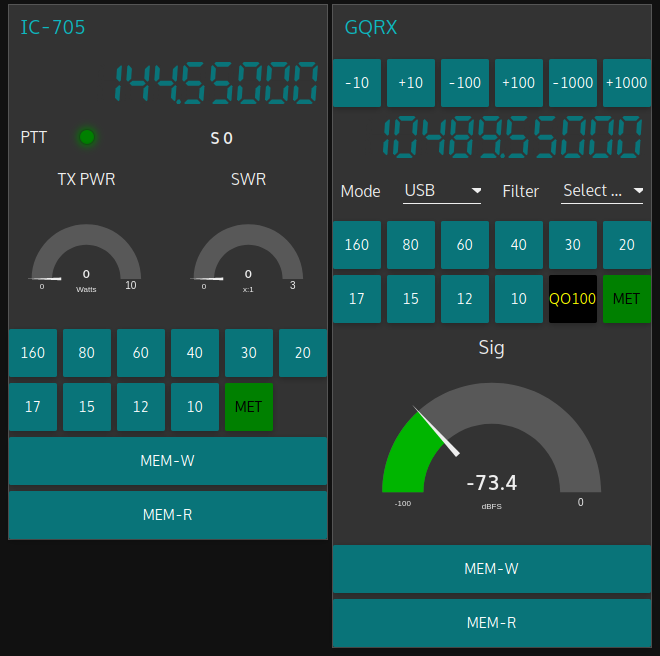
I’ve now completed the GQRX Receive and Icom IC-705 Transmit dashboard in Node Red. It was a fun project to put together and needed some javascript coding to get the functionality I wanted but, I got there in the end.
M0AWS QO-100 GQRX/IC-705 control dashboard
The dashboard looks fairly simple but, there is a lot behind the scenes to get it to this stage.
On the left is the Icom IC-705 transmit control panel. It shows the transmit frequency, power output and SWR reading. The SWR is so that I can check that the input into the 2.4Ghz transverter doesn’t have any connectivity issues. The “S0” will actually display the S Meter reading when the IC-705 is being used as a normal transceiver rather than being in QO-100 Duplex mode as shown above where the GQRX app and Funcube Dongle SDR are being used as the receiver.
The GQRX side of the dashboard shows the downlink frequency which tracks the uplink frequency of the VFO on the IC-705. This will ensure that the Funcube Dongle Pro+ SDR receiver will always be on the correct downlink frequency relative to the uplink frequency, thus I should always be able to hear my own signal coming from the QO-100 satellite.
Once taken out of QO-100 mode the two radios can be used independently on any of the HAM bands and can be switched using the buttons on the dashboard.
I also coded in a simple memory facility where a frequency can be stored in Node Red and recalled later on both the transmit and receive sides.
Looking at the dashboard it all looks simple and straight forward however, if you look at the Node Red flow it becomes obvious that this isn’t the case.
QO-100 Dashboard Flow in the Node Red Editor (Click for larger image)
There’s a lot to the flow to get the information from the receiver and transmitter so that it can be presented on the dashboard. There’s also some code to convert between Rigctl protocol used by the GQRX application and XMLRPC used by the IC-705 via FLRig and WFview. I had to also code around a bug in the Node Red XMLRPC node whereby you have to add 0.1 onto the VFO frequency for it to be passed onto the radio otherwise the information is never sent. This was a real pain of a bug to find but, with a little experimentation I found the problem and managed to code around it. The strange thing about this is that the 0.1 added onto the frequency isn’t actually passed onto the radio via the XMLRPC node, it just has to have that on input otherwise it doesn’t work at all. A very strange bug and hopefully one that will be fixed by the node developer in future releases.
All that is left to do now is add the temperature sensors dashboard to complete the dashboard. These haven’t arrived yet and so I’ve not been able to create the necessary flow to collect the data from them.
Hopefully this coming week the weather will improve and I’ll start getting the dish antenna up and the get the receive side working.
UPDATE: Further development of my QO-100 Dashboard has taken place, you can read all about it here.
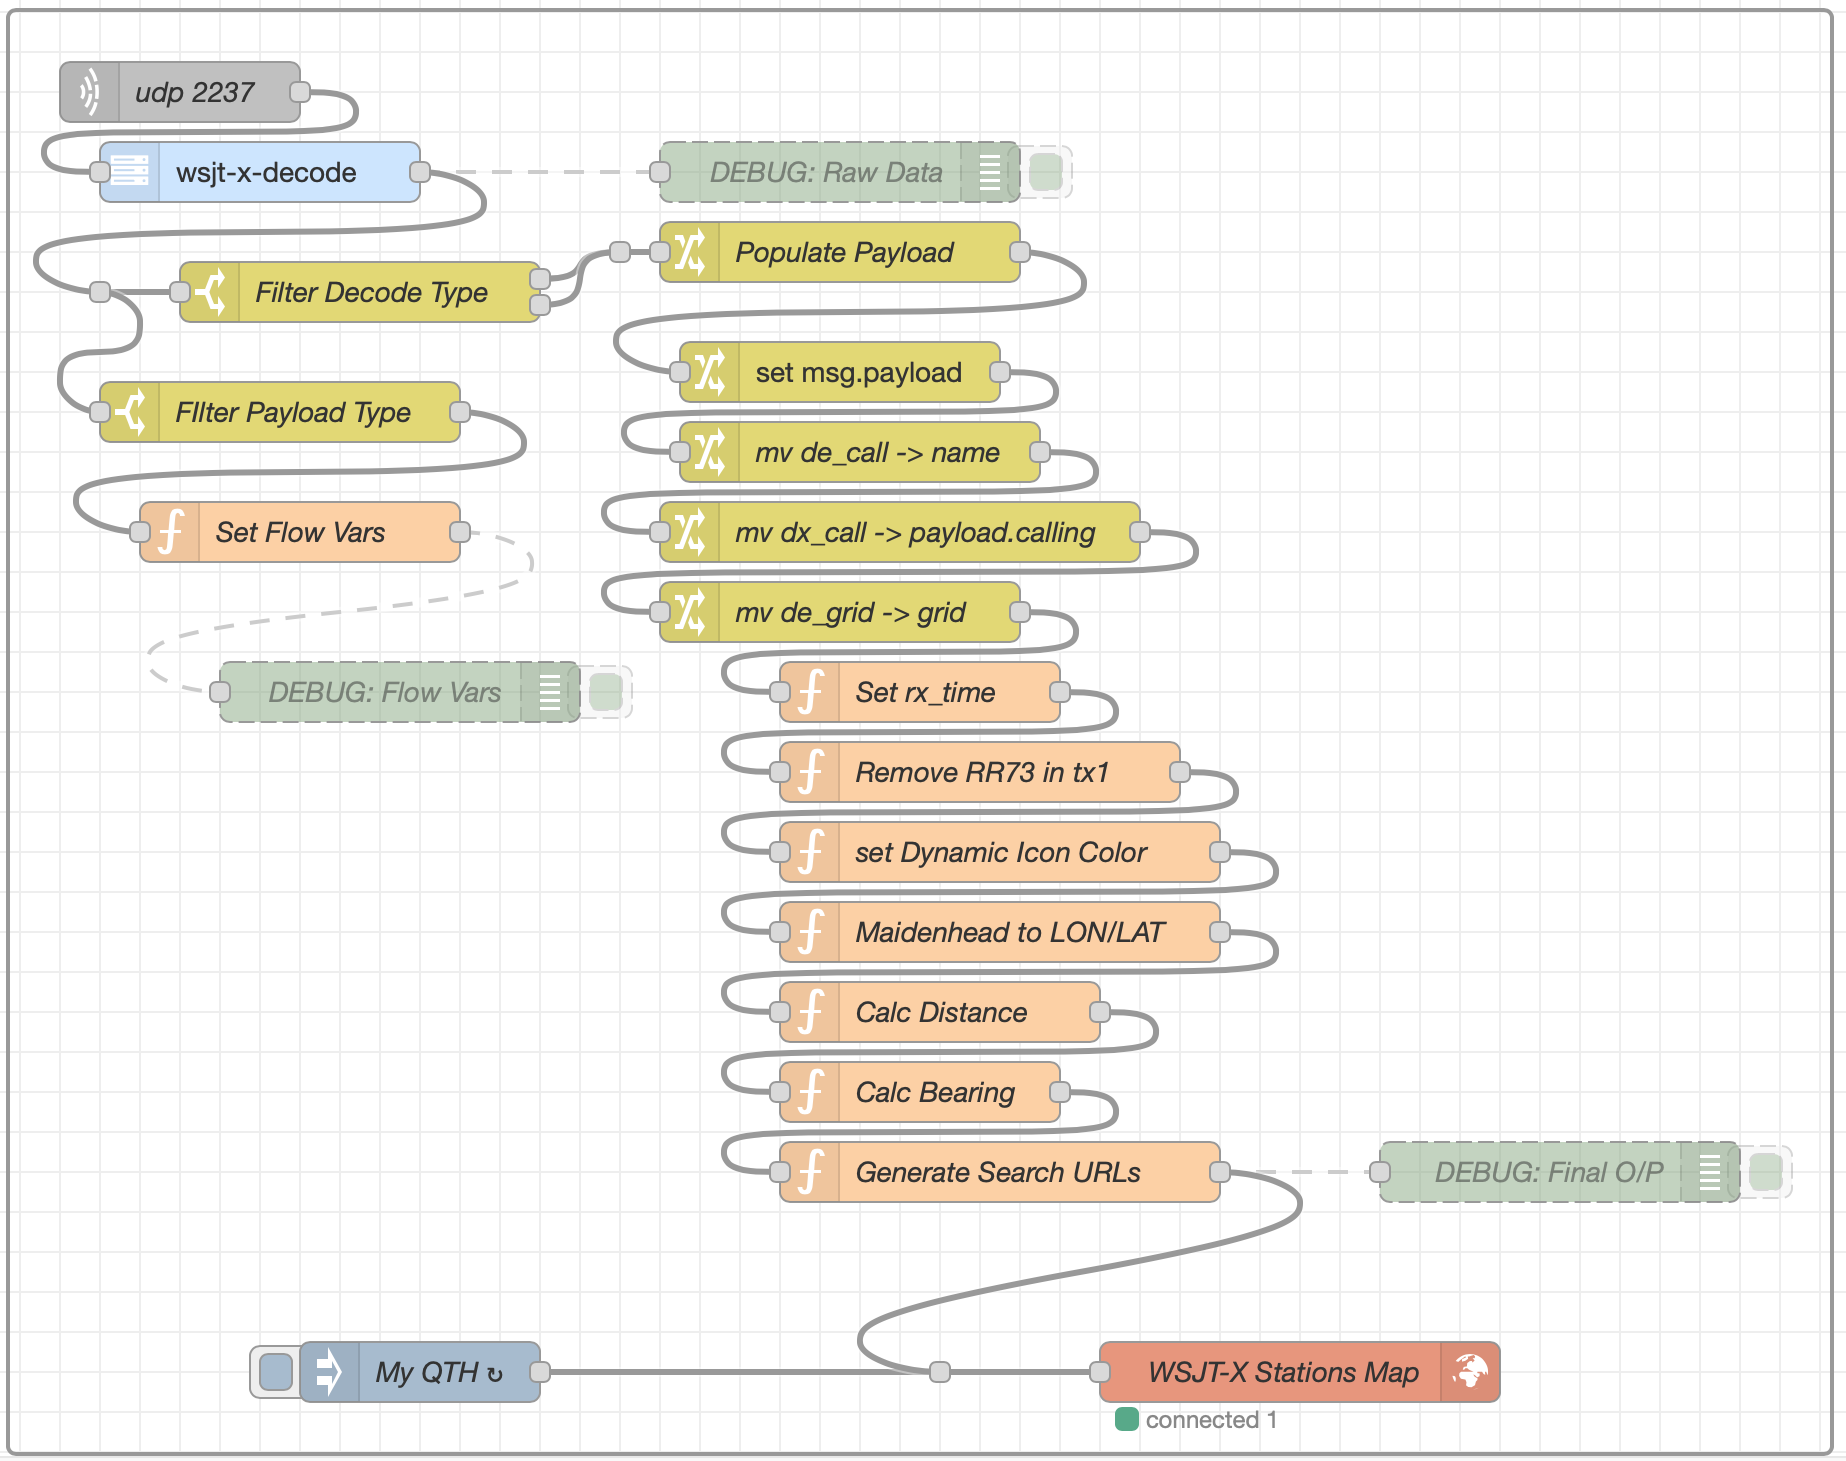
Following on from my initial article on plotting realtime WSJT-X decodes on a Node Red map I’ve made a few enhancements to the flow so that it includes even more data then before.
The additions to the flow now enables collection of status information from WSJT-X so that the flow is able to capture the frequency that the radio is tuned to and also the mode that WSJT-X set to. Neither of these two bits of data are in the decode message payload and so a separate mini-flow has to be created to collect the data from the status payload along side the other main flow.
Node Red flow showing additional sub flow in the top left corner of the flow editor screen
Since the status information needs to be available to all other flows I used flow variables to store the status information in so that it can be addressed directly from any of the other flows in the Node Red app.
If you’d like to use the flow in your radio room then I have put a download link below for a file that you can import into Node Red and build the flow in an instant.
We use cookies to ensure that we give you the best experience on our website. If you continue to use this site we will assume that you are happy with it.